Research Note: Compact Depth from Extreme Points: a tool for fast potential field imaging
ABSTRACT
We propose a fast method for imaging potential field sources. The new method is a variant of the “Depth from Extreme Points,” which yields an image of a quantity proportional to the source distribution (magnetization or density). Such transformed field is here transformed into source-density units by determining a constant with adequate physical dimension by a linear regression of the observed field versus the field computed from the “Depth from Extreme Points” image. Such source images are often smooth and too extended, reflecting the loss of spatial resolution for increasing altitudes. Consequently, they also present too low values of the source density. We here show that this initial image can be improved and made more compact to achieve a more realistic model, which reproduces a field consistent with the observed one. The new algorithm, which is called “Compact Depth from Extreme Points” iteratively produces different source distributions models, with an increasing degree of compactness and, correspondingly, increasing source-density values. This is done through weighting the model with a compacting function. The compacting function may be conveniently expressed as a matrix that is modified at any iteration, based on the model obtained in the previous step. At any iteration step the process may be stopped when the density reaches values higher than prefixed bounds based on known or assumed geological information. As no matrix inversion is needed, the method is fast and allows analysing massive datasets. Due to the high stability of the “Depth from Extreme Points” transformation, the algorithm may be also applied to any derivatives of the measured field, thus yielding an improved resolution. The method is investigated by application to 2D and 3D synthetic gravity source distributions, and the imaged sources are a good reconstruction of the geometry and density distributions of the causative bodies. Finally, the method is applied to microgravity data to model underground crypts in St. Venceslas Church, Tovacov, Czech Republic.
INTRODUCTION
Inversion of potential field data is a powerful interpretation tool, which provides a meaningful description of the distribution (magnetization or density) of the sources. Many algorithms of inversion have been developed for potential field data, e.g., (Parker 1972; Last and Kubik 1982; Li and Oldenburg 1998; Pilkington 1997, 2009; Fedi and Rapolla 1999; Paoletti et al. 2014; Portniaguine and Zhdanov 1999, 2002; Silva et al. 2001). Generally, inverse methods are computationally expensive; moreover, the source models depend on the used a priori information and constraints (Pilkington 1997).
In addition to inversion, imaging methods may provide a fast preliminary picture of the source distribution. All imaging methods have been shown equivalent to a depth-weighted upward continued field (Fedi and Pilkington 2012). The imaging method proposed by Fedi (2007), i.e., the “Depth from Extreme Points” (DEXP) method, is based on multiplying the upward continued field with a scaling function. The scaling function is related to the structural index, which is a source-related parameter, which may be directly estimated by the field itself by a number of methods such Euler deconvolution (Reid et al. 1990) or multi-ridge methods (Fedi, Florio, and Quarta 2009; Fedi, Florio, and Cascone 2012). DEXP allows estimating the excess mass (or the dipole moment intensity in the magnetic case), the depth, and the structural index of the causative source. The depth and the mass are estimated at the extreme points of the DEXP transformed field. Moreover, the depth to sources can also be estimated by a geometric method called multi-ridge method (Fedi et al. 2009; Fedi et al. 2012).
Wan and Zhdanov (2013) introduced iterative migration of gravity and gravity gradiometry data, using either a smooth or focused stabilizer. They used the integrated sensitivity of the kernel matrix instead than a depth weighting function (Portniaguine and Zhdanov 2002). This weight is based on the kernel matrix of the potential field problem; therefore, it does not depend on the source distribution. This may cause a bias in the retrieved source distribution because weighting must be related to the actual source distribution for optimal results (Fedi and Pilkington 2012; Cella and Fedi 2012 and Paoletti et al. 2013).
Imaging methods (e.g., Cooper 2006; Fedi and Pilkington 2012) often give images not too detailed of the source distribution. This is especially true for the deep sources, which are imaged at high altitudes and therefore have a loss of resolution related to the upward continuation smoothing effect. In this paper, we use a compacting function similar to the one used by Pilkington (2009), to reduce the total area (or volume in 3D) of the source distribution. We establish an iterative process, which yields at each step a higher degree of compactness and, correspondingly, increasing values of density (or magnetization intensity). The process continues until a geologically reasonable model is produced. Boundary constraints on density can be also applied, to reconstruct a better image of the source.
THEORY OF THE COMPACT DEPTH FROM EXTREME POINTS METHOD
 (1)
(1) (2)
(2)The correct position of the source and the source excess mass are simply estimated at the extreme points of  . DEXP transformation is also an imaging method, producing an image of the source distribution. Provided that N is correctly estimated or assumed, DEXP was shown to provide a more correct source image if compared with other imaging methods, such as correlation or migration (Fedi and Pilkington 2012).
 (3)
(3) as well.
 (4)
(4) is any point inside the source volume V, r′ refers to any observation point outside V, and d(r′) indicates the observed data at the point r′. H is the Green's function for the gravity field (or that for the magnetic field). To solve the potential field problem with real data, we must discretize the continuous problem. This introduces some a priori information by the definition of the source volume V and its discretization in a 3D grid of rectangular blocks (infinitely long prisms in 2D case) of known size, in which the unknown source magnetization or density is piecewise constant. This leads to the discrete forward problem, which consists of a system of linear equations:
 (5)
(5) (6)
(6) is the position vector of the ith data point (i=1, …, M). The matrix A has dimensions M × P.
 (7)
(7) .
. , as shown in Fig. 1(c) (equation 3). We also show the density model produced as the weighted minimum length solution (Menke 1984, pp. 54; Ialongo, Fedi, and Florio 2014) of the inverse problem (Fig. 1d). Weighting is provided by the conventional depth-weighting function:
 (8)
(8)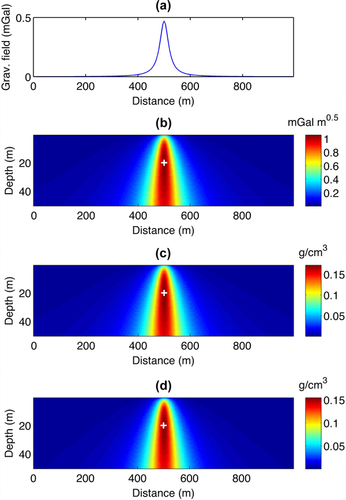
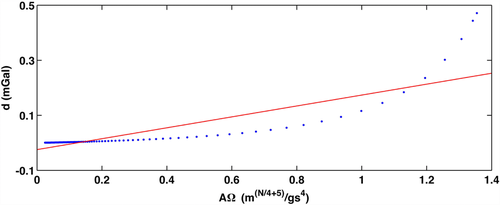
However, it is evident that either the depth-weighted solutions of the inverse problem or the DEXP model solutions are too smooth and characterized by low-density values, which are not well representative of the sought density distribution. Obviously, at this first step, the predicted data cannot reproduce adequately the true data, as the first iteration model is no longer adequate for well reproducing the measured data. This behaviour is common in inversion at the first step, and it is shown by the bad linear approximation in Fig. 2.
To overcome these unrequired features of the solution, many inverse algorithms have been proposed, allowing more compact or focused source distributions, with more realistic density values (Last and Kubik 1983; Barbosa and Silva 1994; Pilkington 1997; Portniaguine and Zhdanov 1999; 2002). In order to fulfill the same goal for imaging methods, we will define now a new algorithm based on the DEXP transformation, which iteratively produces different source distributions models, with an increasing degree of compactness and a consequent increase in the source-density values. We will call this new imaging method Compact DEXP (CDEXP). Other constraints such as positivity will be also introduced to improve the method.
 (9)
(9) is the model at the ith step. With regard to the form of such weighting function Wi, we found that a suitable compacting operator may be designed as follows:
 (10)
(10) is equal to the DEXP transformed field
  after conversion (equation 3) in the physical units of the source density, e.g., magnetization or density. At each subsequent step,
  is updated according to equation 9, and the data misfit is evaluated as follows:
 (11)
(11) 2 denotes the L2 norm, and
 (12)
(12)The iteration cycle proceeds until a feasible model and a reasonable data-fitting are obtained. Equation 10 allows at each step a new and more compact source-density model. Compared with focusing (Portniaguine and Zhdanov 1999, 2002) and data-space inversion (Pilkington, 2009) algorithms, our approach has the advantage of being obtained through a very fast process, which does not imply any matrix inversion. As such, it can be performed on a huge number of data at low computational cost. At each iteration, a more compact source distribution is estimated, and the process may be stopped as the density distribution ranges in a geologically feasible interval. Note however that we may impose also density constraints to improve the results. This will be shown in the following.
APPLYING BOUNDARY VALUE CONSTRAINTS
As said before, the compacting function increases the density of some blocks and decreases the total area (2D case) or the total volume (3D case) of the source distribution. Therefore, after several iterations, most of the blocks will have a near-to-zero density. However, if the process is not controlled, few blocks could have so large values of density, to be unfeasible, from both the physical and geological point of views. Introducing boundary-value constraints on the source distribution can prevent this overestimation and improve the significance of the results. To do this, we will use a penalization similar to that used in the Last and Kubik algorithm (1983): When the density value of a block exceeds the boundary constraint, it is brought back to the maximum allowed value. The effect of removing the exceeding-density block corresponds to give a very small weight to that block, in order to freeze it during the subsequent iterations.
SYNTHETIC EXAMPLES
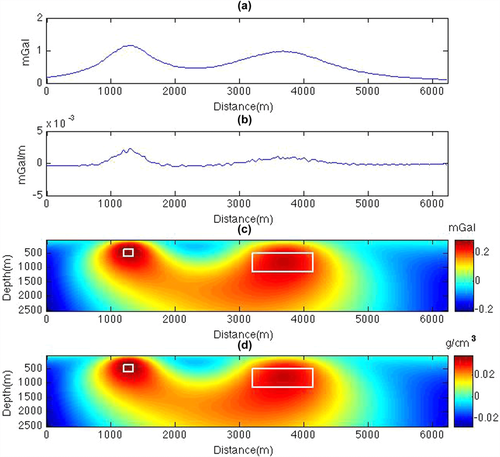
In the following, the compact depth from extreme points (CDEXP) method is tested by synthetic models. As mentioned earlier, in 2D cases, the subsurface is divided into rectangular cells whose dimension in the x-direction is equal to the data step and that in the z-direction is equal to the step of upward continuation of the field. Each block is infinitely extended in the y-direction. Figure 3 shows the gravity field of two 2D prisms, its first-order vertical derivative field, the DEXP transformed field of the latter, and the DEXP transformed field converted into the density distribution. The shallowest prism is small (size of 150 m and thickness of 250 m) and has a depth to top of 350 m and 1 g/cm3 density contrast. The second is deeper (500 m depth to top), and it is much larger and thicker (950 m × 650 m). It also has a sensibly lower density contrast (0.1 g/cm3). The gravity field is contaminated by Gaussian noise with zero mean and standard deviation of 2% of the field amplitude, so that its first-order derivative has an even worse signal-to-noise ratio. White boxes indicate the source position. The measurement level is 10 m above the ground, and there are 250 data points along the profile. To create the DEXP transformed field, the first-order vertical derivative of the field is upward continued with a 5-m step up to the 2,500-m height. The consequent discretization of the model space in rectangular blocks involves 124,000 cells. We performed the DEXP transformation using again N = 1.
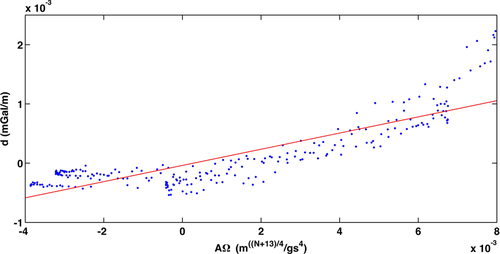
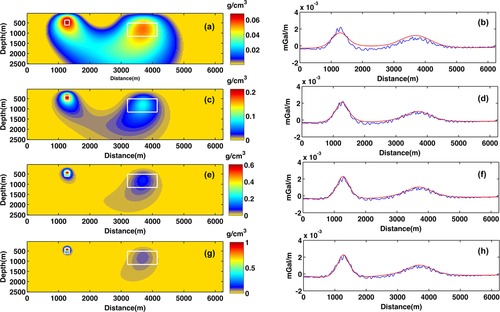
First of all, we assumed the DEXP-transformed field as the first approximation of the source model, according to equation 7. Figure 4 displays the linear regression of observed versus predicted data, yielding 0.135 for the coefficient k. In the subsequent steps, we used the compacting function (equation 9) with a compacting factor  g/cm3and applied also lower and upper bounds for the density constraints, which are set to [0, 1] g/cm3, respectively. Figure 5 illustrates the imaged distribution and the data-fit up at the second, sixth, eighth, and ninth iterations. The left column shows the reconstructed density models: The right one shows the observed field d (blue line) and the field
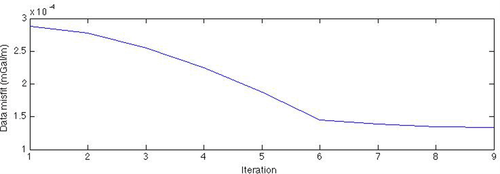
  (red line), as computed from the imaged model according to equation 12. We can see that the sources are pretty well reconstructed and that the related anomalies fit well the true data. Obviously, using different bounds, such as for instance [0, 1.5], we would obtain at some step a different ad even more compact solution, with a higher density contrast; our result is so evidently tight to the good quality of our a priori information. In spite of the huge number of model parameters, performing nine iterations takes only 20 s on a PC with a 2.2-GHz CPU. Figure 6 displays the data misfit as a function of iterations. At the ninth iteration, the misfit has the lowest RMS value. Note that this result was obtained with noisy anomalies and without any regularization, as instead needed in inversion. This is due to the stability of the DEXP transformation. However, even source models computed at previous steps, e.g., 6 or 8, have, in principle, a reasonably good data fitting. This behaviour is similar to focusing or data-space inversion. A priori information is therefore needed to select the best result; in particular, the choice of the bounds may be critical in order to have a solution consistent with real-world geology.
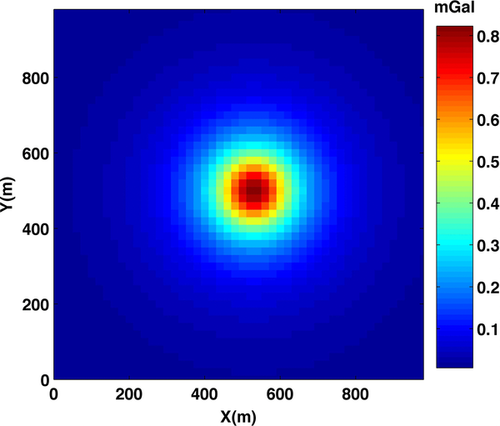
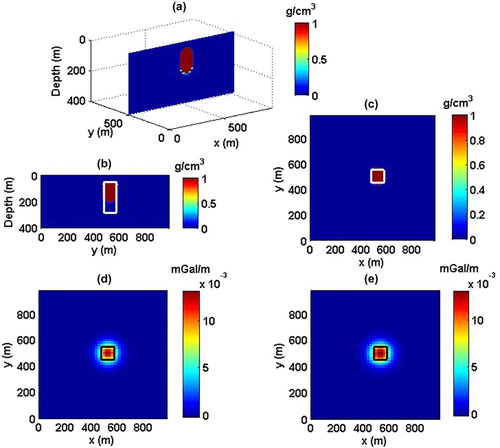
We demonstrate now the performance of the method in imaging 3D sources. This model is made of six blocks sized 100 m ×100 m × 40 m. Depth to the top is 50 m, and the 2,500 observations have a 20-m data step. Density contrast is 1 g/cm3. Figure 7 shows the gravity anomaly due to this 3D source. The multi-scale field and subsequently the DEXP transformed field are produced by upward continuation of the first-order vertical derivative of gravity field up to a 400 m height with a 10-m step and N = 1.5. To perform CDEXP modeling, the model space is discretized into cubic cells, each sized 20 m × 20 m × 10 m. Applying the constrained iterative approach to the first-order field derivative with a compacting factor  g/cm3, a fairly good image of model is reconstructed at the ninth iteration. In spite of the large number of unknowns (P = 105), the iterations are done just in 10.2 s on a PC with a 2.2-GHz CPU. Figure 8(a) shows a slice of the imaged model, and Fig. 8(b, c) displays plane sections at x = 500 m and at the 120 m depth, respectively. White solid lines outline the true source. The result confirms the ability of our method in performing a fast imaging of 3D potential field sources. Figure 8(d, e) shows how the anomaly produced by the imaged source distribution is close to the true anomaly.
APPLICATION TO A REAL CASE: FINDING THE CRYPTS OF ST. VENCESLAS CHURCH, IN TOVACOV, CZECH REPUBLIC, FROM MICROGRAVITY DATA
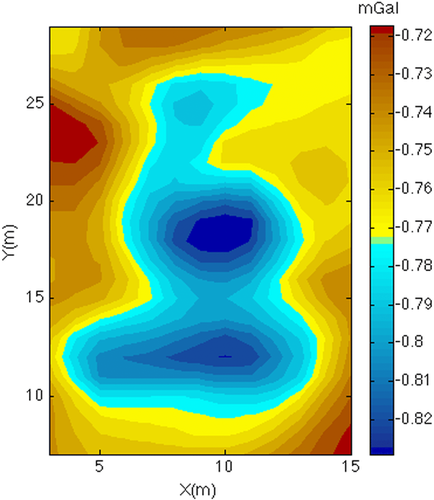
As a real case example, we use the microgravity data (Blizkovsky 1979) due to crypts under the floor of St. Venceslas church in Tovacov (Czech Republic). The mean error of measurements was 0.011 mGal, and the published data were corrected for the gravity effect of the walls. Figure 9 displays the gravity anomaly over the crypts. As referred by the authors of the survey, two significant gravity lows, with respective −0.06 mGal amplitudes, may be noted, clearly indicating areas of mass deficit. The first elongated low corresponds to a crypt connected by corridor and staircase with the entrance on the external wall of the church, and the second low corresponds to another unknown crypt, as proved by subsequent excavation work. One more crypt could be connected to the uppermost weaker gravity low, corresponding to the altar.
We first applied our compact depth from extreme point (CDEXP) algorithm to the second-order vertical derivative of the field, with a 1-m step, which was upward continued from a height of 1 m–8 m, with a 0.25-m vertical step (Figs. 10 and 11). We used a −2 g/cm3 density boundary constraint,
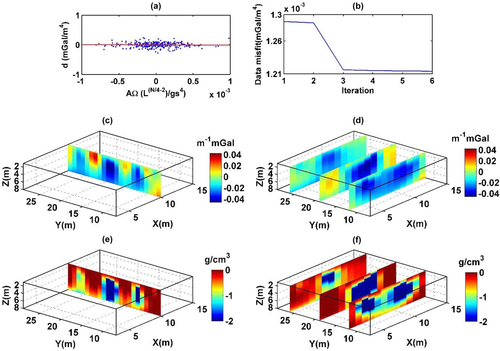
as representative of the maximum density contrast expected for the crypts, and N = 2 due to the approximately circular symmetry of the anomalies, particularly the uppermost ones. As said previously, the compacting factor (  g/cm3) was determined after some trials, in order to let a good analysis of the compact models generated at the various iteration steps and produce reasonable source models. We see from either the DEXP or the CDEXP results (Figs. 10c–f) that the underground structures allow a first identification of the crypts. However, Fig. 11 indicates that the CDEXP model is not able to reproduce the anomaly field with enough detail. Therefore, to get higher resolution imaging, we then performed the constrained CDEXP algorithm with the third-order field derivative. Obviously, the high stability of the DEXP transformation (Fedi 2007) allows using very safely higher order derivatives of the field. We used a compacting factor
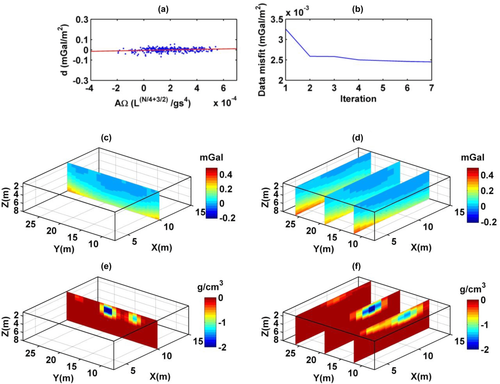
  g/cm3, N = 2, and −2 g/cm3 as lower boundary constraint for density. Figure 12(a) shows the linear regression of the calculated field third vertical derivative versus the predicted one, to estimate the coefficient k (equation 7) for converting the DEXP transformed field into density values, and Fig. 12(b) displays the data misfit error versus the number of iterations. Figure 12(c, d) shows the DEXP transformation of the third-order vertical derivative of the field. Finally, Fig. 12(e, f) displays the imaged sources by using our CDEXP algorithm.
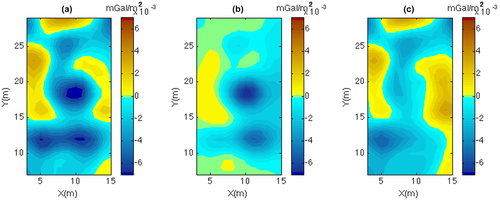
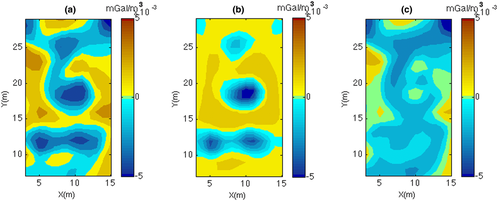
Note that, this time, the above-described crypts are well evidenced in the investigated 3D volume. This results also after comparing the third-order vertical derivative of the measured field (Fig. 13a) and the predicted third-order vertical derivative field (Fig. 13b). A fairly good agreement is observed, confirming the efficiency of our imaging approach. The rms error is 0.00144 mGal/m3 at the seventh iteration, and the whole process was performed in 0.16 s. Looking at the difference of the given data (Fig. 13c), we find however that the misfit is not only worse at the borders but also in correspondence of the hypothesized crypt under the altar.
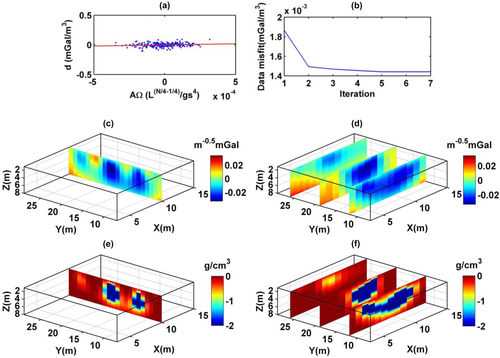
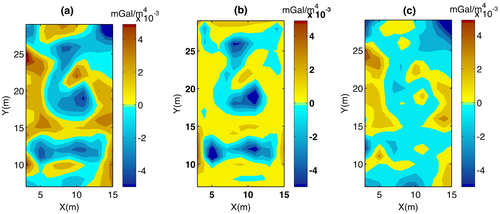
We could so try to improve further our results, by applying the CDEXP algorithm to the field fourth-order derivative. Figure 14 presents the linear regression used for estimating k (a), the data misfit against the number of iterations (b), the DEXP transformation of the fourth-order vertical derivative of the field (c, d), and the source model recovered by CDEXP (e, f). We used a compacting factor  g/cm3 Some features are now more clearly detected in the source model, especially that related to the northern gravity low: Therefore, we may conclude that the source model has now the necessary resolution to well describe the underground crypts. This is confirmed also in Fig. 15, showing that the true and predicted field fourth-order vertical derivatives have a better agreement (Fig. 15a, b) and the misfit is slightly higher than 10% of the total amplitude, which is enough for a fast imaging algorithm. Furthermore, the analysis of the difference between these two fields (Fig. 15c) indicates that only limited areas have poor fitting, mainly concentrated at the borders. However, this map may be further improved by standard inversion.
CONCLUSIONS
In this note, we propose a novel and fast method of imaging 2D and 3D sources. This method is mainly based on the depth from extreme point (DEXP) theory. Our main result is that a compacting function may be iteratively used to greatly improve the DEXP image, up to reach a geologically feasible and compact source model.
As no matrix inversion is done during the procedure, our method is simple to implement and is fast and stable. We also show that, similar to inversion algorithms, boundary constraints may be applied for the source density. The density values are so forced to be within a prefixed range of values. This leads to rather homogeneous density distributions, which are very close to the true ones, as the synthetic cases show. In addition to the speed of the process, we remark its stability, in turn based on the inherent stability versus noise of the DEXP transformation. This allows the method to be applied even to high-order field derivatives as well; this feature in turn warrants an elevated resolution, as shown for the real case of the crypts of the church of St. Vencenslav. This stability/high-resolution issue makes very attractive the CDEXP method versus inversion methods because it is well known that this last needs regularization, in order to allow a stable solution.
In conclusion, CDEXP imaging may be a practical first alternative to inversion for large-scale problems, providing a fast imaging of the source distribution. In cases where a more detailed and heavily constrained solution is needed, the role of CDEXP is nevertheless useful: It may provide an initial source model to be improved subsequently by more refined inversion algorithms.
ACKNOWLEDGEMENTS
The authors would like to thank the Editor Tijmen Jan Moser, Prof. Gordon Cooper, and an anonymous reviewer for their useful suggestions, which helped us to improve the paper.


