Wavelet-based cepstrum decomposition of seismic data and its application in hydrocarbon detection
ABSTRACT
How to use cepstrum analysis for reservoir characterization and hydrocarbon detection is an initial question of great interest to exploration seismologists. In this paper, wavelet-based cepstrum decomposition is proposed as a valid technology for enhancing geophysical responses in specific frequency bands, in the same way as traditional spectrum decomposition methods do. The calculation of wavelet-based cepstrum decomposition, which decomposes the original seismic volume into a series of common quefrency volumes, employs a sliding window to move over each seismic trace sample by sample. The key factor in wavelet-based cepstrum decomposition is the selection of the sliding-window length as it limits the frequency ranges of the common quefrency section. Comparison of the wavelet-based cepstrum decomposition with traditional spectrum decomposition methods, such as short-time Fourier transform and wavelet transform, is conducted to demonstrate the effectiveness of the wavelet-based cepstrum decomposition and the relation between these two technologies. In hydrocarbon detection, seismic amplitude anomalies are detected using wavelet-based cepstrum decomposition by utilizing the first and second common quefrency sections. This reduces the burden of needing dozens of seismic volumes to represent the response to different mono-frequency sections in the interpretation of spectrum decomposition in conventional spectrum decomposition methods. The model test and the application of real data acquired from the Sulige gas field in the Ordos Basin, China, confirm the effectiveness of the seismic amplitude anomaly section using wavelet-based cepstrum decomposition for discerning the strong amplitude anomalies at a particular quefrency buried in the broadband seismic response. Wavelet-based cepstrum decomposition provides a new method for measuring the instantaneous cepstrum properties of a reservoir and offers a new field of processing and interpretation of seismic reflection data.
INTRODUCTION
Seismic data are nonlinear and non-stationary in nature and have multi-component signals, containing varying frequencies in time. Spectral decomposition of seismic data, which can decompose individual seismic volumes into multiple frequency volumes for maximizing and enhancing geophysical responses in specific frequency bands, particularly for identifying strong amplitude anomalies at a particular frequency buried in the broadband seismic response, has been widely used for identifying temporal bed thickness and geologic discontinuities, reservoir characterization, detecting hydrocarbon, and other tasks (Chakraborty and Okaya 1995; Peyton, Bottjer, and Partyka 1998; Partyka, Gridley, and Lopez 1999; Castagna, Sun, and Siegfried 2003; Sinha et al. 2005; de Matos and Johann 2007; de Matos et al. 2009; Wu and Liu 2009; Ehrhardt, Villinger, and Schiffler 2012). Various time–frequency analysis methods, such as short-time Fourier transform (STFT), wavelet transform, S transform, the Wigner–Ville distribution, and empirical mode decomposition (EMD)-based time–frequency methods can be utilized in spectrum decomposition (Partyka et al. 1999; Castagna et al. 2003; Sinha et al. 2005; Matoes et al. 2005; Odebeatu et al. 2006; Wu and Liu 2009; Xue, Cao, and Tian 2013; Xue et al. 2014a,b). The aim of spectral decomposition technology development is to seek methods that have higher time and frequency resolution and that can improve the characterization of the time-dependent frequency response of subsurface rocks and reservoirs. For example, Sinha et al. (2005) proposed a TFCWT algorithm that can map a scalogram produced by a continuous wavelet transform to a time–frequency spectrum for the interpretation of the seismic data. Pinnegar and Manisnha (2003) produced a generalized S transform, and Xue et al. (2014a,b) developed the EMD/TK and EMDWave methods to avoid the limitation of the Bedrosian theorem (Bedrosian 1963) and Nuttall theorem (Nuttall 1966), and to improve the physical meaning of the instantaneous attributes calculated by the Hilbert transform, thereby providing a better interpretation result of hydrocarbon detection.
Cepstrum analysis was first defined and used for the recognition of nuclear explosion and seismic signals by Bogert et al. (1963). Later development included the power cepstrum (Bogert et al. 1963; Oppenheim and Schaffer 1989), complex cepstrum (Oppenheim 1965) and real cepstrum. In general, no matter which cepstrum is used, its core operation is Fourier transform. The cepstrum analysis have been mainly applied to geophysical problems such as the recovery of seismic wavelets, deconvolving seismic traces, microearthquakes, and teleseismic event analysis (Ulrych 1971; Ulrych et al. 1972; Tuetuencueoglu and Sate 1974; Stoffa, Buhl and Bryan 1974; Scheuer and Wagner 1985; Miah et al. 2011). Cepstrum analysis has also been used for reservoir prediction but rarely for hydrocarbon detection. Hall (2006) predicted bed thickness with a cepstrum and found that cepstrum analysis has the potential to significantly improve the accuracy of bed thickness estimation from seismic data. However, their methods only work for synthetic data, and it is difficult to apply the method to real seismic data.
Recently, Sanchez et al. (2009) presented a wavelet-based cepstrum for pitch extraction in the automatic speech and speaker recognition systems, whose core operation uses wavelet packet transform (WPT) instead of Fourier transform and found that the wavelet-based cepstrum has better effectiveness and accuracy than the traditional cepstrum based on Fourier transform. In this paper, we modify the wavelet-based cepstrum for more suitably assessing seismic data, and a novel approach for spectral decomposition with a wavelet-based cepstrum is introduced. A method for using wavelet-based cepstrum decomposition to analyse seismic data is provided for reservoir characterization and hydrocarbon detection. Finally, a model test and real seismic data are used to validate the effectiveness of this new method, and a comparison with traditional spectral decomposition is given.
PRINCIPLES AND METHODS
Wavelet-based cepstrum
 can be obtained with the following equation:
 (1)
(1) represents a Fourier transform, and q is the quefrency. The cepstrum requires an inverse Fourier transform of the logarithmic spectrum. It converts the input signal from the time domain to the frequency domain, scales the input signal using the logarithmic function, and then returns the scaled signal to the time domain. Quefrency ‘q’ in the cepstrum, i.e.,
  , is a time sample number, but it is different from the time variable ‘t’ in the original signal, i.e.,
  .
. (2)
(2) represents the discrete wavelet packet transform. The wavelet-based cepstrum filters the input signal, scales it using the logarithmic function, filters it again, and then calculates the energy of each sub-band. The parameter ‘q’ in the wavelet-based cepstrum is also a time variable, but it is different from the time variable ‘t’ in the original signal.
Symmlets or coiflets are found to be the best choice of wavelet function for the wavelet-based cepstrum (Sanchez et al. 2009). Note that the wavelet-based transform does not require an inverse DWPT, but it does require the length of the calculated signal to be a power of 2. For each decomposition, the input signal  is turned into its full mth-level DWPT, where
  , and L is the length of the input signal
  .
.
 be the order of the DWT in binary representation, and
  be the Gray code corresponding to k. Then, the NFO order can be obtained by alternating the order of the DWT in binary representation using the Gray code, as shown by the following equation (Jensen and la Cour-Harbo 2001; Ji 2005):

 (3)
(3)
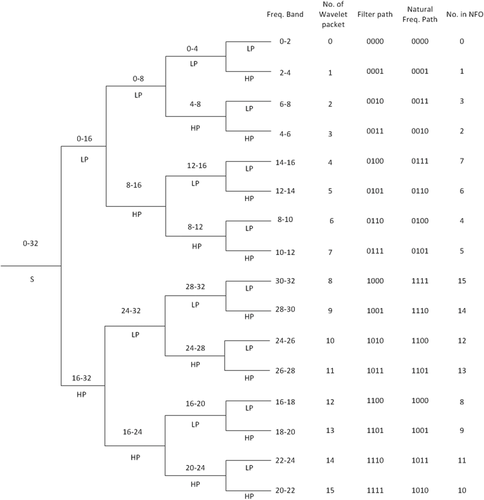
If we take a close look at the frequency of a wavelet packet analysis, e.g., those shown in Fig. 1, the frequency range of the signal is set from 0 to 32 Hz. The sampling frequency is 64 Hz. Figure 1 shows the 4-order wavelet packet decomposition tree of the signal and its corresponding frequency band according to the Mallat algorithm. LP and HP in Fig. 1 denote the low-pass and high-pass filters, respectively. If the signal through the low-pass filter is denoted ‘0’, and the signal through the high-pass filter is recorded as ‘1’; then, we can obtain a binary number corresponding to the filter path of each node, i.e., the number of the wavelet packet is indicated. As shown in Fig. 1, the frequency arrangement disorder of the wavelet packet occurs. In each node, if the high-frequency sub-band is further decomposed, the frequency band will produce a stagger, and the stagger in the lower layer will bring into the higher layer to create a further stagger. By applying the Gray code to encode the wavelet packet number, the relationship between the frequency band distribution and the filter paths can be obtained, and its value indicates the number of the frequency band in NFO. Therefore, the frequency band after the wavelet packet decomposition can be adjusted to correspond with the actual frequency band.
Wavelet-based cepstrum decomposition of seismic data
 , we first need to add
  points of zeros to the seismic trace; the resultant signal
  should have the following form:
 (4)
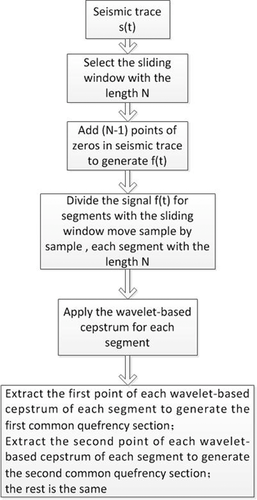
(4)This process does not change the result of the cepstrum, but can keep the resultant common quefrency section with the same time length of the seismic trace. The signal  is divided for the segments with the sliding window moving sample by sample. Then, the wavelet-based cepstrum is applied to each windowed segment of the seismic trace. Note that every segment is turned into its full mth-level DWPT, where
  . Due to the NFO adopted in each full DWPT, the leaves of the decomposition tree contain only one sample each, and the frequency ranges for each sample can be determined. Suppose the sampling frequency of the seismic data is
 ; then, after the mth-level full DWPT, the first point of the wavelet-based cepstrum will be in the frequency range of (0,
  ), the second point of the wavelet-based cepstrum will be in the frequency range of (
 ,
, ), and the k
 point of the wavelet based cepstrum will be in the frequency range of (
 ,
, ). The first point of each wavelet-based cepstrum of each segment is extracted to generate the first common quefrency section. The second point of each wavelet-based cepstrum of each segment is extracted to generate the second common quefrency section. The rest of the points follow this same method. This procedure is described in Fig. 2. Note that the length of the sliding window N should be a power of 2.
Seismic amplitude anomaly section using wavelet-based cepstrum decomposition for hydrocarbon detection
The attenuation of high-frequency energy in the reservoir is often observed in seismic data analysis, and it removes high frequencies and lowers the dominant frequency for all subsequent reflections. Therefore, anomalous low-frequency energy concentrated at or beneath the reservoir level, known as low frequency shadows, can usually be found. Note that there are other causes of low frequency shadows, in addition to gas or other hydrocarbons. Ebrom (2004) outlined at least ten mechanisms for low-frequency shadows. Only after ruling out the effects of formation, lithology, and other factors, the attenuation of high-frequency energy and the enhancement of low-frequency energy can be considered corresponding to the gas-bearing layers (Xue et al. 2014b). Amplitude anomalies, with characteristics of higher frequencies attenuating more rapidly than the lower frequencies in gas-prone attenuating media, can be used as hydrocarbon indicators.
 (n is the sampling point) (Deng and O'Shaughnessy, 2003). The energy of the cepstrum mainly focuses on the lower quefrency part of the signal. Generally, the first common quefrency section
  and the second common quefrency section
  are enough for us to conduct reservoir characterization and hydrocarbon detection (Cao et al. 2011a,b). Let us define a seismic amplitude anomaly section
  to estimate the amplitude anomaly detected by the wavelet-based cepstrum. The seismic amplitude anomaly section is obtained by the following:
 (5)
(5) denotes the normalized results of the amount of amplitude exceeding the average cepstrum amplitude in the first common quefrency section, and
  denotes the normalized results of the amount of amplitude exceeding the average cepstrum amplitude in the second common quefrency section, i.e.,
 (6)
(6) denotes the normalization of the results, and
  represents the average of the signal.
The seismic amplitude anomaly section  identifies the strong amplitude anomalies at a particular frequency band, which are deeply buried in the broadband seismic response.
  can reflect many geologic features of the layer of interest, such as gas-charged reservoirs or channels, which may cause amplitude anomalies in the seismic reflection data.
Thus, few data in the seismic amplitude anomaly section indicate no anomalous amplitude, and substantial data indicate anomalous amplitude.
The logarithm operation employed in the proposed method enhances the weak pore fluid response and suppresses the skeleton information. It is a weak signal detection method but can be beneficial for hydrocarbon detection.
 (7)
(7) ,
,  is the sampling frequency of the seismic data, and fdominant is the dominant frequency of the seismic data. Thus, the frequency of the first common quefrency section
  ranges from 0 to
  , and the frequency of the first common quefrency section
  ranges from
  to
to  .
.MATERIALS
Model test
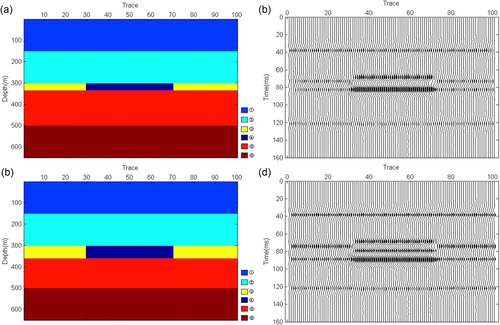
To illustrate the process and effectiveness of the seismic amplitude anomaly section extracted by the wavelet-based cepstrum for hydrocarbon detection, two models are designed with different thicknesses of the gas-bearing layer to simulate the seismic responses. The geological models include six formations. The parameters of each layer of the models are shown in Table 1. The gas-bearing layer is layer ④, and layer ③ is the dry layer (excluding gas). The frequency of the wavelet is 45 Hz. Seismic signals are sampled at 2 ms.
| Layer number |  |
 |
Q |
|---|---|---|---|
| ① | 4120 | 2.368 | 200 |
| ② | 4174 | 2.376 | 200 |
| ③ | 4228 | 2.384 | 200 |
| ④ | 4081 | 2.362 | 30 |
| ⑤ | 4281 | 2.392 | 200 |
| ⑥ | 4326 | 2.399 | 200 |
Model 1 is designed with a thickness of gas-bearing layer ④ of 35 m. The thickness of gas-bearing layer ④ in model 2 is 60 m. The geological models and their corresponding seismic responses are shown in Fig. 3(a–d). In gas-bearing models 1 and 2, due to the presence of the velocity mutation in the gas-bearing layer, waveform interference and phase polarity reversal occur at the edge of the gas-bearing layer. At the bottom interface of the gas-bearing layer, the amplitude is enhanced and exhibits a “bright spot” phenomenon. The amplitudes in the entire gas-bearing layer are significantly increased compared with the other layers. In Fig. 3(b), because the thickness of gas-bearing layer ④ in model 1 is only 35 m, the Ricker wavelet sidelobe is hidden in the next layer reflection. Therefore, only four events are found in the middle part of the seismic section in model 1. Because the thickness of gas-bearing layer ④ in model 2 increases to 60 m, the sidelobe from the upper layer is revealed. Thus, we find that there are five events in the middle part of the seismic section in model 2 (Fig. 3d).
Seismic data
To further illustrate the effectiveness of the seismic amplitude anomaly section extracted by the wavelet-based cepstrum for hydrocarbon detection, two broad-band migrated stacked 2D seismic sections intersecting different wells, in which the effective gas-bearing reservoirs are mainly tight sandstone reservoirs from the Sulige gas field in the Ordos Basin, China, are used for analysis. The gas reservoirs in the two sections are typical lithologic trap gas reservoirs. Quartz sandstone, lithic quartz sandstone, and lithic sandstone are the main rock types in the reservoirs in the two seismic sections. The sandstone reservoir shows strong heterogeneity. The thickness of the reservoir is thin.
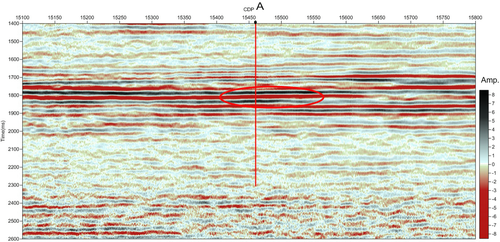
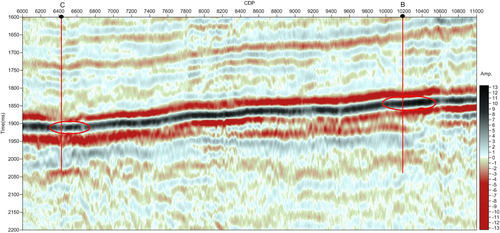
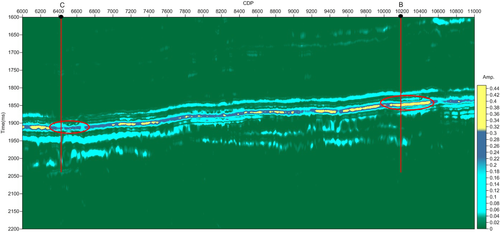
Figure 4 shows the seismic section intersecting a known prolific gas well A. The study area, where well A is located and good gas production is obtained, is indicated by a red ellipse. The seismic section intersecting well A is used to illustrate the analysis process of the seismic amplitude anomaly section using wavelet-based cepstrum decomposition, and a further comparison of the seismic amplitude anomaly section using wavelet-based cepstrum decomposition with the spectral decomposition results, calculated by short-time Fourier transform (STFT) and wavelet transform, respectively, is provided. The wavelet-based cepstrum decomposition is applied to the seismic section intersecting the two known wells: a less prolific gas well B and a water well C (Fig. 5). Two red ellipses show the locations of high gas production well B and water well C. The seismic signals are sampled at 2 ms.
RESULTS AND DISCUSSION
Model analysis
Figure 6 shows the seismic amplitude anomaly sections calculated by the wavelet-based cepstrum decomposition for models 1 and 2. The choice of the sliding window is 8. In Fig. 6(a), we can observe that larger amplitudes occur in the gas-bearing reservoir. Because the amplitude of the lower reflection interface in the gas-bearing layer is larger than that in the upper reflection interface, the detected anomalous amplitudes around the lower reflection interface in the gas-bearing layer are much larger than that around the upper reflection interface. This result can be demonstrated more clearly when we extract two traces, respectively, from the dry and gas-bearing layers. We extract one trace from the dry layer, which is denoted 1, and one trace from the gas-bearing layer, which is denoted 2, as shown in Fig. 6(b). As Fig. 6(b) shows, the difference between the dry layer and the gas-bearing layer shown by a red rectangle box is not distinct. Figure 6(c) shows the results of applying the wavelet-based cepstrum decomposition to model 1. We can clearly observe that larger amplitudes are found in the gas reservoir (denoted 2), whereas no obvious amplitude anomaly is found in the dry layer (denoted 1). Figure 6(d) shows the seismic amplitude anomaly section of model 2. When the thickness of the gas-bearing layer is increased to 60 m, the obvious amplitude anomaly can still be found in the gas-bearing layer, and the detected anomalous amplitudes around the lower reflection interface in the gas-bearing layer are much larger than that around the upper reflection interface. One trace is extracted from dry layer 1 and the gas-bearing layer 2, respectively (Fig. 6e). After using wavelet-based cepstrum decomposition, we found that the amplitude anomaly in the gas-bearing layer is much larger than that in the dry layer, as shown by the red rectangle box in Fig. 6(f).
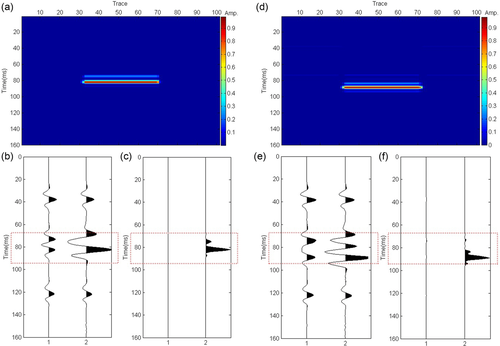
From the model analysis, we can find that the amplitude anomaly only exists in the gas-bearing layer in the seismic amplitude anomaly sections calculated by the wavelet-based cepstrum decomposition. The seismic amplitude anomaly section calculated by the wavelet-based cepstrum decomposition can thus detect the gas-bearing reservoir well.
A comparison of the wavelet-based cepstrum decomposition with the common spectrum decomposition methods based on STFT and wavelet transform
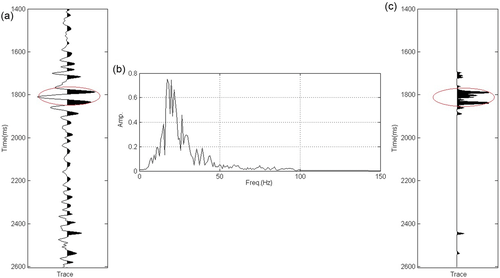
How does the wavelet-based cepstrum decomposition relate to traditional spectrum decomposition methods, such as short-term Fourier transform (STFT) or wavelet transform? Using the seismic section intersecting well A as an example, we extract the seismic trace intersecting the most prolific gas well A for analysis. Figure 7(a) shows this seismic trace. The study area in which good gas production is obtained is also marked by a red ellipse. In the spectrum of the seismic trace intersecting well A (Fig. 7b), we find that the dominant frequency of the seismic data is approximately 15 Hz. Then, wavelet-based cepstrum decomposition is applied to the seismic trace intersecting well A. Because the sampling frequency is 500 Hz, according to equation 7, the length of the sliding window should be near  and should also be a power of 2. Thus, we select the length of the sliding window to be 16 in order to satisfy these two conditions. For the whole seismic section intersecting well A, we also select the length of the sliding window to be 16 for the wavelet-based cepstrum decomposition.
The first common quefrency section  extracted by the wavelet-based cepstrum decomposition is shown in Fig. 8(a). With a sliding-window length of 16, the first common quefrency section
  is in the frequency range of (0,
  ) Hz. For a comparative analysis, we extract the common frequency section at 8 Hz by using STFT and wavelet transform. Note that we calculate the common frequency section at 8 Hz by using the average of the frequency ranges (0,16). For STFT, we use a Hamming window with a length of 41 to extract the common frequency section at 8 Hz. The common frequency section at 8 Hz extracted by STFT is shown in Fig. 8(b). Figure 8(c) shows the common frequency section at 8 Hz using the wavelet transform. Here, a Morlet wavelet is used. We normalized the results from the three methods for comparison. Comparing Fig. 8(a) with Fig. 8(b) and (c), we find that the main energy distribution of the first common quefrency section
  is similar with those of the common frequency sections at 8 Hz extracted by STFT in Fig. 8(b) and wavelet transform in Fig. 8(c). This fact illustrates the effectiveness of the wavelet-based cepstrum decomposition and its relation with traditional spectrum decomposition. We also find that the time resolution in the first common quefrency section
  is higher than those in the common frequency at 8 Hz extracted by STFT (Fig. 8b) and wavelet transform (Fig. 8c).
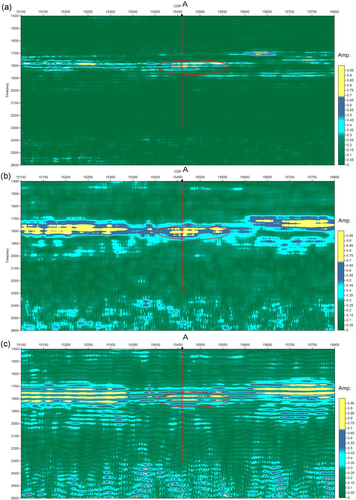
 extracted by wavelet-based cepstrum decomposition of the seismic section intersecting well A. The sliding-window length is 16. (b) The common frequency section at 8 Hz extracted by STFT of the seismic section intersecting well A. A hamming window with a length of 41 is used. (c) The common frequency section at 8 Hz extracted by wavelet transform of the seismic section intersecting well A. A Morlet wavelet is used. Note that the results from the three methods are normalized for comparison.
Analysis of the seismic section intersecting gas well A
For the seismic trace intersecting well A in Fig. 7a, the seismic amplitude anomalies trace, which was obtained by applying equation 5 to one trace, is shown in Fig. 7(c). A considerable amount of data is distributed in the area marked by the red ellipse, which suggests a strong amplitude anomaly. Combined with the gas testing results, we know that, in the area marked by the red ellipse, this strong amplitude anomaly is related to high gas production.
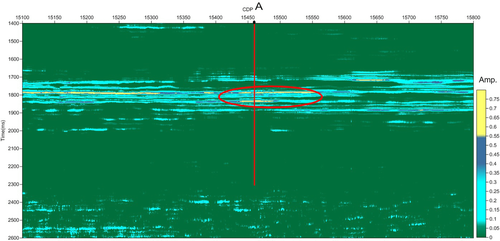
Figure 9 shows the seismic amplitude anomaly section intersecting well A using wavelet-based cepstrum decomposition. As Fig. 9 shows, the largest cepstrum amplitude distribution occurs within the detection area shown by the red ellipse, which suggests strong cepstrum amplitude anomalies. Excluding the effects of formation, lithology, and other factors, we hypothesize that the strong cepstrum amplitude anomaly corresponds to the presence of hydrocarbon. The strong amplitude anomalies in the area set by the red ellipse indicates a hydrocarbon-prone interpretation, which is consistent with the high gas production in the well testing data and further illustrates that the seismic amplitude anomaly section using wavelet-based cepstrum decomposition in the area can be used for hydrocarbon detection.
Analysis of the seismic section intersecting gas well B and water well C
The seismic amplitude anomaly sections intersecting wells B and C using wavelet-based cepstrum decomposition are shown in Fig. 10. The fact that the largest cepstrum amplitude (yellow colour in Fig. 10) is distributed in the area where gas well B is located illustrates that a strong cepstrum amplitude anomaly exists. Excluding the effects of lithology and other factors, we hypothesize that this strong amplitude anomaly is related to hydrocarbons and is consistent with the high gas production in the well testing data. A larger cepstrum amplitude (blue colour in Fig. 10) is distributed in the area where water well C located. The cepstrum amplitude anomaly in the area where water well C located is not as obvious as that in the area where gas well B is located. The difference of the characteristics of the gas- and water-bearing wells is clearly reflected in the seismic amplitude anomaly section extracted by the wavelet-based cepstrum decomposition.
CONCLUSIONS
In terms of how to use cepstrum analysis for exploration seismology, the wavelet-based cepstrum decomposition is proposed and discussed in this paper. The key factor in wavelet-based cepstrum decomposition is the choice of the sliding-window length, which also determines the frequency ranges used in the cepstrum decomposition. The other factor that limits the ability of the wavelet-based cepstrum decomposition method to employ more variable frequency ranges is that the sliding-window length must be a power of 2. Note that the common quefrency section is generated by a frequency band instead of a frequency. By comparison of the common quefrency section extracted by wavelet-based cepstrum decomposition with the common frequency section extracted by traditional spectrum decomposition methods, we demonstrate the effectiveness of wavelet-based cepstrum decomposition. By the definition of seismic amplitude anomaly section extracted by the wavelet-based cepstrum decomposition, the usage of the first and second common quefrency sections ( and
and  , respectively) for reservoir characterization and hydrocarbon detection is proposed, and its effectiveness is confirmed by the model test and the seismic data acquired from the Sulige gas field. Wavelet-based cepstrum decomposition offers an easier way for using the cepstrum amplitude anomaly related to the quefrency information for reservoir characterization and hydrocarbon detection compared with conventional spectral decomposition methods, and it provides a new field of processing and interpreting seismic reflection data. Further research, particularly if applied to other datasets, will contribute to a better understanding of the advantages and the practical restrictions of this method.
ACKNOWLEDGEMENTS
This study was supported by the National Natural Science Foundation of China under Grants 41430323, 41404102, 41274128, 41304080, and 61401047; by the Project of the Scientific Research Foundation of CUIT under Grant KYTZ201503; and by the 2015 Annual Young Academic Leaders Scientific Research Foundation of CUIT under Grant J201507. The authors would like to thank the anonymous reviewers for their constructive comments, and the Editor-in-Chief for his interest in this work and comments.


