Using slowness and azimuth fluctuations as new observables for four-dimensional reservoir seismic monitoring
ABSTRACT
Four-dimensional imaging using geophysical data is of increasing interest in the oil and gas industries. While travel-time and amplitude variations are commonly used to monitor reservoir properties at depth, their interpretation can suffer from a lack of information to decipher the parts played by different parameters. In this context, this study focuses on the slowness and azimuth angle measured at the surface using source and receiver arrays as complementary observables. In the first step, array processing techniques are used to extract both azimuth and incidence angles at the source side (departure angles) and at the receiver side (arrival angles). In the second step, the slowness and angle variations are monitored in a laboratory environment. These new observables are compared with traditional arrival-time variations when the propagation medium is subject to temperature fluctuations. Finally, field data from a heavy-oil permanent reservoir monitoring system installed onshore and facing steam injection and temperature variations are investigated. The slowness variations are computed over a period of 152 days. In agreement with Fermat's principle, strong correlations between the slowness and arrival-time variations are highlighted, as well as good consistency with other techniques and field pressure measurements. Although the temporal variations of slowness and arrival time show the same features, there are still differences that can be considered for further characterization of the physical changes at depth.
INTRODUCTION
In seismology and geophysics, much effort has been devoted over the last 20 years to the tracking and monitoring of temporal variations of subsurface properties, such as velocity, fluid pressure, and saturation. Four-dimensional (4D) monitoring requires repetitive or, preferably, continuous acquisitions that can provide travel-time and/or amplitude variation measurements. To ensure high 4D signal quality, the main concerns have been with repeatability from one survey to another and 4D noise removal. In seismology, velocity variations are classically monitored using travel-time variations of scattered waves (Poupinet, Ellsworth, and Fréchet 1984). With the recent focus on virtual records built from ambient-noise correlations (Campillo and Paul 2003; Shapiro and Campillo 2004), continuous monitoring becomes possible using travel-time variations in the coda (Sens-Schönfelder and Wegler 2006; Brenguier et al. 2008; Hadziioannou et al. 2011). However, this can provide only global variations, and it is not suited for reservoir monitoring. For this reason, reservoir monitoring is performed using active sources and acoustic waves, to specifically probe the zone of interest. This monitoring generally uses repetitive surveys (Eiken et al. 1999; Johnston et al. 2000), although recent offshore (Barkved et al. 2005; Hermansen 2008; Folstad et al. 2013) and onshore (Cotton, Forgues, and Hornman 2012) permanent systems have been installed for more frequent acquisitions and better repeatability. While seismology focuses on velocity field variations to evaluate the Earth regional behavior, geophysical surveys are designed to better understand local reservoir evolution, in order to improve reserve estimation and production costs. The margin can be significant as, in general, more than 60% of the oil in a reservoir is not recovered. In this context, repetitive surveys provide information from the data that might be useful for increased oil recovery.
Repeatability is mainly quantified using normalized root mean square (NRMS) differences of two repeated signals from two different surveys (Kragh and Christie 2002). In marine surveys, repeatability is significantly increased by using permanent sensors at the seabed, where the NRMS decreases from about 20% or more to 5% (Eriksrud 2014). Continuous seismic monitoring onshore using acoustic waves between buried active sources and buried receivers was introduced by Meunier and Huguet (1998). Under these conditions, quantitative studies on repeatability show amplitude variation measurements of 0.5%, with travel-time variations of 6 μs (Schisselé et al. 2009). In addition, Forgues and Schisselé (2010) presented signal-to-noise ratio improvements of 20 dB when using buried hydrophones and NRMS values between 0% and 15% for a survey over 84 days. More recently, continuous monitoring studies have shown that both travel-time and amplitude variations linked with steam injection within heavy-oil reservoirs can be tracked daily over several months or years (Forgues, Schisselé-Rebel, and Cotton 2011; Cotton et al. 2012).
Another potential difficulty encountered in onshore 4D monitoring to ensure repeatability is compensation for near-surface variations. This can be addressed by cross-equalization techniques for surface acquisition (Ross, Cunningham, and Weber 1996; Rickett and Lumley 1998), time-lapse wave separation with buried systems in the field (Cotton, Michou, and Forgues 2013), or array-processing techniques on physical models (de Cacqueray et al. 2013).
However, subsurface evolution is still difficult to interpret as it suffers from the mixing of numerous physical parameters, such as temperature, velocity profile, porosity, and liquid saturation. Quantitative measurement for 4D monitoring using surface seismic devices has been performed with various methods allowing good repeatability to be achieved. A first level of information is given by the NRMS analysis between two surveys. Attenuation can also be used (Shabelansky, Malcolm, and Fehler 2012), as well as arrival-time and amplitude variations. For example, Blondin and Mari (1986) characterized gas bubble extension for the Gournay-sur-Aronde field from April 1981 to January 1982 using both time-shift and amplitude variations.
When focusing on pore pressure and saturation variations, stacking near and far offsets separately (i.e., angle-versus-offset (AVO) stacking) appears to be an efficient way to carry more information. Using AVO response changes in the intercept and slope for the top-reservoir reflection, Landrø (2001) highlighted that far offsets are dominated by saturation while near offset are affected by both saturation and pore pressure changes. This is a crucial point as, in many cases, pore pressure and saturation have comparable contributions to seismic amplitude variations but with opposite signs. Finally, Landrø (2001) showed that AVO can be used efficiently to discriminate pore pressure changes from saturation changes.
This approach has led to rich applications and developments: it becomes possible to derive explicit expressions of seismic amplitude variations in terms of pore pressure and saturation variations (Meadows 2001; Angelov, Spetzler, and Wapenaar 2004). The AVO impact was also investigated for North Sea field data (Floricich et al. 2006; Alvarez and MacBeth 2014). Using another modified form of Landrø’s results, Trani et al. (2011) provided time-shift variations as functions of pore pressure and saturation variations.
Finally, velocity field analysis enriches the 4D methods, from the first ultrasonic measurements at wells using RMS velocity (Nur, Tosaya, and Vo-Thanh 1984), to full waveform inversion applied on conventional 4D surveys (Asnaashari 2013; Asnaashari et al. 2014). Then, it becomes possible to perform 4D petrophysical seismic inversion and to retrieve the evolution of the reservoir properties (Michou et al. 2013; Roustiau et al. 2013).
In all of these studies, hypotheses were made to reduce parameter complexity. In many cases, several parameters are considered fixed to (i) better assess the evolution of a set of other selected parameters, and (ii) decrease the number of variables (Landrø 2001). In this context, the present study is motivated by the following question: Is it possible to derive new observables from the recorded data? This can be potentially handled using array-processing techniques, by the leveraging of two new observables: the slowness at the source and the receiver sides.
In the present study, we discuss 4D permanent monitoring based on reflected waves. An advanced array-processing method is presented to measure new observables that are linked with velocity variations, such as the slowness and the azimuth angle at both the source and receiver arrays. The measurements rely on the application of a double beamforming (DBF) technique, which is described in the next section. These new observables are measured and compared with the more traditional travel-time fluctuations in the context of (i) laboratory-scale experiments and (ii) a recent heavy-oil field test where steam injection was performed. Theoretical travel-time sensitivity kernels are introduced to compare DBF processing with the classical method using stacked common-depth-point collection. Finally, observation-well pressure measurements at depth and hypothesis validation allow the relevance of these data to be assessed. This is not completely a comparative analysis as the exact variations at depth remain unknown, but it shows that new observables are available. It offers supplementary—and hopefully complementary—views of the information available in the data.
THE DOUBLE-BEAMFORMING ALGORITHM
The double beamforming (DBF) technique consists of using arrays at both the source and the receiver sides and applying slant-stack processing. The usefulness of DBF to identify and isolate different wave arrivals has been successfully demonstrated in seismology (Weber et al. 1996; Krüger et al. 1996; Rost and Thomas 2002), underwater acoustics (Roux et al. 2008, 2013; Sukhovich, Roux, and Wathelet 2010), and geophysics (Zheng et al. 2011; Boué et al. 2013). In particular, DBF has been used in geophysical contexts, with 2D arrays to separate surface waves and body waves using numerical and real data (Boué et al. 2013), and through laboratory-scale experiments (de Cacqueray et al. 2011).
In the following sections, the term eigenpath refers to the direct raypath in the case of point-to-point propagation in the framework of the infinite frequency approximation. However, in the case of band-limited signals, the eigenpath should be replaced by the eigenbeam, which extends spatially over the size of the Fresnel zone along the raypath between the source and the receiver.
 (1)
(1)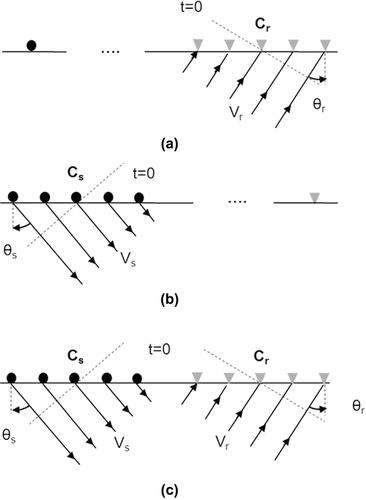
 , to obtain constructive interference of the time-delayed recorded signals after summation on the whole array. The source–receiver distance is assumed large enough that the arriving wavefronts can be taken locally as plane waves. In this case, the time delay of a given receiver at position xi with regard to one reference point xc (typically chosen at the center of the array) is given by
 (2)
(2) (3)
(3) and
and  (Fig. 1c), i.e.,
 (4)
(4) (5)
(5)After projection from the point-to-point signal space onto the beam-to-beam space, each wave has an intensity maximum in the 3D matrix S at travel time t and can also be characterized by the two departure and arrival angles  and
and  . In analogy with the point-to-point definition, the corresponding raypath that connects the centers of the source and receiver arrays is called the eigenpath.
 in addition to elevation angles
  at the source and receiver arrays. Taking into account both the x and y coordinates, DBF then requires the computation of the updated delay τ, i.e.,
 (6)
(6) (7)
(7) (8)
(8) can be introduced into equation 7, using the following relationship:
 (9)
(9) is the surface velocity at the array location. The final matrix S then becomes
 (10)
(10)Through the DBF projection, each eigenbeam is associated with a maximum of intensity in the S matrix that corresponds to an eigenpath in the physical space. By projection of the propagating waves on planar wavefronts, the advantage of the DBF technique is: (i) enhancement of the signal-to-noise ratio through array gain, and (ii) separation and identification of the contributions of the different wave arrivals. In the frame-of-field 4D monitoring, the medium is supposed to face changes mainly at depth. The near-surface wave velocity is supposed to be constant or compensated. Under these conditions and considering equation 9, this means that the slowness variations correspond in practice to angle variations.
As mentioned above, wave separation is essential in 4D monitoring as it avoids the measurement of time variations in a time window that mixes several arrivals with different time variations. After DBF processing, wave separation is performed by zeroing the undesired intensity spots in the slowness/azimuth domain. If needed, the inverse DBF transformation allows the separated waves to be recovered in the time-offset domain by applying inverse delays (de Cacqueray et al. 2011). With repetitive records for all of the source–receiver pairs over a given period, DBF allows the extraction of a set of eigenbeams from each record. Once identified and matched to a ray path, the corresponding arrival times, slowness, and/or azimuths can be measured and monitored over a certain period. Practically, the travel-time variations are measured after inverse DBF with regard to a reference signal (defined as the baseline). Each wavelet is cross-correlated with the baseline wavelet, and the arrival-time variations are computed at the maximum of the correlation, with second-order interpolation. The same cross-correlation and interpolation were performed in the slowness and azimuth domains at the time of the intensity maximum. Applications of this monitoring method to both laboratory-scale data and field data are presented in the following sections.
LABORATORY EXPERIMENTS
The algorithm was first tested in a laboratory-scale experiment to monitor velocity variations induced by temperature variation at depth. The chosen medium was an agar–agar phantom made of water mixed with ∼5% agar–agar powder as the gelling agent. The cooking process to get such a gel was described by de Cacqueray (2012). With the S-wave and the Rayleigh-wave velocities at about 8 m/s, and the emitted signal with a central frequency close to 450 Hz, the average wavelength was about 1.7 cm. Note that the P-wave velocity of the order of that of water guaranties completes separation of P-waves and S-waves. With such an extreme ratio of P-wave and S-wave velocities, the Rayleigh wave speed was of the order of 0.955 times the shear-wave speed. The sources are 12-mm-diameter piezoelectric ceramics that were fastened on the gel, which generated a sweep from 120 Hz to 820 Hz. A laser vibrometer was used to record the vertical component of the gel surface velocity at a 10 kHz sampling rate.
An agar–agar gel of 450 mm × 150 mm × 90 mm was built at a temperature of about 85°C. The global temperature was then slowly decreased over a period of about two days, during which time the experiment was carried out.
This experimental environment is represented in Fig. 2. Using one squared array of 5 × 5 sources and one squared array of 5 × 5 receivers, double beamforming (DBF) provided the travel time, amplitude, source and receiver slowness, and source and receiver azimuths of the wave that propagates from the source array to the receiver array. A receiver and source spacing of 15 mm allowed spatial sampling that was precise enough. Note that there was dissymmetry in the source–receiver configuration with respect to the boundary of the gel sample. This is mainly because, at the beginning of the solidification, the gel volume decreased, and this generally leads to an imperfect parallelogram. For a gel of this size, the difference can reach up to 5 mm from one side to another and from the top to the bottom of the gel. Furthermore, a weight was put on the source array for better coupling. This increases the strain below the array, and it might have affected locally on the gel velocity on the source array.
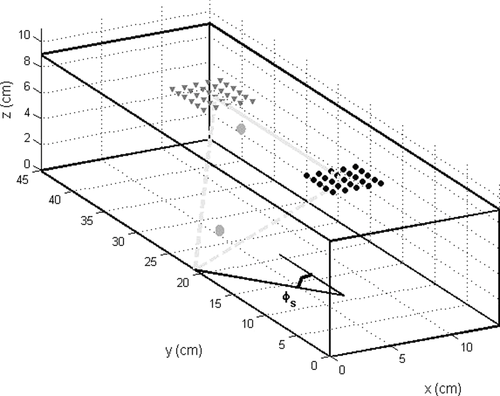
The 625 successive acquisitions for all of the source–receiver pairs were performed every 22 min over two days of acquisition. For both the laboratory experiment and the field data, the recording time is related to the samples of one trace record, and the calendar time concerns the repetitive shots over a certain period during the survey.
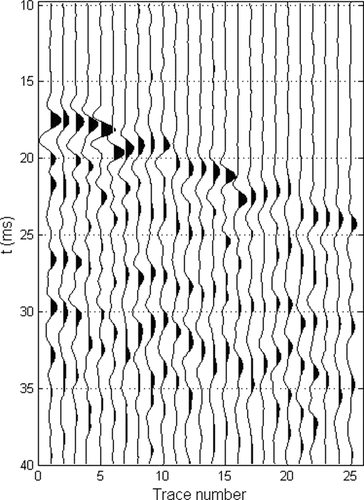
The gel temperature was recorded at the surface and at depth (Fig. 2, grey dots). An example of the raw data is given in Fig. 3, which shows 25 traces that were recorded at the receiver array for one source emitting in the source array. The first arrival is easy to identify, but for the later arrivals, wave separation and identification appear not to be possible without array processing.
The experiment took place in several stages. It started shortly after the gel had solidified, i.e., when the gel temperature was higher than the room temperature. We expected then that the gel would show global cooling during the experiment. The hypothesis was that the temperature variation induces global velocity variations within the gel. These velocity variations will impact upon the arrival-time variations of the waves that propagate in the medium. In addition, local heating at depth was triggered in the middle of the experiment, at 22 h 40 min. A small resistor was set at the bottom of the box containing the gel, halfway between the source and the receiver arrays. This local heating was controlled through the second temperature probe at depth (Fig. 2).
The travel-time, slowness, and azimuth variations of the extracted waves are represented with respect to time, in comparison with the temperature evolution. We consider the direct surface wave and the S-body wave reflection shown in Fig. 2 (solid grey line and dashed grey line, respectively). The surface wave is the most energetic. The bottom-corner-reflected S-body wave is of particular interest as it has incidence (θs, θr) and azimuth (ϕs, ϕr) angles that are different from zero. Accordingly, it can show both slowness and azimuth variations, which further justifies the use of 2D surface arrays. Note that a series of bottom-reflected S-body waves could have been extracted from the data (de Cacqueray et al. 2011).
The waves are separated using DBF in five dimensions using equation 10. Four 2D subsets of the S matrix are shown in Fig. 4(a–d), to highlight the wave separation. The direct surface wave is well isolated in both the slowness and azimuth domains (Fig. 4a, b), as well as the S-body reflection in the corner (Fig. 4c, d). The direct surface wave arrives at time t = 23 ms and travels with the source and receiver azimuth angles close to 0° (Fig. 4b). As expected, it propagates along the source–receiver axis with a slowness of about 0.12 s/m, which corresponds to a velocity of 8.3 m/s.
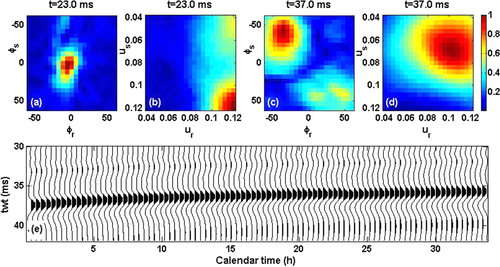
For the S-body wave reflection, and using the conventions given in Fig. 2, the azimuth angles are ϕs∼36° on the source array, and ϕr∼-42° on the receiver array (Fig. 4c). The difference in (ϕs, ϕr) can be attributed to the gel heterogeneity and/or the acquisition design dissymmetry. The weaker spot at positive azimuths is due to a residual from the reflection at the right corner. The intensity difference is associated with the slight dissymmetry of the array configuration with respect to the gel boundaries, which induces a different arrival-time of this second reflection. Note that these two waves are separated in the beam-to-beam space but would interfere with point-to-point signals around t = 31 ms.
As expected for a reflection, the incidence angle is non-null (Fig. 4d). We measure an apparent source slowness of 0.068 s/m and an apparent receiver slowness of 0.1 s/m. This difference further confirms the gel heterogeneity, with a significant velocity difference below the source and the receiver arrays that leads to the observed different source and receiver incidence angles. As already noted, the setup of the source array is probably responsible for this difference in speed.
After wave separation, the DBF wavelets are available in the time domain (Fig. 4e). Figure 5(b) shows the reflected S-wave time delay for all of the measurement times. These delays were evaluated with the method presented in the previous section. The baseline wavelet was created by averaging five records around hour 24. The global velocity variation over the whole period corresponds to a travel-time diminution, in agreement with a global temperature decrease (Fig. 5a). For the long-term cooling of the gel, we observed a decrease in the travel times for both the surface and S-waves used to probe the medium. We also noted a clear travel-time variation for the S-wave during the local heating sequence at depth, at around hour 23. As expected, only the S-wave bottom reflection was affected by the heating at depth. The relative travel-time variation for this event at depth is about 0.25% (Fig. 5b, Inset) for the travel time, which corresponds to a delay of about 92 μs for this wave.
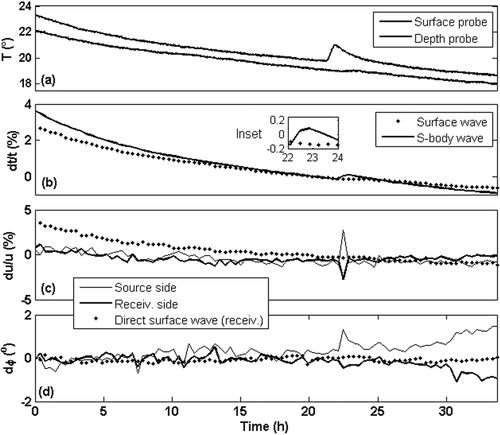
Figure 5(c, d) shows the slowness and azimuth variations for both the surface and S-waves. As expected from equation 9, the slowness variation du/u (Fig. 5c, dashed line) is identical to the travel-time variation dt/t (Fig. 5b, dashed line) for the surface wave (for which  ) when the cooling is homogeneous in the gel. Still for the surface wave, the azimuth stays almost constant around 0°, and the same behavior is observed on the source side (not displayed for the sake of clarity). For the S-wave bottom reflection, no long-term variation of the slowness is observed during the global cooling process since
  remains constant along the ray path according to Fermat's principle. However, note that a slow evolution of the azimuths (∼1°) after t = 25 h might be associated to heat diffusion at the bottom of the gel after the transient local heating.
Considering both slowness and azimuth, for the S-wave, the velocity change at depth induces a positive variation at the source side and a negative variation at the receiver side (Fig. 5c, d). This can be understood through quantitative evaluation of the sensitivity kernels of the reflected wave, as was shown for travel-time and slowness observables by Aulanier et al. (2013a, b) in the context of shallow-water ocean tomography with DBF processing. In these studies, they demonstrated that, although the DBF sensitivity kernel pattern for travel time evolves smoothly across the Fresnel zone, the sensitivity kernel for the source and receiver angles (analogous to source and receiver slowness) presents an abrupt sign change on each side of the ray path. This sign change in the sensitivity kernel for angles explains the opposite slowness variations observed on the source and receiver sides when the local velocity is modified through the temperature around the reflection point at depth.
Finally, focusing again on the local velocity change at depth, we note that the transient slowness variation is about ten times greater than the travel-time variation. Indeed, the travel-time variation is an integral measurement that accumulates along the ray path. When the velocity change is only local, the relative travel-time variation dt/t is classically very small. On the other hand, angle variations are associated to local changes in the refraction index and can reach significant values even for local velocity changes.
In conclusion, this laboratory experiment confirms that the travel-time and slowness observables measured for reflected S-body waves have different sensitivities to global and local velocity changes in the medium. Finally, as illustrated by Montelli et al. (2006), P-wave and S-wave sensitivity kernels have similar shapes. While the laboratory experiment used S-body waves as described above, the DBF processing was tested on field data using P-body waves, as is shown in the following.
FIELD EXPERIMENT
The results obtained for the 4D monitoring with the laboratory data now need to be demonstrated for the field environment. There are only a few acquisition designs that are adapted to simultaneous source and receiver array analysis. Nevertheless, the number of sources and receivers in the field is generally high enough that subsets can be chosen and used as source–receiver arrays.
Permanent reservoir monitoring surveys are rare, which is mainly due to cost issues. For the present study, we benefited from a dataset that was recorded permanently over several months for a heavy-oil field. The spread was not large (about 1 km long, 100 m wide, with a maximum offset of 800 m). Moreover, near offsets have been muted due to strong surface-wave energy. Finally, the average incidence angle was about 16° for this field, so that angle-versus-offset (AVO) processing was not possible, although the interest in considering the arrival-angle remains.
It is known that the changes in fluid properties with temperature significantly affect velocities (Eastwood 1993). This means that arrival-time variations have to be also affected. For this field experiment, we expected that the steam injection would create significant parameter changes within the reservoir, including temperature increases, and thus velocity variation. In addition, correlations between amplitude variations and arrival-time variations with steam injection and well pressure were demonstrated for this dataset by Cotton et al. (2012).
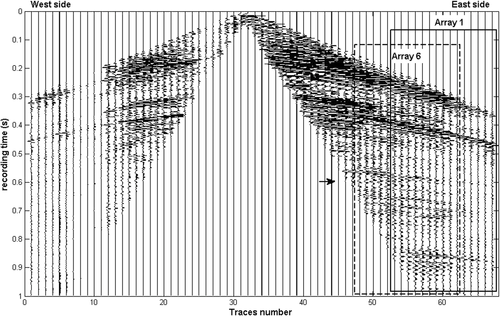
In the present study, we computed arrival-time variations using array processing techniques, compared with slowness variations. The dataset was obtained from a field trial that was set up to monitor steam injection within a reservoir, using injection wells in The Netherlands. One line of sources and several lines of receivers were installed at depth (i.e., buried), to permanently monitor subsurface variations. In this field trial, piezo-sources at 25 m in depth are emitted in the range of 5 Hz to 184.75 Hz. The combination of a dual-depth 6-m and 9-m hydrophone was used to mitigate the receiver ghost effect (Cotton and Forgues 2012). Due to the in-line positioning, only 1D source–receiver arrays were processed. The raw data contained noise from high-energy S-waves and multiples. The S-waves were simply removed by muting the arrival with a velocity lower than 350 m/s, whereas radon transform allowed the removal of the multiples. With buried sources and receivers, the waves reflected at the surface needed to be taken into account. Indeed, these waves travel through the weathering zone and undergo high 4D variations. To remove this spurious effect, a filter was applied in the calendar time domain, as described by Cotton and Forgues (2012). Figure 6(a) shows a top view of the acquisition design, with the buried receivers (squares), the buried sources (circles), and the wells. Figure 7 shows the raw data for one source and one line of 68 receivers, for which two aspects can be noted: (i) short offset traces are not usable due to severely muted S-waves, and (ii) the data quality on the west side of the spread is poor.
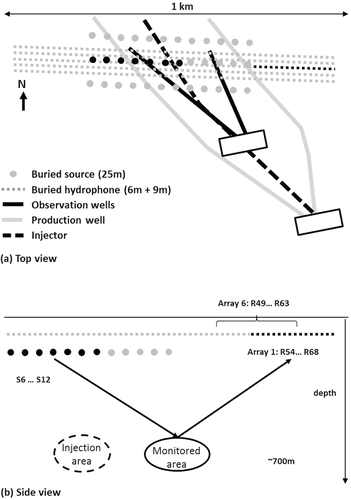
The field environment was designed for conventional 4D monitoring that does not imply the use of array processing. The subset of sources and receivers selected for double beamforming (DBF) was thus not optimized for this purpose. In particular, the receiver spacing was 16 m, whereas the source spacing was about 48 m. For frequencies above 40 Hz, the planar projection requested for beamforming on the source–receiver arrays was imperfect as the far-field hypothesis between the two arrays was not fulfilled. Moreover, the poor spatial sampling on the source array can induce spatial aliasing, i.e., strong sidelobes in the beam space.
To fix the spatial sampling issue and to benefit from the best data quality (Fig. 7, right side), a subset of 15 receivers (Fig. 6a, b; receivers 54 to 68, black squares) were selected that were far enough from the seven sources (Fig. 6a, b; black circles). For the 1D depth velocity model and planar interfaces, the ray paths were symmetrical from the source array to the receiver array. Then, the waves that reflected roughly at equal distances from the source array center and the receiver array center can be monitored (Fig. 6b, black ellipse). However, with this layout, the injector well was not at an equal distance from the two arrays. More precisely, the monitored area was shifted about 240 m eastwards from the injector well (Fig. 6b). To check the data for consistency, it is possible to shift the monitored area by choosing another set of receivers. For example, if the receiver array uses receivers 49 to 63 (defined as Array 6 in Fig. 6b), the shift is 80 m eastwards at the surface, which means 40 m at depth, The shift between Array 1 and Array 6 is limited to a small quantity of receivers, to avoid the muted traces (Fig. 7).
In Fig. 7, the recorded signals are plotted after muting the slow arrivals that correspond to high-amplitude surface waves. The signal amplitudes vary significantly from one trace to another. As we were investigating kinematic properties, the amplitudes were normalized before DBF, to avoid possible bias in the beamforming process. This amplitude normalization was applied to give the same weight to each sensor in the DBF process, regardless of the local coupling effect that might occur in the subsurface.
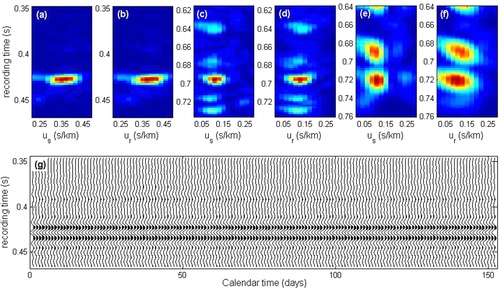
As only 1D source–receiver arrays were available, the DBF data were simply projected in the slowness domain (no azimuth information). Several spatially coherent wavefronts are visible in the raw data (Fig. 7). To evaluate the 4D monitoring performance of the algorithm, DBF was applied to three reflections, which included: (i) a reflection above the reservoir that arrived at around t = 428 ms, (ii) a reflection at the reservoir depth, at around t = 690 ms, and (iii) a reflection below the reservoir, at around t = 720 ms.
Figure 8 shows the resulting time versus slowness beams on the source–receiver arrays for the three reflections (Fig. 8a–f) at array 1 (Fig. 6b). The DBF measurements (arrival time and source and receiver slowness) for each wave are presented in Table 1. This shows similar source and receiver slowness for each reflection, which means that the propagation path is certainly symmetrical. With a signal-to-noise ratio that ranges from about 12 dB for the last reflection up to more than 30 dB for the first reflection, the travel-time uncertainties due to noise can be neglected. In addition, the first reflection wavelet extracted with DBF over 152 days is shown in Fig. 8(g), which highlights the very good signal repeatability. To avoid noise at low frequencies, and to limit the band to frequencies for which the aliasing effects are expected to be weak, we analysed the data in the 35–170-Hz frequency band. In practice, the slowness was monitored day by day from the time versus slowness representation, whereas the arrival-time variation was measured from the extracted DBF wavelet.
| Arrival time | Source | Receiver | |
|---|---|---|---|
| at 456 m | slowness | slowness | |
| Reflection | offset (ms) | (s/km) | (s/km) |
| Above the reservoir | 428 | 0.172 | 0.19 |
| At the reservoir depth | 690 | 0.141 | 0.137 |
| Below the reservoir | 720 | 0.113 | 0.113 |
Figure 9 shows the daily variations for the three reflections at array 1. Figure 9(a) shows minor variations for the reflection above the reservoir. This observation is confirmed for the arrival time, source slowness, and receiver slowness (Fig. 9d, g). The variations are stronger for the reflection in the reservoir. In particular, the slowness measured for the source and the receiver arrays varied with opposite signs, which is consistent with a local velocity change at depth. The amplitude difference between the source and receiver sides can be due to (i) imperfect correction of the first layer variation and/or (ii) dissymmetry in the reservoir behavior at depth, as shown by Cotton et al. (2013). The coherence between the three observables is also highlighted for the wave reflected below the reservoir, for which significant and comparable events can be noted around days 72, 100, and 125. Comparing the waves in and below the reservoir, the results show similar behavior but with stronger fluctuations below the reservoir. This is in agreement with the larger recording time that corresponds to a longer travel path in the medium that is subject to a larger accumulation of delays. In general, the slowness measurement shows a better signal-to-noise ratio for the field data compared with the laboratory data. This is due to the better repeatability achieved with buried sources and receivers.
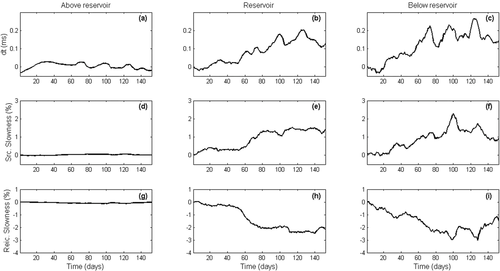
These observations validate the DBF-based monitoring method for field data. Slowness and arrival-time variations show correlated behaviors and some differences that magnify the complementary information due to the slowness variations. The next section addresses the link between velocity, angle, and slowness, to assess the validity of the hypothesis that determines the benefit of potential additional information. Then, comparisons are carried out with: (i) the classical method using common-depth-point collection and (ii) the pressure measurement at the observation well.
DISCUSSION
In the following, we describe the relation between slowness and velocity variations. Considering the full ray path, the measured relative travel time is very small. The maximum travel-time variation for the third wave at day 122 (Fig. 9g) is about 0.25 ms for a travel time of about 0.7 s, which is less than 0.04%. As in the laboratory experiment, we observe that the local change leads to small travel-time variations. This can also be quantified at depth in relation to the reservoir thickness. The reservoir thickness is about 20 m for a mean velocity of 2,000 m/s, which roughly corresponds to 10-ms travel-time propagation within the reservoir. This leads to a relative travel time of about 2.5%, which is of the same order of magnitude as the 3% slowness variation measured the same day. More quantitative comparison might appear not to be relevant due to the difference between the travel-time and slowness measurements.
Note that compaction can have a significant effect on the travel-time computation. A detailed study was carried out by Landrø and Stammeijer (2004) to quantify its impact. For example, their study mentioned a compaction of 6 m for ten years of production at the Ecofisk field. In the present study, no compaction has been mentioned in recent publications. In addition, interferometric synthetic aperture radar measurements performed since 2012—with below-centimeter precision—did not highlight any surface subsidence.
The above analysis confirms that slowness variation can be used to track the velocity variation. In addition, beamforming allows the use of 2D arrays to separate waves. This can be useful when several reflections with similar arrival times are mixed in the time domain. It should be noted that, in seismic exploration, reflections at similar depth frequently share similar slowness due to the velocity profiles (with lower velocity at the near surface, reflections tend to arrive normal to the surface). In this case, the beamforming resolution might be insufficient to separate different arrivals. The use of high-resolution beamforming is a way to separate such arrivals, with the possibility to keep both the travel-time and slowness information (Le Touzé et al. 2012).
Going further through the interpretation of these data in terms of the changes in specific physical properties is difficult. As explained by Hornman et al. (2012), the travel-time variations depend on pressure, temperature, gas saturation, and steam. All of these parameters can have constructive or destructive effects. Generally, steam injection is linked with temperature increases and water pressure increases that result in P-wave velocity decreases and travel-time increases. This was observed around the injector well by Cotton et al. (2012, 2013), who computed travel-time and amplitude variations using classical seismic processing (stacks of common-depth-point (CDP) collection and migration). The same trend was observed using double beamforming (DBF), with a similar order of magnitude for the arrival-time variations (between 0 and 0.4 ms for both studies). Going deeper into the comparison is not easy for two reasons. First, the acquisition device only targets the east side of the injector well, as the main events were observed at the center of the layout. Secondly, the stacked CDP collection and DBF traces are not fully comparable, as they differ in terms of their travel-time sensitivity kernels (TSKs).
For wave propagation, the TSK quantifies the impact of local velocity variations on the travel time. TSKs were introduced in seismology for 2D finite-frequency tomography by Luo and Shuster (1991) and Woodward (1992). These were adapted for 3D tomography (Marquering, Dahlen, and Nolet 1999; Dahlen, Hung, and Nolet 2000) for both P-wave and S-wave propagation (Montelli et al. 2006). More recently, TSKs have been used to monitor dynamical variations in the oceanographic context (Iturbe et al. 2009a, b; Marandet 2011). In the first-order Born approximation, theoretical TSKs have been computed for DBF in acoustic waveguides (Iturbe et al. 2009a, b). In the Appendix, the formulation from Iturbe et al. (2009a) is adapted for a CDP collection in an acoustic medium. TSKs in the acoustic approximation appear well suited for two reasons: (i) the use of TSKs is limited here to the comparison of the sensitivity zones of the DBF and the CDP collection for P-waves at the reflector, and (ii) the use of hydrophones as seismic receivers in the field experiment. The resulting TSKs are presented in Fig. 10(a) for a single source–receiver pair and for a P-wave velocity of 2,000 m/s. Using normal moveout correction, the TSKs were computed for a collection of seven CDPs (Fig. 10c). This can be compared with TSKs obtained with DBF, with one source array of seven sources, and one receiver array of 15 receivers (Fig. 10b). For a better comparison, Fig. 11 shows the normalized TSKs at the target depth (700 m).
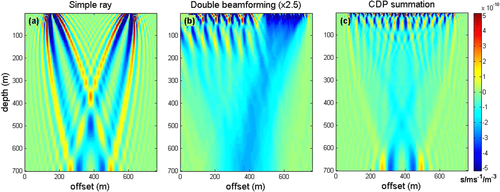
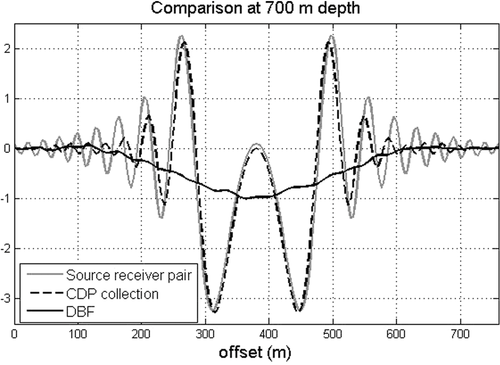
As with Iturbe et al. (2009a, b) and Marandet et al. (2011), we observe oscillations of the TSKs around the ray path for the single source–receiver pair (Fig. 10a). The TSKs of the CDP collection show similar oscillations (Figs. 10b, 11). This means that depending on the location of the velocity variations within the medium, the contribution to the travel time can be either negative or, counter-intuitively, positive. When averaged over the zone of interest, the global contribution respects intuition: If the velocity increases, the travel time decreases. Figure 10(c) also highlights the TSK sensitivity of the CDP to the velocity model, through the location of the positive and negative travel-time fluctuations at the reflector. On the contrary, due to beamforming properties (Iturbe et al. 2009a), the TSKs using arrays spatially smoothens the polarity inversion, such that the velocity variation at depth and the induced travel-time variation are of opposite sign (Figs. 10b and 11, black line). The DBF processing then provides robust inversion data with respect to the velocity model at depth. Finally, the DBF sensitivity in Fig. 10(b) is about three times lower than the CDP sensitivity in Fig. 10(c). Taking into account the mitigation linked to TSK oscillations in the CDP case, this shows that, for similar velocity variation, the arrival-time variations of both methods can vary significantly.
In the present case, the spatial extension of the DBF TSK—almost 300 m (Fig. 11)—leads to spatial smoothing of the velocity variations. This can be modified in future acquisitions with another array design that is dedicated to DBF processing. It has the advantage of showing evidence of travel-time variations, even with arrays that are not centered on the injection well. Finally, with different TSKs, CDP and DBF processing appears complementary. DBF provides robustness over larger areas without a depth velocity model and migration, whereas CDP provides sensitivity (Figs. 10 and 11) and resolution. In seismic exploration, the use of CDP collection—and migration—is dedicated to large surveys. Array processing appears to be more appropriate to target a specific issue in smaller areas (Zheng et al. 2011).
In Fig. 9, a series of abrupt changes are particularly visible for the wave reflected below the reservoir (Fig. 9c, f, I). These consist of three main phases of velocity decrease, followed by relaxation, until the next decrease period. These temporal variations are the signatures of classical reservoir activity. Further interpretation appears not to be relevant at this stage, due to the multiple parameters implied in the travel-time variations and the spatial smoothing induced by the acquisition design. Moreover, with the 1D shape of the source and receiver arrays preventing any azimuthal discrimination, several 4D events can be mixed, particularly when the calendar time increases. Finally, the small velocity discontinuity at reservoir depth should be mentioned, as highlighted by Cotton et al. (2013), which can increase the complexity of the interpretation.
To perform the comparison, a stack was computed after normal moveout correction for all of the days using the central hydrophones line (Fig. 6a) and for all of the sources, except the first one, which showed lower repeatability. The reflection in the reservoir was windowed to compute the travel-time variations. Figure 12 shows the result (dashed line) in comparison with the DBF processing results (markers). It highlights the good correlation between these two methods. We observe that the DBF method shows travel-time variations that are about half the strength of the stacked CDP. This is in agreement with the TSK study that highlights the lower sensitivity of the DBF method (Fig. 10). It has to be noted that the travel time has not been computed exactly for the same area at depth for the two methods. As illustrated in Fig. 6, the area monitored by the DBF technique was shifted roughly 120 m to the east. Figure 11 shows that DBF can allow detection of velocity variations far from the event (more than 150 m), whereas the CDP method mixes positive and negative variations for a narrower area.
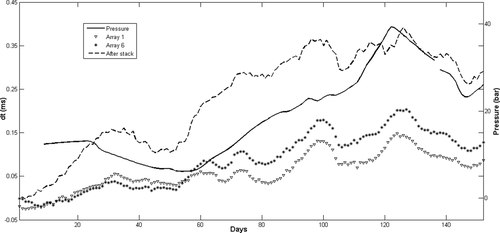

As described in the field experiment section, the DBF layout can be shifted by selecting another set of receivers. By shifting the receiver array from six receivers, the monitored area can be shifted 40 m to the west, which shows an increase in the travel-time variation (Fig. 12). This is in agreement with the steam injection that was performed on the west side of the receiving arrays (Fig. 6b).
With the DBF acquisition device, the monitored area is more or less centred on the east observation well for which the pressure measurement was available. Figure 12 superimposes in the well pressure (dashed line) on arrival-time variations at reservoir depth for receivers of Arrays 1 and 6, as described in Fig. 6(b). Despite the different natures of the observables, i.e., well-pressure measurements are extremely local, whereas seismic measurements cover a large area, significant correlation is observed between these two methods over the time of the monitoring. As no more direct measurement at depth is available, this cannot be concluded on the most accurate results. The strong correlation between measurements and sensitivity kernels shows that similar information can be reached with different methods using different data subsets. The DBF method for travel time and slowness used seven sources and 15 receivers shifted from the measurement point, whereas the CDP method used more sources and receivers that were generally centred above the area of interest. This confirms the redundancy of the 4D information and that it is possible to extract more or at least different information from the data. The correct combination of all of the observables in a global inversion that takes into account their different sensitivity kernels is still to be investigated.
CONCLUSIONS
The part of the present study performed at the laboratory-scale demonstrates that slowness and travel time can be used as complementary observables in 4D monitoring. For the field data, DBF appears to be a promising tool to separate and identify reflected waves. Due to the specific array configuration, the exact injection area is not reached by the specular eigenrays. However, the TSK spread indicates that a shift of about 150 m in the target is not really an obstacle. We show that source and reception slowness and arrival-time variations are highly correlated. Both of these led to the detection of temporal changes that are consistent with the results of the conventional active method and pressure measurements at the observation well. Slowness and azimuth monitoring appears to be a new way to monitor subsurface variations. The complementarity with other observables, as well as the potential additional information brought to reservoir observation, remains to be quantified. To achieve this goal, new studies are needed, with designs dedicated to array processing, including 2D receiving arrays with appropriate source and receiver spatial sampling.
ACKNOWLEDGEMENTS
The authors would like to thank Shell and NAM for their authorization to use the field dataset, and the European Research Council for its support through the Advanced Grant Whisper (227507).
APPENDIX: TRAVEL-TIME SENSITIVITY KERNELS FOR DYNAMIC CHANGES IN A GEOPHYSICAL CONTEXT
Travel-time sensitivity kernels (TSKs) were introduced in tomography by Luo and Shuster (1991) and Woodward (1992). TSKs were then adapted for dynamic changes in underwater acoustics by Iturbe et al. (2009a), with double beamforming (DBF) processing. In the following, an adaptation is proposed for common depth point (CDP) collection in the geophysical context.
 for a source–receiver pair (as point-to-point propagation) and a velocity variation field
  Fig. 12, grey square). This can be written for an acoustic field as
 (11)
(11) and
and  give the source and receiver positions,
  is the travel-time sensitivity kernel, and the arrival time corresponds to the amplitude maximum.
 can be written as p,
  , and
, and  . Using the results from Skarsoulis and Cornuelle (2004), the TSKs are computed in the frequency domain according to (Iturbe et al. 2009b) the following:
 (12)
(12) (13)
(13) is the frequency spectrum of the source signal, and G is the Green's function in the frequency domain for homogeneous free space, i.e.,
 (14)
(14)In practical cases, contributions of several source–receiver pairs are considered instead of a single source–receiver pair. For example, Iturbe et al. (2009a, b) considered arrays of sources and receivers and benefited from the TSK properties using DBF. In seismic exploration, for imaging issues, sources and receivers are paired by common mid-point or CDP. The contributions of all of the pairs are summed after normal moveout (NMO) correction, to retrieve the null-incidence reflection. This summation, called stacking, is a key step in seismic exploration data processing (Yilmaz 1987), and it is used to enhance the signal-to-noise ratio. The NMO correction compensates for the travel-time differences of different source–receiver pairs.
The TSKs of the same CDP collection can be computed theoretically by summing the contributions of each source–receiver pair. For each source–receiver pair, the TSK is given by equation 12. A delay is applied to each source–receiver pair to compensate for the NMO correction, and the summation is performed.
 is the NMO correction for the source–receiver collection (Si, Ri), the TSK for a common mid-point collection is given by
 (15)
(15)The resultant TSK after summation of seven source–receiver pairs is shown in Fig. 10(c) for a reflection at a depth of 700 m. The TSK for a single source–receiver pair is shown in Fig. 10(a) for comparison.


