Genetic Knock-out of TNFR1 and TNFR2 in a JAK2-V617F Polycythemia Vera Mouse Model
Supplemental digital content is available for this article.
Myeloproliferative neoplasms (MPN) are a group of hematological disorders characterized by myeloid cell expansion including erythrocytes, thrombocytes, and leukocytes.1 Besides mutations in JAK2, MPL, or calreticulin, chronic inflammation, including high serum levels of proinflammatory cytokines, plays a pivotal role in the pathophysiology of the classical BCR-ABL-negative MPNs polycythemia vera (PV), essential thrombocytosis, and primary myelofibrosis.2, 3 High-inflammatory cytokine levels in patients are associated with a variety of constitutive clinical symptoms (eg, fever, cachexia, fatigue, CRP-elevation).4 In addition, chronic inflammation contributes to the development of arterial and venous thrombosis, a major factor in morbidity and mortality in MPN. Recently, it has been suggested, that chronic inflammation may also play an important role in the initiation of MPN.5 Indeed, persistent TNFα production after toll-like receptor (TLR) ligation was found in both wild-type and JAK2-V617F monocytes obtained from JAK2-V617F-positive patients.5 This suggests that defective negative regulation of TLR-agonist-induced TNFα production is potentially a predisposing factor to acquire the disease.5 Interestingly, in JAK2-V617F-positive MPN patients, it has been shown that TNFα facilitated clonal expansion of JAK2-V617F-positive cells both in CFU-GM and BFU-E.6
TNFα is a pleiotropic cytokine expressed in two isoforms: transmembrane TNFα (tm-TNFα) and soluble TNFα (s-TNFα), which is released from the cell surface by proteolytic shedding by ADAM17.7 The various functions of TNFα rely on the binding to 2 distinct receptors. TNFR1 is ubiquitously expressed and activated by both s-TNFα and tm-TNFα.7 In contrast, TNFR2 is mainly expressed on immune cells like T and B cells and is only activated by tm-TNFα. Binding of TNFα to TNFR1 predominantly activates proinflammatory and proapoptotic pathways, whereas binding of TNF to TNFR2 activates prosurvival functions.7 Regarding the role of TNFα receptors in MPN, it has been shown that blockade of the TNFα-pathway via anti-TNFR2 antibody treatment decreased clonogenic growth of Lin– Kit+ bone marrow (BM) cells from MPN mice and of human CD34+ cells from myelofibrosis patients.8 Recently, our group showed that anti-TNFR1 antibody treatment reduced hematocrit (HCT) and splenomegaly in a JAK2-V617F knock-in mouse model (JAK2+/VF) expressing a chimeric TNFR1, composed of the human extracellular domain and the murine transmembrane and intracellular domains.9
Here, we studied the influence of the TNFα receptors TNFR1 and TNFR2, respectively, on MPN development by disrupting the respective genes in the aforementioned JAK2+/VF PV-like mouse model. To achieve TNFR1 or TNFR2 disruption, TNFR1–/– or TNFR2–/– mice were crossed with the Vav1-Cre × JAK2-V617F knock-in model. This resulted in specific disruption of TNFR1 and TNFR2 expression in myeloid cells during intrauterine disease development and was shown to reduce TNFα signaling in cells derived from TNFR1–/– × JAK2+/VF or TNFR2–/– × JAK2+/VF mice (Suppl. Figure S1). TNFR1/2+/+ × JAK2+/+ and TNFR1/2+/+ × JAK2+/VF mice have already been described in a previous publication from our group and were used as internal controls.9
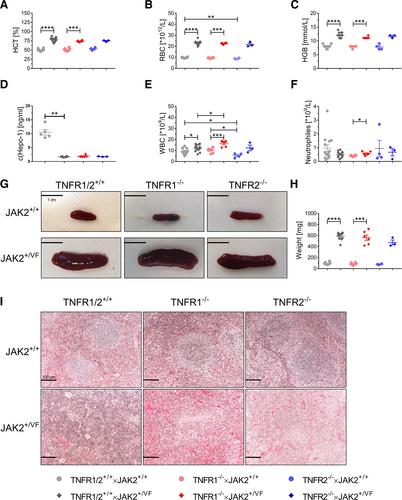
Deletion of either TNFR1 or TNFR2 in JAK2+/VF mice had only minor effects on the PV-like clinical features such as elevated HCT, elevated red blood cell count, and elevated hemoglobin (Figure 1A–C). Similarly, both knock-outs did not strongly influence these parameters in JAK2+/+ mice. Mean HCT levels showed minor variation between JAK2+/VF mice expressing normal levels of TNFR1 and TNFR2 (TNFR1/2+/+ × JAK2+/VF mice) (mean HCT: 78.0%), TNFR1–/– × JAK2+/VF (mean HCT: 73.8%) and TNFR2–/– × JAK2+/VF mice (mean HCT: 74.7%), respectively (Figure 1A). A similar result was observed for the mean red blood cell counts and hemoglobin (Figure 1B,C). With regard to the disturbed iron-metabolism, induced by the PV-like disease of JAK2+/VF mice,10 TNFR1 and TNFR2 knock-outs did not show any alteration, as hepcidin levels were almost unchanged in TNFR1–/– × JAK2+/VF and TNFR2–/– × JAK2+/VF mice compared with TNFR1/2+/+ × JAK2+/VF (TNFR1/2+/+ × JAK2+/VF mice 1.71 ng/mL, TNFR1–/– × JAK2+/VF: 1.91 ng/mL; TNFR2–/– × JAK2+/VF: 1.77 ng/mL) (Figure 1D).
As expected, the white blood cell (WBC) count was significantly increased in JAK2+/VF mice compared with JAK2+/+ mice (Figure 1E). Of interest, this effect was further enhanced in TNFR1–/– (TNFR1–/– × JAK2+/+: 10.2 × 10⁹/L; TNFR1–/– × JAK2+/VF: 16.5 × 10⁹/L) and TNFR2–/– mice (TNFR2–/– × JAK2+/+: 5.4 × 10⁹/L; TNFR2–/– × JAK2+/VF: 12.3 × 10⁹/L) as compared to TNFR1/2+/+ mice (TNFR1/2+/+ × JAK2+/+: 9.3 × 10⁹/L; TNFR1/2+/+ × JAK2+/VF: 12.3 × 10⁹/L). Splenomegaly was only marginally reduced in TNFR1–/– × JAK2+/VF and TNFR2–/– × JAK2+/VF mice. There was no improvement by TNFR1–/– or TNFR2–/– of the splenic histopathology in JAK2+/VF mice, as the white pulp was completely eradicated in each JAK2+/VF strain (Figure 1G–I).11 Taken together, our data indicate that TNFα signaling via TNFR1 and TNFR2 is not essential for initiation and development of PV-like features in the JAK2+/VF knock-in mouse model. This is in line with results investigating a total TNFα-knock-out in a different MPN mouse model.6

Influence of a TNFR1 or TNFR2 knock-out on MPN development in the JAK2+/VF mouse model. Blood count analysis and spleen weight in TNFR1/2+/+ × JAK2+/+ (age 10–13 wks), TNFR1/2+/+ × JAK2+/VF (age 10–13 wks), TNFR1–/– × JAK2+/+ (age 11–13 wks), TNFR1–/– × JAK2+/VF (age 11–13 wks), TNFR2–/– × JAK2+/+ mice (age 11–12 wks), and TNFR2–/– × JAK2+/VF mice (age 10–13 wks). TNFR1/2+/+ × JAK2+/+ and TNFR1/2+/+ × JAK2+/VF mice have already been described in a previous publication from our group and were used as internal controls.9 (A) HCT analysis of TNFR1/2+/+ × JAK2+/+ (n = 14), TNFR1/2+/+ × JAK2+/VF (n = 13), TNFR1–/– × JAK2+/+ (n = 8), TNFR1–/– × JAK2+/VF (n = 6), TNFR2–/– × JAK2+/+ mice (n = 4), and TNFR2–/– × JAK2+/VF mice (n = 3). (B) RBC count of TNFR1/2+/+ × JAK2+/+ (n = 14), TNFR1/2+/+ × JAK2+/VF (n = 13), TNFR1–/– × JAK2+/+ (n = 8), TNFR1–/– × JAK2+/VF (n = 6), TNFR2–/– × JAK2+/+ mice (n = 4), and TNFR2–/– × JAK2+/VF mice (n = 3). (C) HGB concentration TNFR1/2+/+ × JAK2+/+ (n = 14), TNFR1/2+/+ × JAK2+/VF (n = 13), TNFR1–/– × JAK2+/+ (n = 8), TNFR1–/– × JAK2+/VF (n = 6), TNFR2–/– × JAK2+/+ mice (n = 4), and TNFR2–/– × JAK2+/VF mice (n = 3). (D) Hepc-1 concentration in the serum of TNFR1/2+/+ × JAK2+/+ (n = 5), TNFR1/2+/+ × JAK2+/VF (n = 6), TNFR1–/– × JAK2+/VF (n = 6) and TNFR2–/– × JAK2+/VF mice (n = 3). (E) WBC count of TNFR1/2+/+ × JAK2+/+ (n = 14), TNFR1/2+/+ × JAK2+/VF (n = 13), TNFR1–/– × JAK2+/+ (n = 8), TNFR1–/– × JAK2+/VF (n = 6), TNFR2–/– × JAK2+/+ mice (n = 4), and TNFR2–/– × JAK2+/VF mice (n = 3). (F) Neutrophil count of TNFR1/2+/+ × JAK2+/+ (n = 14), TNFR1/2+/+ × JAK2+/VF (n = 13), TNFR1–/– × JAK2+/+ (n = 8), TNFR1–/– × JAK2+/VF (n = 6), TNFR2–/– × JAK2+/+ mice (n = 4), and TNFR2–/– × JAK2+/VF mice (n = 3). (G) Representative images of spleens from TNFR1/2+/+ × JAK2+/+ (n = 2), TNFR1/2+/+ × JAK2+/VF (n = 2), TNFR1–/– × JAK2+/+ (n = 2), TNFR1–/– × JAK2+/VF (n = 5), TNFR2–/– × JAK2+/+ mice (n = 2), and TNFR2–/– × JAK2+/VF mice (n = 7); size bar = 1 cm. (H) Spleen weight of TNFR1/2+/+ × JAK2+/+ (n = 10), TNFR1/2+/+ × JAK2+/VF (n = 11), TNFR1–/– × JAK2+/+ (n = 8), TNFR1–/– × JAK2+/VF (n = 6), TNFR2–/– × JAK2+/+ mice (n = 4), and TNFR2–/– × JAK2+/VF mice (n = 3). (I) Representative images of H&E stains of spleen sections from TNFR1/2+/+ × JAK2+/+ (n = 3), TNFR1/2+/+ × JAK2+/VF (n = 3), TNFR1–/– × JAK2+/+ (n = 2), TNFR1–/– × JAK2+/VF (n = 4), TNFR2–/– × JAK2+/+ mice (n = 4), and TNFR2–/– × JAK2+/VF mice (n = 3); magnification = 200×; size bar = 100 µm. WBC = white blood cell.
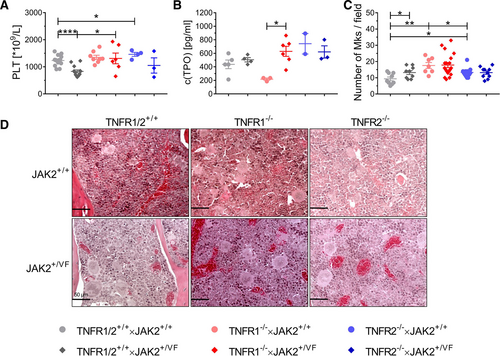
Interestingly, TNFR1/2+/+ × JAK2+/VF mice have a strongly decreased platelet (PLT) count, compared with TNFR1/2+/+ × JAK2+/+ mice (832 × 109/L versus 1,234 × 109/L), a risk predictor of transformation from chronic phase to MPN accelerated phase.12 A decrease in PLT count was also observed in TNFR2–/– × JAK2+/VF mice in comparison to TNFR2–/– × JAK2+/+ mice (1,050 × 109/L versus 1,460 × 109/L), but there was almost no change in the PLT count noted in TNFR1–/– × JAK2+/VF mice (1,312 × 109/L versus 1,351 × 109/L) mice (Figure 2A). Thus, although TNFα concentration is increased in TNFR1–/– × JAK2+/VF mice, there was no inflammation/TNFα induced decrease of platelets in TNFR1–/– × JAK2+/VF mice (Suppl. Table S1 and Suppl. Figure S2). This is in line with Tacchini-Cottier et al, who demonstrated that consumption of platelets by TNFα treatment requires TNFR1.13 Mean thrombopoietin (TPO) concentrations were similar in TNFR1/2+/+ × JAK2+/+ and TNFR1/2+/+ × JAK2+/VF mice (Figure 2B). As changes in TPO levels of PV-patients, have not been reported, differently to essential thrombocytosis–patients, this result is in line with the typical features of PV-like disease in the JAK2+/VF knock-in mouse model.14-16 Strikingly, there is significant increase of TPO levels in TNFR1–/– × JAK2+/VF mice as compared to TNFR1–/– × JAK2+/+ mice. TPO levels in both TNFR2–/– mouse lines are relatively high, compared to TNFR1/2+/+ × JAK2+/+ and JAK2+/VF mice. Nevertheless, neither TNFR1 nor TNFR2 knock-out induced significant differences among the JAK2+/+ and the JAK2+/VF strains, respectively.
As megakaryocytes (Mk) are the sole source of platelets, we analyzed Mk numbers in the BM of the different mouse lines. TNFR1/2+/+ × JAK2+/VF mice exhibited a higher number of Mks than TNFR1/2+/+ × JAK2+/+ mice (13.2 Mks/field versus 9.3 Mks/field) (Figure 2C). Along this line, it has been shown that a decreased PLT count due to increased platelet consumption may lead to Mk increase in the BM to compensate thrombocytopenia.17 Highest Mk counts were found in TNFR1-knock-out mice independent of JAK2-V617F expression (TNFR1–/– × JAK2+/VF: 17.8 Mks/field; TNFR1–/– × JAK2+/+: 17.6 Mks/field) compared to TNFR1/2+/+ and TNFR2–/– strains. Mk count was nearly identical in TNFR2–/– × JAK2+/VF (13.2 Mks/field) and TNFR2–/– × JAK2+/+ mice (13.3 Mks/field), although PLT count was found decreased in TNFR2–/– × JAK2+/VF mice. Overall, these data suggest, that TNFα-TNFR1 signaling is involved in formation of a decreased PLT count in MPN without major effects on TPO levels or megakaryocyte numbers when comparing TNFR1/2+/+ × JAK2+/VF with TNFR1–/– × JAK2+/VF mice (Figure 2).8, 13 Furthermore, our data is in line with the described compensation mechanism in thrombocytopenia, which leads to increased Mk numbers in TNFR1/2+/+ × JAK2+/VF mice compared to their JAK2-WT counterpart.17 TNFR2–/– mice did not show apparent changes of Mk numbers. This might be due to the higher PLT counts of TNFR2–/– × JAK2+/VF mice as compared to TNFR1/2+/+ × JAK2+/VF mice.

Platelet and megakaryocyte expression is differently regulated in TNFR1/2+/+ × JAK2+/VF, TNFR1–/– × JAK2+/VF and TNFR2–/– × JAK2+/VF mice and their matching JAK2+/+ control mice. (A) PLT count in TNFR1/2+/+ × JAK2+/+ (n = 14), TNFR1/2+/+ × JAK2+/VF (n = 13), TNFR1–/– × JAK2+/+ (n = 8), TNFR1–/– × JAK2+/VF (n = 6), TNFR2–/– × JAK2+/+ mice (n = 4), and TNFR2–/– × JAK2+/VF mice (n = 3). PLT count of TNFR1/2+/+ × JAK2+/+ and TNFR1/2+/+ × JAK2+/VF mice have already been described in a previous publication from our group and were used as internal controls.9 (B) TPO concentration in the serum of TNFR1/2+/+ × JAK2+/+ (n = 5), TNFR1/2+/+ × JAK2+/VF (n = 4), TNFR1–/– × JAK2+/+ (n = 3), TNFR1–/– × JAK2+/VF (n = 6), TNFR2–/– × JAK2+/+ mice (n = 2), and TNFR2–/– × JAK2+/VF mice (n = 3). (C) Megakaryocyte number per field from TNFR1/2+/+ × JAK2+/+ (n = 3), TNFR1/2+/+ × JAK2+/VF (n = 3), TNFR1–/– × JAK2+/+ (n = 2), TNFR1–/– × JAK2+/VF (n = 6), TNFR2–/– × JAK2+/+ mice (n = 4), and TNFR2–/– × JAK2+/VF mice (n = 3); magnification for analysis = 200×. (D) Representative images of H&E stains of bone marrow sections from TNFR1/2+/+ × JAK2+/+ (n = 3), TNFR1/2+/+ × JAK2+/VF (n = 3), TNFR1–/– × JAK2+/+ (n = 2), TNFR1–/– × JAK2+/VF (n = 6), TNFR2–/– × JAK2+/+ mice (n = 4), and TNFR2–/– × JAK2+/VF mice (n = 3); magnification = 400×; size bar = 50 µm.
We also investigated numbers of hematopoietic stem and progenitor cells. These were largely not affected upon TNFR1- or TNFR2-knock-out in BM and spleen of the JAK2+/VF mice (Suppl. Figure S3 and data not shown).
To study potential changes in the inflammatory serum cytokine signature of JAK2+/VF mice upon TNFR1/2 knock-out, cytokine concentrations in the serum of TNFR1/2+/+ × JAK2+/VF, TNFR1–/– × JAK2+/VF, and TNFR2–/– × JAK2+/VF mice were analyzed (Suppl. Table S1 and Suppl. Figure S2). As previously published by our group, TNFR1/2+/+ × JAK2+/VF displayed strongly increased proinflammatory cytokine levels as compared to TNFR1/2+/+ × JAK2+/+ mice.9 However, the JAK2+/VF knock-in mice used in our study did not show abnormal TNFα serum levels, similar to previous findings by Lai et al.5 Apparently, upon specific knock-out of TNFR1 and TNFR2, the inflammatory cytokine pattern was hardly changed (Suppl. Table S1 and Suppl. Figure S2). Most likely, there is intrauterine compensation of TNFR1 and TNFR2 signals lost in MPN cells via other inflammatory cytokines to maintain chronic inflammation. Genetic compensation in response to gene knock-out is a widespread phenomenon known to be active in mouse models of MPN3, 18 and of other diseases.19 In addition, the MPN model used in this study develops a severe PV-like disease.11 Severe disease, induced by the JAK2-V617F mutation in the knock-in model, may pathophysiologically compensate for the loss of TNFα receptors. TNFα serum levels were increased in both TNFR1/R2 knock-out mice, most probably to compensate the lack of TNFR1 and TNFR2, respectively. In the analysis of BM lavages, there were no major changes in cytokine levels of TNFR1–/– × JAK2+/VF or TNFR2–/– × JAK2+/VF mice, compared to TNFR1/2+/+ × JAK2+/VF mice (Suppl. Table S2 and Suppl. Figure S4). Here, TNFα concentrations were below detection limit in all analyzed strains.
In summary, our data indicate that intact TNFR1 and TNFR2 signaling, respectively is not a prerequisite for initiation and development of PV-like features in the JAK2+/VF knock-in model. Nonetheless, disease initiation in a human MPN patient results when a single JAK2V617F HSC gains a selective advantage and expands. This could not be recapitulated using this knock-in mouse model. However, TNFR1 and TNFR2 appear to be involved in the regulation of the WBC count. In comparison to TNFR1/2+/+ × JAK2+/+ mice, PLT counts were similarly upregulated in TNFR1–/– × JAK2+/+ and TNFR2–/– × JAK2+/+ mice, yet the decrease in PLT count observed in TNFR1/2+/+ × JAK2+/VF was not observed in TNFR1–/– × JAK2+/VF mice. Remarkably, the excessive proinflammatory cytokine signature in serum of TNFR1/2+/+ × JAK2+/VF mice was hardly changed upon TNFR1 and TNFR2 knock-out, respectively. We hypothesize that this is likely due to intrauterine compensation of TNFR1 and TNFR2 signaling in MPN cells.
ACKNOWLEDGMENTS
We like to thank our technical assistants Stephanie Adam-Frey, Corinna Fahldieck, and Anja Sammt for their excellent technical support and animal welfare. We thank Dr. Radek Skoda and Dr. Jan Stetka, University of Basel, Switzerland, for advice and discussions on an earlier version of this article.
AUTHOR CONTRIBUTION
PM, CKB, EC, TRH, and MB performed experiments and analyzed data. CKB, EC, and TRH contributed to writing of the article. VB, DM, and BS contributed to the design and to writing of the article. PM and TF designed research, analyzed data, and wrote the article.
DISCLOSURES
The authors declare no conflict of interest.
SOURCES OF FUNDING
This project was funded by grants from the DFG (SFB854, project A20 to TF), from the European Union and the State of Saxony-Anhalt Germany (EFRE-European Fond for Regional Development) (AiA: PhytoHäm, 2019-21, to TF) and from the BMBF (e:Bio JAK-Sys to TF) as well as funds by the State of Saxony-Anhalt to BS (SI-2 and SI-3).


