Taxing Food and Beverages: Theory, Evidence, and Policy
Yuqing Zheng is Research Economist in Food and Nutrition Policy Research Program at RTI International; Edward W. McLaughlin and Harry M. Kaiser are Robert G. Tobin Professor of Marketing and Gellert Family Professor in the Dyson School of Applied Economics and Management at Cornell University, respectively. The authors thank Henry W. Kinnucan, Jura Liaukonyte, Kristen Park, the editor (Brian Roe), and two anonymous reviewers of this journal for helpful comments and suggestions. We also thank two undergraduate students at the Dyson School of Applied Economics and Management of Cornell University, for conducting the surveys at three chain grocery stores. Any remaining errors are the authors'.
Abstract
We developed a theoretical framework to examine the effect of a change in sales or excise tax on food and beverage demand after considering that consumers may have imperfect tax knowledge, are sometimes inattentive to sales tax, may not be informed of a sales tax change, and pay no sales tax on eligible food or beverages if using food stamps. We conducted simulations to assess how much the sales tax elasticity of demand should be adjusted downward from the price elasticity of demand and quantified the advantage of using an excise tax as an anti-obesity policy.
Many U.S. states levy taxes on food or beverages. Fourteen states apply sales taxes to general food products (purchased in grocery stores and other retailers), thirty-two states apply sales taxes to soft drinks, and eight states apply excise taxes to soft drinks (table 1). Particularly during difficult economic times, many cities and states impose or raise the tax rates on food and/or beverages as a means to raise additional governmental revenues. More recently, many states and municipalities have proposed an obesity tax (also known as a “fat tax” or “sin tax”), levied on foods and beverages that are highly caloric or perceived in other ways to be unhealthful, in the form of a higher sales tax rate or an additional excise tax, to fight the obesity epidemic.
| Sales Tax on | Sales Tax on | Excise Tax on | Sales Tax on | Sales Tax on | Excise Tax on | ||||
|---|---|---|---|---|---|---|---|---|---|
| State | Nonfood | Food | Soft Drinks | Soft Drinks | State | Nonfood | Food | Soft Drinks | Soft Drinks |
| Alabamab,d | Y | Y | Y | Y | Montana | ||||
| Alaska | Nebraskaa,c | Y | |||||||
| Arizonaa,c | Y | Nevadaa,c | Y | ||||||
| Arkansasb | Y | Y | Y | Y | New Hampshire | ||||
| Californiaa,d | Y | Y | New Jerseya,d | Y | Y | ||||
| Coloradoa,c | Y | New Mexicoa,c | Y | ||||||
| Connecticuta,d | Y | Y | New Yorka,d | Y | Y | ||||
| Delaware | North Carolinaa,d | Y | Y | ||||||
| District of Columbiaa,c | Y | North Dakotaa,d | Y | Y | |||||
| Floridaa,d | Y | Y | Ohioa,d | Y | Y | ||||
| Georgiaa,c | Y | Oklahomab,d | Y | Y | Y | ||||
| Hawaii | Y | Y | Y | Oregon | |||||
| Idahob,d | Y | Y | Y | Pennsylvaniaa,d | Y | Y | |||
| Illinoisb,d | Y | Y | Y | Rhode Islanda | Y | Y | Y | ||
| Indianaa,d | Y | Y | South Carolinaa,c | Y | |||||
| Iowaa,d | Y | Y | South Dakotab,d | Y | Y | Y | |||
| Kansasb,d | Y | Y | Y | Tennesseeb | Y | Y | Y | Y | |
| Kentuckya,d | Y | Y | Texasa,d | Y | Y | ||||
| Louisianaa,c | Y | Utahb,d | Y | Y | Y | ||||
| Mainea,d | Y | Y | Vermonta,c | Y | |||||
| Marylanda,d | Y | Y | Virginiab | Y | Y | Y | Y | ||
| Massachusettsa,c | Y | Washingtona | Y | Y | Y | ||||
| Michigana,c | Y | West Virginiab | Y | Y | Y | Y | |||
| Minnesotaa,d | Y | Y | Wisconsina,d | Y | Y | ||||
| Mississippib,d | Y | Y | Y | Wyominga,c | Y | ||||
| Missourib,d | Y | Y | Y | ||||||
- a Note: Y=Yes. The superscripts denote which one(s) of the four scenarios analyzed later a state fits. The scenarios a, b, c, and d are, respectively, a sales tax imposition, a sales tax increase (from a prior sales tax), an excise tax imposition without a prior sales tax, and an excise tax imposition on top of a sales tax. Data are effective for 2009. Data sources: 31 and 28, table 1.
The fundamental difference between the two taxes is how they are imposed. A sales tax is added at the register and is not reflected in the shelf price. An excise tax, imposed at the production/distribution stage (i.e., manufacturers, bottlers, wholesalers, retailers, and distributors) and included in the shelf price, tends to shift fully to consumers (11; 20). Therefore, a consumer's knowledge of the tax status should have a more profound impact on how sales tax influences demand than on how excise tax influences demand. Consider a state that decides to impose a sales tax on food. If a consumer mistakenly perceives that there is already a sales tax on food, such a tax imposition is not likely to have much effect on this consumer. The overall goal of this study, accordingly, is to examine the impact of a change in sales or excise tax on consumer demand for food and beverages, while allowing consumers to have imperfect knowledge of the tax status of food and beverages (henceforth imperfect tax knowledge).
The main reason for imperfect tax knowledge is that shelf prices do not specify sales taxes. Furthermore, the myriad often conflicting sales tax codes across and even within states contribute to imperfect tax knowledge. For example, cookies and candies are often perceived as similar (high-sugar) food products; thus, consumers might reasonably conclude that both would be similarly taxed or exempted from taxes. However, California exempts both, Alabama taxes both, and in New York State, cookies are exempt from state sales tax but candies are not. People moving between New York State and California may display considerable inaccuracy in knowledge of the appropriate tax status on such products. Such confusion could be multiplied many times over in a highly itinerant society moving ever more frequently around the United States, particularly with so many conflicting state and local tax codes.
To achieve our goal, we developed a theoretical framework to examine the effect of a change in sales or excise tax on food and beverage demand after taking into consideration four factors: consumers may have imperfect tax knowledge, are sometimes inattentive to sales tax, may not be informed of a sales tax change, and pay no sales tax on eligible food or beverages if using the U.S. Department of Agriculture's (USDA) Supplemental Nutrition Assistance Program (SNAP) benefits. Although we focus on the first factor, we account for the last three because ignoring these tends to bias upward the elasticity of demand with respect to the sales tax. For example, 7, henceforth CLK) demonstrate using two sets of data—a field experiment in a grocery store on toiletry products and observational data on alcohol sales—that consumers underreact to sales taxes because a sales tax is not salient to many consumers. They argued that this occurs because customers know what is taxed but focus on the posted price when shopping. The third factor would further reduce the effect of a sales tax change because a consumer simply may not be informed of a tax change. As to the last factor, a change in sales tax is likely to have little effect on the consumers who rely on SNAP benefits to buy food and beverages because these purchases are not subject to the tax and the higher price. However, all consumers, whether or not they receive SNAP benefits, are affected by an excise tax change.
As noted by CLK, an agent's full optimization with respect to tax policies is a central assumption in public economics. However, the behavioral economics literature provides a refutable basis for apparent suboptimization (e.g., a physiological limitation, costly information acquisition, or processing costs [10]). More recently, 12 argued that individuals can deviate from the standard optimization model in three respects—-nonstandard preferences (e.g., time inconsistency), nonstandard beliefs (e.g., overconfidence), and nonstandard decision making (e.g., underweighting or overweighting of information). In particular, CLK examined how underweighting tax information because of inattention leads to suboptimization of shopping behavior. In this study, we focus on examining how underweighting or overweighting tax information because of imperfect tax knowledge leads to suboptimization of shopping behavior.
We also conducted a survey of 483 shoppers at three chain grocery stores in New York State and used the data to identify the degree of incorrect tax knowledge among consumers and to determine what factors affect tax knowledge. Survey results for a variety of food and beverages reveal that 35% of shoppers perceive a tax on certain food and beverages that are actually tax-exempt; conversely, 23% of shoppers perceive no tax on certain other food and beverages that are actually taxable. Such results provide evidence that a sizable proportion of consumers have incorrect knowledge of the true tax status of food and beverages.
We used the parameters obtained from the survey to simulate changes in tax policy with the theoretical model. Important policy implications follow from our survey results and subsequent simulation analysis. For example, demand simulations that assume equal tax and own-price elasticities of demand tend to bias the effect of a sales tax change to a large degree and, therefore, should be interpreted with caution. As U.S. nutritionists and public policy makers wrestle with whether certain tax policies might contribute to ameliorating the growing obesity epidemic, our study suggests that an additional excise tax on unhealthful food or beverages is much more effective than a sales tax increase. Because many states and municipalities are currently considering either increasing the sales tax or imposing an excise tax on certain food and beverages, especially soft drinks, our results are particularly timely. Overall, we provide a method to compare the relative effectiveness of the two commonly used taxes under imperfect tax knowledge.
The Tax Learning Environment for Consumers
We have discussed the cause of imperfect tax knowledge. One might wonder then, if learning is relatively costless, why can't consumers improve their tax knowledge through learning? The main obstacle to such learning is that the actual tax learning environment is far from ideal, making learning more costly that one might expect. In an ideal tax learning environment, a consumer should be able to learn the current and changing tax levels from sufficient media coverage on a proposed or actual tax change and, more important, from grocery shopping.
Consider the sales tax, for example. There may be considerable media coverage on a proposed or actual tax change. For example, Idaho increased its sales tax by 20% in 2006. Before the tax change, an article in a local newspaper, Boise Weekly, focused on the incoming sales tax increase (24). Meanwhile, the article mentioned that “Idaho is one of only 11 states in the nation that applies the full state sales tax amount on groceries.” Therefore, a consumer uninformed of the tax status on groceries in Idaho became informed after reading such an articles. Similarly, residents uninformed of the tax status in Phoenix, Arizona, became informed after coming across the article “Phoenix Extends Sales Tax to Food Items” appearing in Phoenix Business Journal (30).
Because sales tax is imposed at the register, the primary method for consumers to learn tax information is believed to be the receipt obtained immediately after a shopping trip. However, after conducting a shopping experiment in one city in upstate New York and another city in North Carolina, we found that not all retailers included in the experiment communicate tax status information clearly on the receipt. In fact, most of them do not. In this experiment, we bought a bottle of milk and a bottle (or a package) of soda on one receipt from the major national and regional grocery/supermarket chain stores and specialty chain stores in the two cities. The scanned images of the receipts are available in a supplementary appendix online and are summarized in table 2.
| How the Store Communicates Tax Status on Receipts | |||||
|---|---|---|---|---|---|
| Displays Code Following Each Product to Indicate Tax Status | Does Not Use Code to Indicate Tax Status | ||||
| Coding (Exempt vs. Taxable) | Pattern 1: Explains What the Code Stands For | Pattern 2: Does Not Explain What the Code Stands For (Vague to Consumers) | Pattern 3: Display Tax Amounts for Exempt and Taxable | Pattern 4: Combine Tax Amounts for Exempt and Taxable | |
| National chains in upstate New York | |||||
| Aldi | 1 vs. 2 | Yes | |||
| Target | N vs. T | Yes | |||
| Walmart | O vs. X | Yes | |||
| Regional chains in upstate New York | |||||
| Tops | No code | Yes | |||
| Wegmans | No code | Yes | |||
| National chains in North Carolina | |||||
| Aldi | 3 vs. 2 | Yes | |||
| Target | C vs. T | Yes | |||
| Sam's Club | R vs. T | Yes | |||
| Walmart | Y vs. X | Yes | |||
| Kroger | No code | Yes | |||
| Regional and specialty Chains in North Carolina | |||||
| Trader Joe's | T vs. blank | Yes | |||
| Food Lion | No code | Yes | |||
| Harris Teeter | No code | Yes | |||
| Lowes Foods | No code | Yes | |||
| Whole Foods | No code | Yes | |||
| Tax learning environment for consumers | Easy and intuitive | Difficult, but possible to learn especially when only one or two items are purchased | Impossible to learn | ||
In both cities, milk is exempt from the state sales tax, but soda is not. In the city in North Carolina, groceries are subject to a 2% local sales tax. We found that stores adopt four patterns to communicate tax information. First, stores such as Aldi and Target clearly code what item is taxable vs. exempt and explain what the internal code stands for. For example, in New York State, Aldi puts F1 and F2 immediately after the prices of milk and soda and then inserts “2—Taxable @ 8%” and “1—Taxable @ 0%” before the individual tax amount in the subtotal section of the receipt. This type of communication pattern provides an easy and intuitive tax learning environment. Second, some stores code what item is taxable vs. exempt but offer no explanation as to what the internal code stands for. For example in New York State, Walmart puts O and X immediately after the prices of milk and soda and then inserts “Tax 1 8%” before the tax amount in the subtotal section of the receipt. Therefore, it is difficult for consumers to figure out the tax status unless they purchase one or two items at a time.
Third, some stores (e.g., Food Lion) do not use any code to indicate tax status at all but display aggregate tax amounts for exempt and taxable items, respectively. Therefore, the second and third price coding patterns make it difficult to learn about taxes. In such an environment, it is almost impossible for consumers to learn tax knowledge especially if multiple items are purchased at once. Finally, some stores (e.g., Kroger, Wegmans, and Whole Foods) do not use a code to indicate tax status or display the individual tax amount for exempt and taxable items. In these circumstances, it is virtually impossible for consumers to learn any tax information at all from past purchases. Overall, we found in our experiment that many retailers do not communicate tax status information clearly on receipts, making tax learning more difficult than one might expect.
With respect to excise taxes, the tax learning environment is worse because neither the store shelf nor the receipt contains excise tax information. However, because the excise tax is reflected in the shelf price, knowledge of excise taxes should not affect how an excise tax influences demand; therefore, we ignored it in this study.
A Simple Theory of Taxing Food and Beverages
In this section, we develop a framework to examine the effect of a change in sales or excise tax on the demand for food and beverages. Imperfect knowledge of sales tax is allowed in this case. “Imperfect tax knowledge” in this study refers to one of two conditions: first, when a consumer perceives a sales tax when, in reality, there is no sales tax, or, second, when a consumer perceives there is no sales tax when, in reality, there is a sales tax. These are the two most common misperceptions as identified from our sales tax survey.1 We first derive the most general model and then analyze four scenarios from the model that depend on the nature of a tax change (sales tax vs. excise tax) and whether a sales tax on food and beverages exists before the tax change.
Let τ′ denote the sales tax rate in a state before a tax change occurs. Depending on whether a sales tax on food and beverages exists before the tax change, τ′ has different meanings: τ′ is the sales tax rate on nonfood items in the case of a tax imposition and is the sales tax rate on food and beverages in the case of a tax increase from a prior one. As figure 1 indicates, we first divided all consumers into those who rely on SNAP to buy food and beverages and those who do not. Because food and beverages purchased with SNAP benefits are exempt from sales taxes, in this section we assumed SNAP users are not affected by a sales tax increase for ease of generalization. Let the proportion of non-SNAP users among all consumers be NS.2 Among non-SNAP users are consumers who know the correct tax status on food and beverages and those who misperceive the actual tax status. Let the proportions of these two categories of consumers be K1 and K0, respectively, where the subscript 1 (0) stands for a consumer's correct (wrong) perception of the tax status before the change in tax policy. These two variables measure consumers' state of tax knowledge before the tax change.

Consumers' perception of tax status before and after a tax change
Note: The 0 in the subscript stands for a consumer's wrong perception of the actual tax status. The 1 in the subscript stands for a consumer's correct perception of the actual tax status. Consumers in the highlighted area are those affected by a tax increase in the case of a sales tax change.
Assume that now the state government makes a change in tax so that the new tax rate is τ′′. Such a tax change can be a change in sales tax or imposition of an excise tax. Therefore, we express the price that includes an excise tax in the percentage-base form as well, p(1+τ′′), which is a procedure commonly used in the literature (e.g., 17, 18). Now we have four types of consumers given their tax knowledge before and after the tax change. We denote the consumers who knew the correct tax status of food and beverages before the tax change and stay informed of the tax change afterward as “always-informed” consumers; the consumers who knew the correct tax status but do not update their tax knowledge afterward as “informed-uninformed” consumers; the consumers who misperceived the actual tax status but become informed of the tax change afterward as “uninformed-informed” consumers; and those who misperceived the actual tax status and do not stay informed of the tax change afterward as “always-uninformed.” The proportions of the four types of consumers are denoted as K1,1, K1,0, K0,1, and K0,0, respectively, where, for example, the subscript of K1,0 indicates a consumer's correct perception of the tax status before the change in tax policy and wrong perception of the tax status after the change in tax policy.
Let I1 be the proportion of non-SNAP consumers with correct tax knowledge who are informed of the tax change and I0 be the proportion of non-SNAP consumers with incorrect tax knowledge who are informed of the tax change. These two parameters can link media exposure to the rate of learning at the time of the policy change. It is straightforward from figure 1 that K1I1=K1,1, K0I0=K0,1, K1+K0=1, and K1,1+K1,0+K0,1+K0,0=1 hold. Table 3 provides a detailed list, definitions, values, and sources of the parameters used in this study, which are all between zero and one.
| Parameters | Definition | Value | Source |
|---|---|---|---|
| N S | Proportion of non-SNAP users, denoted as SNAP parameter | 0.86 | Public source |
| K 1, K0, K1,1, K1,0, K0,1, and K0,0 | The knowledge levels of consumers about tax status before and after a tax change, denoted as the knowledge parameters | Various | Our survey |
| I 1 and I0 | The degree to which consumers are informed of the tax change, denoted as the information parameters | Various | Our survey |
| θ | The degree of underreaction to tax for consumers given that they perceive a sales tax | Various | 7 |
| τ′ | Sales tax rate (on food and beverage for scenarios b and d and on nonfood items for scenarios a and c) before a tax change | 0.068 | Public source |
| τ′′ | New tax rate on food and beverages after a tax change | Various | NA |
| L | The annual learning rate for consumers who have incorrect tax knowledge | 0.0031 | Our survey |
| F | The proportion of food purchases made by SNAP participants that is not covered by the benefits and, hence, subject to taxation | 0.33 | Public source |
Our model setting reflects a situation in which a policy announcement may impact the information and learning environment, whereas learning and information sharing may be stagnant (in the base model developed here) or slow (in the extended framework developed in the next section) in the absence of changes in policy. Previously uninformed individuals might pick up on new information (i.e., I0 is not necessarily zero), while previously informed individuals could fail to hear or detect the changes (i.e., I1 is not necessarily one). However, we restrict I1>I0 in this study because we expect that consumers with incorrect tax knowledge are less likely to stay informed of a tax change than those with correct tax knowledge.
 (1)
(1) (2)
(2) (3)
(3) ,
,  ,
,  , and
, and  , are derived similarly. For example, replacing V1(τ′) and V1,1(τ′′) in equation (3) with V0(τ′) and V0,1(τ′′), respectively, yields
  . The total demand from all consumers is
 (4)
(4) (5)
(5) can be expressed as NSK1I1. Plugging the expressions for
  through
  into equation (5) yields the impact of the tax change on the demand for food and beverages as
 (6)
(6) (7)
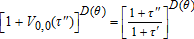
(7)Scenario A: A Sales Tax Imposition
Consider a state that has a sales tax τ′ but exempts food from the tax. Suppose the state subsequently decides to levy a sales tax on food. Indeed, thirty-two states (e.g., New York State) fit this situation (states with a superscript a in table 1 conform to this case). The analysis in this subsection addresses a hypothetical question: what are the effects on demand if New York decides to impose a sales tax of, say, 4% on food?
 , we obtain the ratio of the tax elasticity of demand to the price elasticity of demand (the ratio henceforth):
 (8)
(8) and K1I1+K0I0 are less than one, equation (7) is always less than one. Accordingly:
Proposition 1
A sales tax imposition does not reduce demand as much as a price increase of the same magnitude.
CLK argued that the underreaction to a sales tax is driven by sales tax being not salient because the median individual correctly reported the tax status of seven out of the eight products on the survey they conducted with ninety-one shoppers in California. Therefore, it is still possible that a small part of the sales reduction detected in their field experiment occurred because some consumers who misperceived a zero tax on toiletry products were informed of the sales tax on seeing the tax-inclusive price tags.
As one contribution of this study, we theoretically separated the impact of imperfect tax knowledge from the true salience effect when studying consumers' responses to a sales tax. We show in equation (7) that underreaction to a sales tax imposition could be because (1) consumers with perfect tax knowledge ignore the sales tax and (2) the de facto tax change for consumers with incorrect tax knowledge is smaller than the actual tax change. That is, a sales tax imposition only affects consumers who are informed of the tax change (highlighted in figure 1). However, for the uninformed-informed consumers, the de facto tax change is τ′′−τ′ rather than τ′′. As a result, the effect of a sales tax imposition is much smaller than that of a comparable price increase.
Scenario B: A Sales Tax Increase from a Prior Nonzero Sales Tax
In this scenario we consider a state that has an existing sales tax on all goods. There are thirteen states (states with a superscript b in table 1 conform to this case) that fit this situation, although the tax rate on food and beverages could either be the same as the other goods (e.g., Alabama) or lower (e.g., Virginia). Assume the state decides to increase its sales tax rate on food and beverages from τ′ to τ′′. Before the tax change, there are consumers who know food is taxed at the rate τ′, as well as consumers who misperceive food is not taxed at all.
 , we obtain
 (9)
(9) /
/ in equation (8) is larger than one. One might wonder if this condition will contribute to the tax elasticity of demand exceeding the price elasticity of demand, which is possible theoretically under extreme cases.4 In the policy section, we show that in normal circumstances the tax elasticity of demand is smaller than the price elasticity of demand for a sales tax increase.
Scenario C: An Excise Tax Imposition without a Prior Sales Tax
In the third scenario we consider a state that has a sales tax τ′ but exempts food and nonalcoholic beverages from the tax. Assume the state decides to levy an excise tax on soft drinks (x). Thirteen states fit this situation (states with a superscript c in table 1).
Because an excise tax is levied on the supply side, whether the supplier shifts the tax burden fully to consumers will determine the extent to which excise taxes may be superior to sales taxes in changing behavior. Empirical studies of the most common excise taxes—taxes on alcohol, cigarettes, and gasoline—generally find that they are fully shifted to consumers (DeCicca, Kenkal, and Liu 2012; Harding, Leibtag, and Lovenheim 2012). In this study, we examine an excise tax that is fully passed on to consumers because (1) we want to confine our focus to imperfect tax knowledge and inattention to tax, and (2) no study has examined the tax pass through of a soda excise tax yet (partly because a soda excise tax is a recent phenomenon and the magnitude of the taxes is very small). Unlike cigarettes, the passthrough of a soda excise tax could be less than full. For example, for popular items like two-liter sodas that might serve as a loss leader, a store's lost revenue from excise taxes might be shifted to increased prices on other goods rather than the targeted good. In that case, our results on excise tax can be overturned.5
 (10)
(10)Proposition 2
Without a prior sales tax, an excise tax imposition does not reduce demand as much as a comparable price increase as long as K 0 , θ, and I 0 are positive.
Given the restrictions from Proposition 2, it is clear that the expression in equation (9) is less than one, which proves the proposition. Proposition 2 shows that the impact of an excise tax could be attenuated due to consumers' attention to sales tax and imperfect tax knowledge. It challenges the conventional wisdom that a fully passed-through excise tax works just like a price increase. Although an excise tax imposition affects all consumers, the de facto tax increase for the uninformed-informed consumers is τ′′−τ′ rather than τ′′, exactly because this type of consumer mistakenly perceived a sales tax τ′ before the tax imposition. Three conditions have to be met for proposition 2 to hold. First, some consumers must misperceive the actual tax status of soft drinks before the tax imposition (i.e., K0>0). Our store survey provides strong evidence for this. Second, these consumers do not totally ignore the perceived sales tax when shopping (i.e., θ>0). CLK estimated that θ is greater than zero. Third, some of these consumers are informed of the sales tax status due to the policy change (I0>0). There is no readily available estimate on this information parameter. In the policy simulation section, we assign different values of the information parameter to gauge the sensitivity of our results to this parameter.
Scenario D: An Excise Tax Imposition on Top of a Sales Tax
 .6 Similar to the third subsection, we can apply to equation (6) the following restrictions: (1) V1(τ′)=τ′, V0(τ′)=0; (2)
  ,
,  , VSNAP(τ′)=0,
 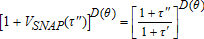 ; and (3) D(θ)=1. We obtain the ratio as follows:
 (11)
(11)Proposition 3
An excise tax imposition on top of a sales tax has a larger impact on demand than a comparable price increase as long as K 0 , θ, and I 0 are positive.
Proposition 3 suggests that consumers' attention to sales tax and imperfect tax knowledge strengthens the impact of an excise tax imposition on top of a sales tax. Therefore, the overall conclusion we can draw from this section is that when no prior sales tax exists, misperception of the correct tax status tends to attenuate the impact of a tax change; when a prior sales tax exists, misperception of the correct tax status tends to strengthen the impact of a tax change.
Finally, we compare the effects of a sales tax and excise tax, given the same values for the parameters. It can be easily shown that equation (9) is greater than equation (7), and equation (10) is greater than equation (8) by making use of K1I1+K0I0<1. This leads to proposition 4.
Proposition 4
A sales tax change does not reduce demand as much as an excise tax change of the same magnitude.
The underlying reason behind proposition 4 is straightforward. A sales tax change only affects consumers who stay informed of the tax change, whereas an excise tax change affects SNAP users and all four types of non-SNAP users because the excise tax is embedded in the shelf price.
An Extended Model that Accommodates Learning
The foregoing base framework made three simplifying assumptions to make results more generalizable. In this section, we develop an extended model that relaxes all three assumptions. First, the framework is a static model. In the supplementary appendix, we present a modified figure 1 for an extended model in which consumers who did not learn the tax status at the time of the policy change will be able to learn correct tax knowledge at a yearly rate of L. Therefore, consumers can learn tax knowledge from their past purchases or over time. Second, the extended model relaxes the assumption that SNAP users do not pay sales taxes on food and beverages. This is because the SNAP benefits are not intended to cover all of a family's food costs and do not include food purchased at restaurants. For example, we find that about 33% of food purchased by New York State SNAP participants is not covered by the benefits and, hence, is subject to taxation.7 This proportion is denoted as F (see table 3). Finally, the extended model also relaxes the assumption that SNAP users do not make mistakes on taxes because our survey indicates they do.
Overall, compared with the base framework, the extended framework has an extra layer on the right side that reflects learning over time. For the case of a sales tax imposition, SNAP users are divided into three categories, depending on their tax knowledge: those who know food and SNAP purchases are not taxed (K1 proportion), those who misperceive food is taxed but know SNAP purchases are not (K0/2 proportion), and those who misperceive that food and SNAP purchases are taxed (K0/2 proportion).8 Again, those highlighted boxes in the last two layers of the figure are consumers who become informed for the case of a sales tax change. For the extended framework, the ratios of the tax elasticity of demand to the price elasticity of demand are derived according to the formulas reported in the online appendix.
A Grocery Store Survey on Consumers' Tax Knowledge
To gauge shoppers' levels of food and beverage tax knowledge, we conducted a survey at the entryway of three chain grocery stores in upstate New York. In addition to tax knowledge, we also collected additional demographic information on shoppers. Therefore, we were able to further examine what factors determine a consumer's tax knowledge. The three stores were selected to be in three distinct demographic areas by income: an upscale suburb, a middle-income smaller city, and a lower income rural store. Two trained undergraduate students conducted the survey by greeting shoppers with a $5 store gift card immediately redeemable on completion of the survey. A total of 483 shoppers completed the survey (the online appendix contains the survey). We selected a dozen commonly purchased food and beverage items, covering dairy products, alcoholic and nonalcoholic beverages, fresh produce and meat, and sugary products. CLK conducted a similar survey in California on beer, cigarettes, cookies, magazines, milk, potatoes, soft drinks, and toothpaste. Compared with the CLK survey, our sample size is five times larger and covers more food and beverage products.
Evidence of Imperfect Tax Knowledge
Three patterns emerge from our survey results (table 4). First, on average, fully one-third of all consumers did not know the correct tax status of food and beverages. Four of the twelve products selected are taxable in New York State: beer, bottled water, candy, and soft drinks. The fraction incorrectly reporting tax status (i.e., K0) was 12% for beer, 34% for bottled water, 24% for candy, 28% for cheese, 53% for cookies, 24% for fresh fruit, 27% for fresh meat, 24% for fresh vegetables, 51% for ice cream, 27% for milk, 22% for soft drinks, and 43% for sugar. The overall mean for all products is 31%. A binomial test was conducted for the null hypothesis that the fraction incorrectly reporting tax status is zero. We reject the null hypothesis for each of the twelve products at the 1% significance level. Such results provide strong evidence for the existence of imperfect tax knowledge among consumers, even for the top two best-selling grocery items by sales revenue—soft drinks and milk (3).
| Food/Beverage Product | No. of Responses | Actual Tax Status (1= Taxable, 0=exempt) | Fraction Correctly Reporting Tax Status (K1) | Standard Deviation | K 0 |
|---|---|---|---|---|---|
| Beer | 480 | 1 | 0.88 | 0.33 | 0.12 |
| Bottled water | 480 | 1 | 0.66 | 0.47 | 0.34 |
| Candy | 481 | 1 | 0.76 | 0.43 | 0.24 |
| Cheese | 479 | 0 | 0.72 | 0.45 | 0.28 |
| Cookies | 479 | 0 | 0.47 | 0.50 | 0.53 |
| Fresh fruit | 479 | 0 | 0.76 | 0.43 | 0.24 |
| Fresh meat | 479 | 0 | 0.73 | 0.44 | 0.27 |
| Fresh vegetables | 478 | 0 | 0.76 | 0.43 | 0.24 |
| Ice cream | 477 | 0 | 0.49 | 0.50 | 0.51 |
| Milk | 478 | 0 | 0.73 | 0.45 | 0.27 |
| Soft drinks | 477 | 1 | 0.78 | 0.42 | 0.22 |
| Sugar | 476 | 0 | 0.57 | 0.50 | 0.43 |
| Mean | 479 | — | 0.69 | 0.44 | 0.31 |
Second, shoppers seem to have better knowledge of the tax status of alcoholic beverages than of nonalcoholic beverages, perhaps because consumers tend to believe “sin” products are taxed. Another possible reason is that because the prices of alcoholic beverages are higher, sales taxes on them are more likely to be noticed. Third, although many consumers report incorrect tax status on food and beverages, they have good knowledge of the actual sales tax rate. In our survey, we asked, “What is the sales tax rate in your city?” The correct answer is 8% (state and local tax combined). The mean answer we obtained was 7.63%, with the median being 8%. Hence, consumers make many more errors estimating the tax status on food and beverages than on estimating the sales tax rate. This result also provides justification for our model, which assumes that consumers have good knowledge of the actual sales tax rate.
A Probit Analysis of the Survey
To examine what factors determine a consumer's tax knowledge, we make use of our demographic data to estimate a probit model of sales tax knowledge for each item (1=correct) as a function of sex (base=male), age, education (base=high school), income level (base <$30,000), purchase history of the same item in the past month (base=zero purchase), and years of residence in New York State.
The probit estimation results are reported in table 5. We find that higher income or education does not seem to indicate systematically better sales tax knowledge. For example, we find that consumers with income below $30,000 have better tax knowledge for bottled water and soft drinks, but worse tax knowledge than consumers with income higher than $75,000 for a few other items. That is, consumers more likely to be SNAP-eligible do not necessarily have better knowledge of sales taxes, providing further justification for the extended model.
| Dependent Variable: Tax Knowledge in One of the Following 12 items (1=correct, 0=incorrect) | ||||||||||||
|---|---|---|---|---|---|---|---|---|---|---|---|---|
| Beer | Bottled Water | Candy | Cheese | Cookies | Fresh Fruit | Fresh Meat | Fresh Vegetables | Ice Cream | Milk | Soft Drinks | Sugar | |
| Female | 0.11 | 0.19 | 0.13 | 0.01 | −0.17 | −0.03 | 0.03 | 0.04 | −0.03 | 0.05 | 0.27* | 0.03 |
| (0.17) | (0.13) | (0.14) | (0.14) | (0.13) | (0.15) | (0.14) | (0.14) | (0.13) | (0.14) | (0.14) | (0.13) | |
| Age | 0.004 | 0.01 | −0.01 | 0.003 | 0.01* | −0.002 | 0.01 | 0.003 | 0.02*** | 0.01* | −0.02** | 0.02*** |
| (0.01) | (0.01) | (0.01) | (0.01) | (0.01) | (0.01) | (0.01) | (0.01) | (0.01) | (0.01) | (0.01) | (0.01) | |
| College degree | −0.08 | −0.19 | −0.08 | −0.06 | −0.16 | 0.01 | 0.10 | 0.02 | −0.08 | −0.07 | −0.02 | 0.06 |
| (0.18) | (0.15) | (0.16) | (0.15) | (0.15) | (0.16) | (0.16) | (0.16) | (0.15) | (0.16) | (0.16) | (0.15) | |
| Graduate degree | 0.42* | 0.02 | 0.29 | −0.09 | −0.31* | −0.11 | −0.02 | −0.04 | −0.29* | −0.11 | 0.28 | 0.03 |
| (0.24) | (0.18) | (0.19) | (0.18) | (0.17) | (0.19) | (0.18) | (0.19) | (0.17) | (0.18) | (0.19) | (0.17) | |
| Income 30 to 75K | −0.11 | −0.31** | −0.13 | 0.14 | 0.10 | 0.08 | 0.10 | 0.06 | 0.09 | 0.19 | −0.30* | −0.19 |
| (0.19) | (0.15) | (0.16) | (0.15) | (0.15) | (0.16) | (0.16) | (0.16) | (0.15) | (0.15) | (0.16) | (0.15) | |
| Income over 75 | −0.08 | −0.44** | 0.05 | 0.46** | 0.11 | 0.40** | 0.49** | 0.36* | 0.00 | 0.35* | −0.25 | −0.13 |
| (0.25) | (0.19) | (0.20) | (0.19) | (0.18) | (0.20) | (0.20) | (0.20) | (0.18) | (0.19) | (0.20) | (0.18) | |
| Bought 1–3 in last month | 0.49*** | 0.11 | 0.07 | −0.09 | 0.04 | −0.07 | 0.25 | 0.04 | −0.06 | 0.29 | 0.11 | −0.19 |
| (0.19) | (0.15) | (0.15) | (0.22) | (0.13) | (0.29) | (0.25) | (0.32) | (0.15) | (0.23) | (0.16) | (0.13) | |
| Bought 4 or more in last month | 0.19 | −0.05 | 0.03 | 0.20 | −0.04 | 0.26 | 0.32 | 0.13 | 0.18 | 0.24 | −0.01 | −0.15 |
| (0.24) | (0.17) | (0.21) | (0.23) | (0.23) | (0.28) | (0.24) | (0.30) | (0.20) | (0.22) | (0.19) | (0.26) | |
| Years lived in New York State | 0.001 | 0.003 | 0.01** | 0.004 | 0.0004 | 0.01** | 0.003 | 0.006 | −0.004 | 0.0002 | 0.013** | −0.002 |
| (0.006) | (0.004) | (0.005) | (0.004) | (0.004) | (0.004) | (0.004) | (0.004) | (0.004) | (0.005) | (0.005) | (0.004) | |
| Observations | 445 | 444 | 445 | 443 | 443 | 443 | 443 | 442 | 442 | 442 | 443 | 441 |
- a Note: ***, **, and * denote statistical significance at the 1%, 5%, and 10% levels, respectively.
Our store survey provides an excellent platform to assess learning. We found that a consumer's frequency of purchasing an item does not lead to better tax knowledge of the item. The only exception is beer, where we found that a consumer's purchase of beer from one to three times in the past month increases the probability of the consumer having correct tax knowledge of beer by 9.4% (note: the estimates in table 5 are not marginal effects). This finding is consistent with our earlier argument that many retailers do not communicate tax information clearly on receipts. However, we found that both age and years of in-state residence improve a consumer's tax knowledge, indicating some evidence of weak learning over time. The estimated coefficient on these variables is positive and statistically significant at the 5% level in five of the twelve equations. For example, we found that one more year of in-state residence slowly increases the probability of a consumer having correct tax knowledge of candy, fresh fruit, and soft drinks by 0.3%, 0.28%, and 0.35%, respectively.
Policy Simulations and Implications
In this section, we first evaluate equations (7) through (10) for several cases by varying certain parameters. In doing so, we illustrate how the impact of a sales tax change compares with an excise tax change and how the impact of a tax change is influenced by shoppers' tax knowledge, the publicity of the tax change, and the degree of underreaction to tax. We then repeated the policy simulations to obtain the long-term effects of tax changes by analyzing the tax effects five years past the tax change and allowing consumers to learn at a rate of L=0.31% (the average of the impact of years of in-state residence identified in our survey). We also discuss implications of our study.
Policy Simulations
The two key parameters in this study are the knowledge parameters K1 and K0. For the baseline case, we choose 0.69 for K1 and 0.31 for K0, the average values of K1 and K0 identified by our survey results. The proportion of SNAP users in New York State was obtained by dividing the average monthly participation in the program in 2010 by the population of New York State in 2010.9 Subtracting one from this number yields the SNAP parameter NS of 0.86. As to the θ term, the only estimate we are aware of is CLK's estimate of 0.35 for all consumers. Because CLK report that 80% of consumers know the actual tax status of toiletry products (table 1 in CLK), we obtained the corresponding conditional estimate of θ as 0.44 (i.e., 0.35/0.8).10 We used θ=0.44 in our simulations.
An estimate on the information parameters I1 and I0 is not available. Moreover, a direct survey cannot obtain these parameters. Nevertheless, we employed the following steps to obtain an estimate. Consider cookies and candy, two closely associated products, for an illustration. From a dynamic perspective, if one views candy as cookies after a sales tax imposition, then we have K1=0.47 from the survey results on cookies and K1,0=0.24 from the survey results on candy. Making use of K1(1−I1)=K1,0 yields I1=0.51. We obtained I1=0.53 for a similar treatment of milk and bottled water. Therefore, in the baseline case, we set I1=0.50 and I0=0.40. Finally, we set τ′=6.80%, which is the average of the combined state and local sales tax rates across all states for 2011 (31).11 We set τ′′=9%, reflecting a 32% increase.
We report in table 6 the four ratios under nine cases. The left part is for the base framework and the right is for the extended framework. In the baseline case, focusing on the left part first, we found that the ratio for a sales tax imposition is only 0.14. That is, an imposition of a 10% tax reduces demand from all consumers by the same amount as a 1.4% price increase, which is consistent with proposition 1. We found that the effect of increasing a sales tax rate from a prior one is 33% of the effect of a price increase (in percentage terms). In either case, the effect of a sales tax change on demand is much smaller than a comparable price increase. The ratios for excise tax imposition without and with a prior sales tax are 0.96 (proposition 2 predicts this would be less than one) and 1.15 (proposition 3 predicts this would be greater than one), respectively. As predicted by proposition 4, the effect of an excise tax change is larger than the effect of a sales tax change of the same magnitude (i.e., numbers in column C are greater than those in column A, and numbers in column D are greater than those in column B).
| Base Framework | Extended Framework (5-Tear Effect, Learning Allowed) | |||||||
|---|---|---|---|---|---|---|---|---|
| Parameter | A | B | C | D | A | B | C | D |
| (1) Baseline case: NS=0.86, K1=0.69, K0=0.31, I1=0.5, I0=0.4, θ=0.44, τ′=6.8%, τ′′=9% | 0.14 | 0.33 | 0.96 | 1.15 | 0.15 | 0.35 | 0.96 | 1.16 |
| (2) High misperception of tax status: K1=0.30, K0=0.70 | 0.08 | 0.50+ | 0.92 | 1.34+ | 0.09 | 0.54+ | 0.91 | 1.36+ |
| (3) Low misperception of tax status: K1=0.90, K0=0.10 | 0.17+ | 0.23 | 0.99+ | 1.05 | 0.19+ | 0.25 | 0.99+ | 1.05 |
| (4) High publicity of tax change: I1=0.9, I0=0.8 | 0.26+ | 0.63+ | 0.93 | 1.30+ | 0.27+ | 0.66+ | 0.92 | 1.31+ |
| (5) Low publicity of tax change: I1=0.2, I0=0.1 | 0.05 | 0.10 | 0.99+ | 1.04 | 0.06 | 0.12 | 0.99+ | 1.04 |
| (6) High degree of under-reaction to tax: θ=0.10 | 0.03 | 0.07 | 0.99+ | 1.03 | 0.03 | 0.08 | 0.99+ | 1.04 |
| (7) Low degree of under-reaction to tax: θ=0.70 | 0.22+ | 0.52+ | 0.94 | 1.24+ | 0.24+ | 0.56+ | 0.94 | 1.25+ |
| (8) τ′′<τ′:τ′=6.8%, τ′′=5% | 0.18+ | — | 0.90 | — | 0.19+ | — | 0.89 | — |
| (9) An example: New York soft drinks τ′=8%, τ′′=18% | — | 0.22 | — | 1.04 | — | 0.24 | — | 1.04 |
- a Note: Column A: sales tax imposition; B: sales tax increase (from a prior sales tax); C: excise tax imposition without a prior sales tax; D: excise tax imposition on top of a sales tax. In the nonbaseline cases, we only list the parameters that change from the baseline case. Other parameters remain the same as those in the baseline case. The superscript + indicates an increase from the baseline case
The next six cases depict cases with high and low degrees of misperception of tax status (K0 equals 0.70 and 0.10, respectively), cases with high and low publicity of a tax change (I1=0.90, I0=0.80 for the former and I1=0.20, I0=0.10 for the latter), and high and low degrees of underreaction to a sales tax (θ equals 0.10 and 0.70, respectively). The results are twofold. First, we found that the ratios can deviate from the baseline case by a large degree except for the third scenario. For example, in the case of a high degree of underreaction to a sales tax (case 6), the ratio for a sales tax imposition decreases from 0.14 in the baseline case to 0.03. Second, the impact of the three factors is scenario-specific. For example, a higher degree of misperception of tax status attenuates the impact of a tax change without a prior sales tax but strengthens the impact of a tax change with a prior sales tax. Lower publicity of a tax change will reduce the ratios for all but the third scenario. Our findings in case 5 suggest that if the government successfully keeps a low profile on a sales tax imposition or increase on food and beverages, the reduction in demand will be very small indeed.
In some states, when food or beverages are taxed, the sales tax rate on them is lower than the tax rate on other goods. In the eighth case, we consider a situation where a state with a 6.8% sales tax on nonfood items decides to impose a 5% sales tax or equivalent excise tax on food or beverages. We find that the impact of an excise tax imposition decreases from 0.96 in the baseline case to 0.90. The impact of a sales tax imposition increases from 0.14 to 0.18.
Compared with the base framework, the ratios in the extended framework (in the right part of table 6) increase slightly except for the third scenario. The ratio slightly decreases for an excise tax imposition without a prior sales tax because allowing always-uninformed-type consumers to learn sales tax knowledge over time actually stimulates rather than reduces demand, therefore mitigating the tax effect on demand. We show that accommodating learning does not significantly alter the magnitudes of the simulation results. The change is typically around 10% or less. This is mainly because the learning rate we identified for New York residents is quite low—0.31% a year. Interested readers can apply data for other states, especially a different learning rate, to the extended framework developed in this section, given the formula provided in the online appendix.
Implications of Our Study
Our results have a variety of implications. First, studies that simulate demand change in response to a food or beverage tax should distinguish between the four most common scenarios of tax changes. Currently, many studies of this type have focused on obtaining price elasticities of demand while implicitly or explicitly assuming an equal tax and price elasticity of demand (see 22, 23, for snack foods; 8 for dairy products; 26 for high-caloric foods; 13 for fresh fruit; 28 for caloric sweetened beverages).12 We show that for the case of an excise tax (e.g., 35) or value-added tax (e.g., 1), such an assumption is likely appropriate. However, studies on sales tax with this assumption should be interpreted with caution because they tend to overestimate the impact of a sales tax change by a large degree. Our study offers a method to measure the bias.
Take all food as an example. 4 estimate that the average price elasticity of demand for food is −0.56. Multiplying these estimates by 0.14 and 0.33 in the baseline case of table 6 yields the two sales tax elasticities of demand at −0.08 and −0.21, respectively. A recent review of research on the price elasticity of demand for food (2) shows that the mean price elasticity estimates of food and beverages ranged from −0.27 to −0.81. Therefore, even a large increase in the sales tax rate on food and beverages will only reduce demand by a moderate degree. Because of the existence of imperfect tax knowledge, the effect of an excise tax imposition on top of a sales tax is always larger than that of a comparable price increase. In this case, assuming equal tax elasticity of demand and price elasticity of demand will bias the effect of the excise tax downward.
Second, our analysis of sales and excise taxes offers some explanation (e.g., imperfect tax knowledge, slow learning) on why the impact of sales tax is so difficult to detect, thus bridging the gap between the simulation studies and the empirical findings. Several recent empirical studies have suggested that an excise tax has a much more pronounced impact on the demand for soft drinks, alcoholic beverages, or cigarettes (note: cigarettes are not generally considered food or beverages), which are three typical commodities subject to both a sales tax and an excise tax in the United States. Using state-level panel data, CLK find that an excise tax, not a sales tax, affects the consumption of beer, wine, or spirits. By using state-level panel data and scanner data, respectively, 25 and 9 found no (statistically) significant associations between a sales tax increase and soft drink consumption. Using state-level cross-sectional data, 29 found no significant relationship between sales taxes on soft drinks and overall children's soft drink consumption.13 Although no study examines the individual impact of an excise tax on soft drink demand, 18 reported that when sales tax and excise tax are combined, the combined soft drink tax moderately reduces soft drink consumption by children and adolescents. Researchers on tobacco control typically ignore sales tax and have found that an excise tax reduces cigarette sales (e.g., 14). Recently, 19 found that all consumers respond to cigarette excise taxes, whereas only low-income consumers respond to sales taxes on cigarettes. In addition to CLK's explanation of salience and 16 hypothesis of optimization bias, our analysis of imperfect tax knowledge and the retailer's role in communicating tax information offers additional explanation for the foregoing empirical findings.14
Third, policy makers can use our results to weigh policy options from a quantitative or a qualitative perspective. We discuss three policy implications here. The first concerns the choice of the right tax. Government policy makers who desire to raise tax revenues by increasing/imposing the sales tax need to recognize that because of the insensitivity of changes in quantity purchased to a tax rate increase, the revenue increase will generally be much larger than the revenue increase in the case of a comparable price increase. Hence, a desirable policy option for budget-strapped governments may be to impose taxes on select food items. However, health advocates have argued for taxes on unhealthy foods and beverages to reduce consumption of such products and simultaneously raise revenue that could be used to fund obesity prevention initiatives (5; 21). In this latter case, the imposition or increase of an excise tax is much preferred to a sales tax. The government needs to be aware that by using an excise tax, the expected tax revenue increase will be largely comparable with the revenue increase of a comparable price increase.
Take New York State as a specific example. New York does not exempt soft drinks from sales tax. In 2009, then–New York governor David Paterson proposed an 18% sales tax on soft drinks and sugary drinks that contain less than 70% juice to curb obesity. Such a proposal would have effectively increased the tax in New York State from 8% to 18%. In the last row of table 6, we show that in this case the ratio is 0.22. However, if this proposal were instead made in the form of an excise tax, which also brings the total combined tax rate on soft drinks up to 18%, the ratio is 1.04. Simply shifting the policy tool from a sales tax increase to an excise tax imposition is five times more effective in reducing soft drink demand. It is perhaps not surprising that a year later, the governor proposed a modified form of the tax: a penny-per-ounce excise tax.
The second policy implication concerns excluding soft drinks from SNAP benefits. Many public health advocates and state governments have proposed a policy change that excludes soft drinks (especially sweetened beverages) purchases from SNAP benefits, with no success. Such a policy change will effectively raise the SNAP parameter NS for soft drinks to one, which could be good news for policy makers. If soft drinks were excluded, we should expect that a soft drink tax will have a more pronounced impact in reducing soft drink demand for three of the four scenarios of tax changes, according to equations (7) through (10). The exception is the scenario of excise tax imposition without a prior sales tax.
The final policy implication regards the possible adoption of tax-inclusive shelf pricing. The United States and Canada are the only two countries within the Organisation for Economic Co-operation and Development (OECD) that have a policy where most sales taxes are added at the register (27). All other OECD countries (e.g., United Kingdom) use tax-inclusive shelf pricing where the sales tax is included as part of the shelf price. Canadian researchers (e.g., 27) have called for a transition of Canadian sales tax into tax-inclusive shelf pricing, although such a call is much less commonly seen in the United States.
If a U.S. state were to adopt tax-inclusive shelf pricing, issues with nonsalience of tax and imperfect tax knowledge will be circumvented for non-SNAP users. A tax change will function just like a price change for them. However, for SNAP users, the issue of imperfect tax knowledge remains, and a counterpart issue of nonsalience might arise. Under tax-inclusive shelf pricing, SNAP users very likely will receive a tax deduction for tax-exempt items when checking out (tax-deduction pricing). Therefore, our analysis of imperfect tax knowledge applies here because a SNAP user might not look at the receipt and respond to the tax-inclusive shelf price instead of the lower price they actually pay. The counterpart issue of nonsalience is whether consumers facing tax-deduction pricing will show different purchasing decisions from consumers facing tax-inclusive pricing. As the first to tackle this issue, 16 lab experiment offered an answer of “no” to this question. However, additional empirical studies are clearly warranted.
Conclusions
In this study, we developed a theoretical framework to examine the effect of a change in sales or excise tax on food and beverage demand. We show that the impact of a tax change on the demand for food or beverages mainly depends on the nature of the tax change, the degree to which consumers rely on SNAP benefits, the degree of underreaction to tax for consumers, the existence of a prior sales tax, the degree of consumers' misperception of tax status, and the publicity of the tax change. Our field survey at three grocery stores shows that a sizable proportion of shoppers estimate the tax status on food and beverages incorrectly. Surprisingly, our survey results show that past purchase of the same item does not improve a consumer's tax knowledge. We argue that this occurs in part because many retailers do not communicate tax information clearly to consumers.
We find that both effects of a sales tax change and an excise tax change are influenced by imperfect tax knowledge, a condition, our survey shows, that is not uncommon. When no prior sales tax exists, misperception of the correct tax status tends to attenuate the impact of a tax change; when a prior sales tax exists, misperception of the correct tax status tends to strengthen the impact of a tax change. We further compare the effectiveness of the two most commonly used taxes and find that the effect of an excise tax change on demand is largely comparable with that of a price change if excise taxes are fully passed on to consumers; a sales tax never affects demand as much as an excise tax of the same magnitude. We also extended the framework to accommodate tax learning over time, a phenomenon suggested by our survey results. With a small learning rate that is identified in the survey, we found that the long-run tax effects do not differ much from the short-run tax effects.
A variety of implications follow from our analysis. For studies that simulate the change in demand for food and beverages with respect to a sales tax change, our results provide insight into how much the tax elasticity of demand should be adjusted downward from the price elasticity of demand. Our results also can provide useful reference to many policy debates such as the choice of the proper tax as an antiobesity policy, exclusion of soft drinks from SNAP benefit, and adoption of tax-inclusive shelf pricing.
Supplementary material
Supplementary material is available at online http://ajae.oxfordjournals.org/.
Funding
Funding for this research was provided by Cornell University Food Industry Management Program.
 /
/ term. However, it is against intuition for a state to increase the sales tax rate by that much. In addition, increasing the tax rate by that much will greatly reduce the values of the information parameters and the subsequent value of equation (8) because consumers are less likely to notice such a small change in the tax rate.