The New Normal: The Supplemental Nutrition Assistance Program (SNAP)
Parke Wilde is associate professor at the Friedman School of Nutrition Science and Policy, Tufts University.
This article was presented in an invited paper session at the 2012 ASSA annual meeting in Chicago, IL. The articles in these sessions are not subjected to the journal's standard refereeing process.
The theme of this conference session is the “new normal,” the combination of increasing resource scarcity, rising prices, economic recession, and financial sector challenges that has complicated food and agriculture policy in recent years. The Supplemental Nutrition Assistance Program (SNAP) is being transformed by two aspects of the “new normal”: economic recession and higher food prices. This paper describes some resulting implications for SNAP's participation levels, average benefits, role in the broader national economy, and budgetary politics.
Formerly known as the Food Stamp Program, SNAP provides targeted benefits for food-at-home spending through normal retail channels. Serving more than 40 million low-income Americans in 2010, SNAP is the largest nutrition assistance program, the most costly USDA program, and an important component of the federal safety net for low-income Americans.
The SNAP caseload has grown rapidly during the recent financial crisis and recession, setting a new record every month since mid-2008. New estimates in this paper indicate that SNAP now plays a larger role than ever before in the overall U.S. food economy: in 2010, for the first time ever, SNAP benefits were responsible for more than one tenth of all food-at-home spending in the United States.
SNAP Participation
The SNAP caseload responded to policy changes and economic conditions from the 1960s to the present. Because SNAP is a “mandatory” or “entitlement” program, policy-makers have little direct control over annual program costs and are intensely curious about the relative magnitudes of policy and economic influences.
The most common and best-known route to SNAP eligibility is to meet gross and net income limits. The monthly gross income limit is 130% of the federal poverty standard ($2,422 in 2011 for a family of 4). The monthly net income limit, after certain allowable deductions, is 100% of the federal poverty standard ($1,863 in 2011 for a family of 4).
A second route to eligibility has increased in importance in recent years. Households can be eligible if all members receive either cash or non-cash benefits from Temporary Assistance for Needy Families (TANF), Supplemental Security Income (SSI), or in some places general assistance (USDA/FNS 2011). These programs have their own income eligibility rules, which vary by state. In states with comparatively generous cash assistance income thresholds, households with incomes above 130% of the federal poverty standard may become eligible for SNAP benefits. In fiscal year 2000, only 1% of SNAP participant households had income higher than 130% of the federal poverty standard. By contrast, in fiscal year 2010, 3.5% of SNAP participant households had income this high. In Wisconsin, Vermont, Michigan, Delaware, and Connecticut, 10% or more of participant households had income higher than this threshold (author's computations from FNS Quality Control data).
Other policy changes also affected caseloads. In the 1990s and early 2000s, many states turned to shorter certification periods as a way of ensuring that the income data used in benefit determination was up-to-date. These more burdensome certification policies suppressed participation by some eligible households (Kabbani and Wilde 2003). Later, in the mid-2000s, in response to reforms in the way the federal government penalized states for benefit determination errors, many states reversed course and lengthened the certification periods (Hanratty 2006). Especially for low-income working families, who commonly have severe time stresses and fluctuating incomes, a longer certification period can make it easier to remain on SNAP. In addition to the certification period changes, in the 2000s, the federal government funded radio and television advertising campaigns to encourage participation among eligible households (Dickert-Conlin, Fitzpatrick, and Tiehen 2010).
Most studies of the causes of caseload changes estimate regression models showing state-level caseloads as a function of economic conditions (particularly the unemployment rate) and policy variables (Grogger and Currie 2001; Kabbani and Wilde 2003; Hanratty 2006). USDA's SNAP Map Machine shows high levels of SNAP participation in poorer regions of the country, with SNAP participation in 2007 exceeding 20% of the population in parts of Appalachia, the rural Southeast, the Texas borderlands, and the poorest rural counties in western states (figure 1). Similar data for 2009 is available in an online application from the New York Times (2009). This cross-geographic variation is typically not used in regression analyses of SNAP participation. Because regression models might otherwise be confounded by observable and unobservable characteristics of states, econometric studies of SNAP participation generally use fixed-effects models that measure the effect of within-state changes in explanatory variables on within-state changes in caseload outcomes. Figure 2 illustrates the basic thrust of this approach. The explosive shape of the bubble plot shows the large within-state changes in caseloads that accompanied large increases in unemployment from fiscal years 2000 to 2009. A dynamic interactive version of this chart is provided online for the fiscal years from 1990 to 2010.
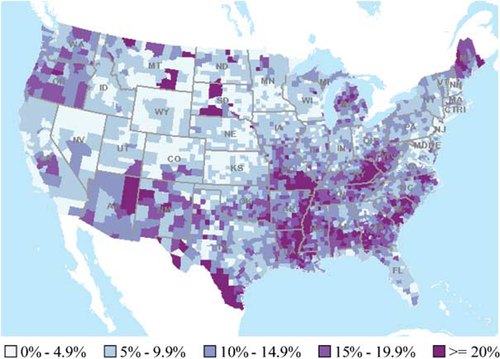
SNAP participation as a percentage of county population, 2007
Source: USDA Economic Research Service Map Machine.
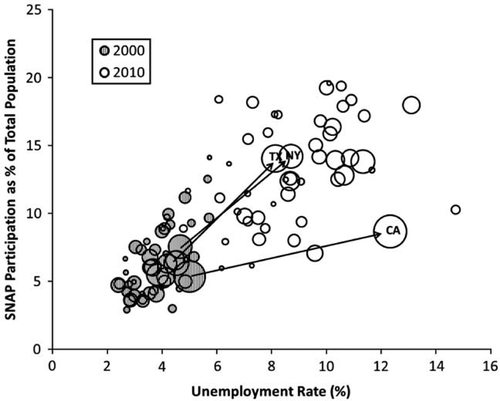
State-level SNAP participation as a function of the unemployment rate, fiscal years 2000 and 2010
Note: Bubble size is proportional to state population. Author's computation based on USDA/FNS annual SNAP participation data, BLS unemployment rate data, and Census Bureau population data. A dynamic interactive version of this chart is available online from the author at http://tinyurl.com/c4gt2yx.
The most recent in the series of studies of SNAP caseload changes (Klerman and Danielson 2011) focused on a 39% SNAP caseload decline from 1994 to 2000 and a larger 93% increase from 2000 to 2009. Worsening economic conditions accounted for 27% of the caseload increase in the 2000s. Policy changes that made SNAP more accessible accounted for 16% of the caseload increase, and welfare policy changes added 6%. As is typical for studies in this literature, a substantial fraction of the caseload increase remained unexplained by the model. Policy variables were particularly important for explaining one of the most notable changes in SNAP in recent years. Whereas in the 1990s the Food Stamp Program was composed largely of families that also received cash assistance (welfare), the SNAP program today is composed predominantly of families and individuals with no cash assistance, including many working people. As a growing proportion of SNAP recipients participate in the labor market, SNAP participation and outlays may be increasingly sensitive to high unemployment and economic recession.
To understand the implications of SNAP caseload changes, it is also useful to consider the dynamics of program entry and exit. The recent period of caseload increases is attributable both to increased rates of program entry and to longer spell lengths (in other words, decreased rates of program exit). Low-income nonparticipant households are far more likely to enter SNAP if they lack labor market earnings. Moreover, in the most recent analysis of caseload dynamics (Mabli et al. 2011), using data from the Survey of Income and Program Dynamics (SIPP) for 2004–2006, it appeared that spell lengths had increased substantially from earlier time periods. This finding was surprising, because the 2004–2006 observation period took place before the most recent increase in unemployment and poverty. If there has been a secular increase in SNAP participation spell lengths, reflecting a slow-down in SNAP exit rates, the impact of the current record caseloads may be felt for a long time to come.
SNAP Average Benefits
Even as the number of participants increased in the 2000s, the average benefit per participant also grew rapidly. For an eligible household, the monthly benefit amount equals a maximum benefit minus 30% of net income. The maximum benefit during each fiscal year is pegged to the cost of the Thrifty Food Plan in the preceding June. The Thrifty Food Plan is a food basket that is designed to provide an adequate diet while also meeting a binding cost constraint (Wilde and Llobrera 2009). In the years leading up to 2009, the maximum benefit was set to 100% of the cost of the TFP.
After many years of low inflation, food price increases accelerated somewhat in 2006 to 2008. Also, in order to reduce hardship and stimulate consumer spending in response to the financial crisis and recession, the 2009 American Recovery and Reinvestment Act (ARRA) temporarily increased the maximum SNAP benefit to 113% of the TFP. Furthermore, among participants, net income after deductions has fallen in recent years. These developments in combination have dramatically raised the average SNAP benefit. In nominal terms, the average per-person monthly SNAP benefit in fiscal year 2010 was a record $133.79, more than 30% higher than it was just two years earlier.
To more fully explain the composition of this increase, figure 3 illustrates trends in prices and benefit amounts from fiscal years 2000 to 2011 in real terms, adjusted for inflation using the CPI for all goods and services. The bottom line shows that the price index for food at home changed little relative to prices of all goods and services. Although the cost of the TFP is widely thought to track the CPI for food at home, the second-from-bottom line shows that the cost of the TFP actually grew somewhat faster. Compared to national average food expenditures, which provide the basis for the food CPI, the TFP is weighted more heavily in food groups whose prices increased more quickly. For example, the TFP basket contains more fruits and vegetables, whose prices increased faster, and less sugar-sweetened beverages, whose prices increased more slowly. The third-from-bottom line shows the change in the maximum benefit level, which slightly lags behind the change in the TFP, and which shows the large effect in 2009 to 2011 of the ARRA benefit increase. Finally, the top line in figure 3 shows that the average SNAP benefit increased more quickly than one would expect just from price inflation and the ARRA policy change.
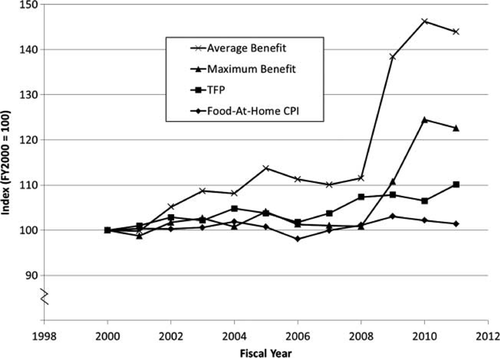
Real change relative to fiscal year (FY) 2000 in (a) average per-participant SNAP benefit, (b) maximum SNAP benefit for a family of four, (c) cost of the Thrifty Food Plan (TFP) for a family of four, and (d) the CPI for food at home, fiscal years 2000–2011
Note: Fiscal Year 2011 data reflect partial year.
SNAP's Role in the Food Economy
It has long been recognized that SNAP affects the broader economy. Based on data from the early 2000s, USDA's Food Assistance National Input-Output Multiplier (FANIOM) model estimates that each increase of $1 billion in SNAP expenditures could raise Gross Domestic Product (GDP) by $1.79 billion, raising employment by 8,900 to 17,900 jobs (Hanson 2010). More recently, with increased participation and increased average benefits per participant, SNAP now supports a substantial fraction of U.S. food demand.
Figure 4 expresses aggregate SNAP benefits as a percentage of aggregate food-at-home spending, using two USDA data series for the spending estimates. The first data series is food at home from grocery or food stores (for example, $522 billion in 2010), which may be a slight underestimate of the relevant food retail category, because some stores such as convenience stores may also be SNAP-authorized retailers. The second data series is all food at home (for example, $583 billion in 2010), which may be an overestimate of the relevant food retail category because not all of this food is eligible for SNAP purchase. By either measure, the qualitative conclusion is striking: aggregate SNAP benefits reached record levels in 2008 to 2010 and now constitute more than 10% of all U.S. food-at-home spending (figure 4).
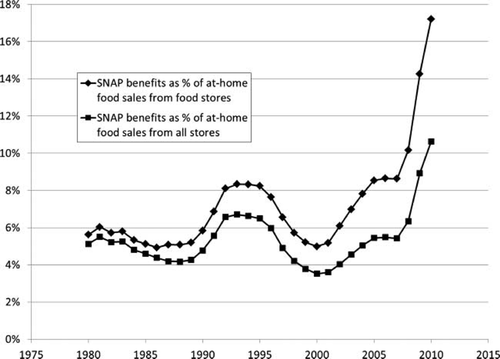
Total SNAP benefits, as a percentage of food at-home sales in food stores and in total, 1981–2010
Author's computation based on USDA/FNS annual SNAP data (converted from fiscal year to calendar year by interpolation) and USDA/ERS annual national food spending data by calendar year.
The role of SNAP benefits appears even higher when compared to food-at-home spending just by low-income Americans. Figure 5 compares 2010 estimates for SNAP benefits and food-at-home spending, disaggregated by annual income category. There are some technical differences in the data sources for SNAP benefits and food spending. The annual income categories for the SNAP benefit estimates come from administrative Quality Control (QC) data on income for SNAP units, while the annual income categories for the food-at-home spending estimates come from self-reports in Consumer Expenditure Survey (CEX) data on income before taxes for households. Even acknowledging this limitation in the comparison, it is clear that aggregate SNAP benefits are responsible for a dominant share of all food-at-home spending for low-income Americans.
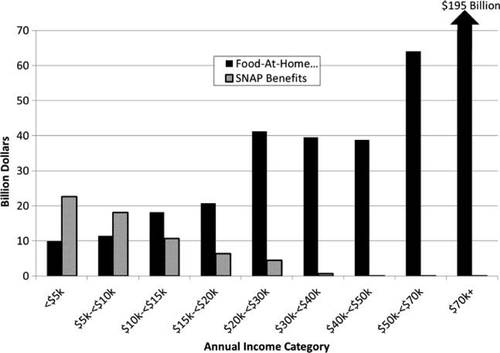
Total SNAP benefits and total food-at-home spending, by annual household income category, 2010
Note: Author's computation based on USDA/FNS Quality Control (QC) microdata for fiscal year 2010 and self-reported income and food spending from BLS Consumer Expenditure Survey (CEX) for calendar year 2010.
One odd result in figure 5 deserves some further discussion. For the very poorest households, with annual income less than $5,000, aggregate SNAP benefits appear to be more than double the amount of food-at-home spending that respondents report in the CEX. The most likely explanation for this result is that the CEX underestimates food spending for very low-income Americans. An alternative explanation is that many households who are classified in QC data as having incomes less than $5,000 would be classified by the CEX in a higher income category, due to differences in the definition of a household. However, because aggregate SNAP benefits also are higher than CEX food spending estimates for the next income category ($5,000 to $10,000), this second explanation seems insufficient to explain why SNAP benefits are so high relative to estimated food spending. Across all households with annual income less than $20,000, aggregate SNAP benefits in QC data approximately equal aggregate food-at-home spending estimated in the CEX.
SNAP Political Support
For many years, SNAP has received bipartisan political support from both urban and rural legislators in the U.S. Congress. There are some indications that this support is under strain. In some policy circles, criticism of SNAP is sharper than one would typically have heard in recent years. Former House Speaker and presidential candidate Newt Gingrich in May 2011 derided President Barack Obama as “the food stamp president” (Rucker 2011). The House Budget Committee in spring 2011 reported:
The cost of this program has exploded in the last decade…. Much of this is clearly due to the recession, but not all of it…. The trend is one of relentless and unsustainable growth—the large recession-driven spike came on top of very large increases that occurred during years of economic growth (House Budget Committee 2011).
The committee proposed substantial budget cuts and, beginning in 2015, converting SNAP into a block grant to states. If they passed, these proposals would be the most significant retrenchment since the modern Food Stamp Program was established during the Kennedy administration.
Conclusion
The “new normal,” characterized by elevated unemployment and food price inflation, has affected SNAP in several ways. Directly, recession and unemployment increased the number of U.S. households eligible for SNAP and the fraction of eligible households that participate. Elevated food-price inflation raised the average SNAP benefit in nominal terms, and the comparatively rapid price increases for some foods (such as fruits and vegetables) caused the SNAP maximum benefit to increase in real terms.
Indirectly, the “new normal” has altered the policy environment in ways that also affected SNAP. On the one hand, the ARRA legislation, a key part of federal government's reaction to the financial crisis, further increased SNAP benefits. On the other hand, the “new normal” has complicated the budgetary context in which SNAP policy decisions are made. As SNAP participation and average benefits have increased, the program also has become a target for proposed budget cuts. It is far from clear whether SNAP's current caseloads and budgets represent a temporary spike or a lasting change in the national food economy.


