Measurement Error in Angler Creel Surveys
Abstract
Information on fishing effort, catch, harvest, and survival is important for formulating management policies in freshwater fisheries and for understanding the dynamics of aquatic ecosystems. Fisheries managers often use creel surveys to assess fisheries statistics. The mean-of-ratios estimator has been traditionally used for estimating catch rates from incomplete angler trips, whereas the ratio-of-means estimator is preferable for estimating catch rates from completed trips. Recent studies have demonstrated persistent bias when comparing the two estimators based on catch data from incomplete and completed trips from the same sample of anglers; these studies have promoted the use of linear regression models to correct for apparent bias in catch rates based on incomplete trips. However, the reported bias in catch rate estimates may be an artifact of measurement error in incomplete-trip angler surveys rather than bias from the estimates themselves. Furthermore, we contend that ordinary least-squares linear regression is inappropriate to correct for this apparent bias because measurement error is present in both the response variable (e.g., catch rate estimated from completed trips) and the explanatory variable (e.g., catch rate estimated from incomplete trips), leading to low estimates of the slope of the relationship. Alternatively, when both variables contain measurement error, model II regression methods provide less-biased estimates. Using interview data (incomplete trips) from roving creel surveys and a catch card survey (completed trips) conducted on the same sample of anglers, we compared catch rates derived from both estimators. Our results show that linear regression underestimates the slope of the relationship and that model II regression reduces bias and provides a more accurate estimate.
Received April 26, 2014; accepted November 26, 2014
Estimates of fisheries characteristics, such as effort, catch, harvest, and survival, are needed for formulating management policies in freshwater fisheries. Creel surveys are an important tool used by fisheries managers to assess these characteristics. When it is logistically feasible to obtain completed-trip information from anglers, the ratio-of-means estimator is the standard method for estimating catch rates (Pollock et al. 1994). Completed-trip data are usually collected through angler diaries and catch card programs, in which the anglers are asked to provide detailed information about their catch and the duration of their trip. However, the challenging logistics of surveying freshwater streams often require managers to implement roving creel surveys, which yield information on angler trips that have not yet been completed. In a roving creel survey, the creel agent travels the length of the study stream or lake and conducts interviews with anglers, often before or during their trip. When a roving creel survey is used to determine catch rates, the mean-of-ratios estimator is the accepted method because it minimizes bias (Hoenig et al. 1997; Pollock et al. 1997).
Despite extensive evaluation of catch rates derived from these estimators based on simulation models and statistical theory (Jones et al. 1995; Hoenig et al. 1997; Pollock et al. 1997), field studies that compare catch rate estimates from completed and incomplete trips have been inconclusive, yielding both biased and unbiased results (Carline 1972; Malvestuto et al. 1978; Sullivan 2003; Keefe et al. 2009). Recent studies have demonstrated persistent bias when comparing the ratio-of-means and mean-of-ratios estimators using catch data from the same sample of anglers (Keefe et al. 2009; McCormick et al. 2012). We hypothesize that the bias stems from measurement error in the angler creel surveys rather than bias in the estimators themselves. Few, if any, studies have examined the potential effects of measurement error on catch rate estimates from incomplete trips or have used regression methods that are robust to measurement error in both variables.
Recent studies have also promoted the use of linear regression models to correct for apparent bias in catch rates based on incomplete trips (Keefe et al. 2009). We contend that ordinary least-squares (OLS) linear regression is inappropriate for correcting the apparent bias associated with roving creels because comparable measurement error is present in both the response variable (catch rate estimated from completed trips) and the explanatory variable (catch rate estimated from incomplete trips; Ricker 1973; Sokal and Rohlf 1995; Legendre and Legendre 2012). Failure to accommodate observation or measurement error associated with the explanatory variable results in least-squares and maximum likelihood slope estimators that are biased toward zero, thereby underestimating the slope of the relationship (Fuller 1987). Measurement error (also called “error in variables”), in contrast to sampling error (i.e., deviations from the true population value), arises during the measuring process and is due to such factors as imperfect instruments, observer error, and (in the case of humans) subject response error. Due to the inherent variation in measuring fisheries statistics from human subjects, model II regression provides a more appropriate method for comparing catch statistics derived from completed and incomplete trips. Although the error-in-variables problem has been studied most thoroughly for commercial and marine fisheries data (Ricker 1973; Walters and Ludwig 1981; Hilborn and Walters 1992; Walters 2007), the issue is not limited to marine fisheries. Numerous examples are available in the general ecology literature (e.g., predator–prey models, chlorophyll-a estimation, and nutrient ratios) that have used linear regression with comparable levels of measurement error in both of the regressed variables (Carpenter et al. 1994), despite several published studies cautioning against the practice (Gillard 2006; Smith 2009).
An example of an appropriate use of linear regression would be to measure the growth rate of a fish (response variable) in relation to stream temperature (explanatory variable) because the explanatory variable can be measured with much greater precision than the response variable. If, however, the observations on both axes contain measurement error, then linear regression may not be appropriate. To illustrate this point, Sokal and Rohlf (1995) used a study in which researchers regressed the mass of unspawned Cabezon Scorpaenichthys marmoratus to estimate the functional equation relating the number of eggs to the mass of females before spawning. Since the measurement of female mass before spawning and the estimated number of eggs are both subject to error (i.e., not measured precisely), this is an inappropriate use of linear regression.
Each year, the New York State Department of Environmental Conservation (NYSDEC) stocks approximately 3.6 million catchable-sized trout into over 10,000 km of streams in New York State to provide a “put-and-take” fishery for recreational angling. The NYSDEC has used an approach known as the Catch Rate Oriented Trout Stocking Program for nearly three decades to establish trout stocking policies. This program guides selection of suitable streams for stocking and attempts to establish appropriate stocking levels in order to give anglers a catch rate of 1 fish every 2 h for a portion of the fishing season (Engstrom-Heg 1990). Accurate estimates of catch rate are important to the success of the program; however, logistical access point difficulties along managed stream segments make it impossible to conduct access surveys wherein every angler is interviewed upon completion of their fishing trip. Instead, the NYSDEC employs roving creel surveys in which creel agents intercept anglers during their fishing trip, thus relying on incomplete-trip data. Previous incomplete-trip surveys had shown catch rate estimates that were lower than expected or seen in the field (NYSDEC, personal communication). To address this discrepancy, we used roving creel survey data (incomplete trips) collected by the NYSDEC coupled with data from a simultaneous catch card survey (completed trips) of the same sample of anglers. We compared catch rates estimated from both the mean-of-ratios and ratio-of-means estimators using OLS regression and three different model II type regressions (major axis [MA], ranged major axis [RMA], and standardized major axis [SMA]).
METHODS


Statisticians have been aware of the error-in-variables problem since the late 1870s (Adcock 1877), and several methods for dealing with the problem have been published over the last several decades (Ricker 1973; Fuller 1987; Sokal and Rohlf 1995; Legendre and Legendre 2012). Despite the availability of numerous methods for dealing with error in variables, relatively few ecologists and fisheries biologists account for this problem, instead relying on linear regression irrespective of potential measurement error. We contend that ecologists and managers should consider model II regression when there is a potential for measurement error in both variables.
The most widely accepted methods for dealing with measurement error are a family of line-fitting procedures that acknowledge and incorporate uncertainty in both the response and predictor variables. Among the model II procedures, MA, RMA, and SMA (Smith 2009; Legendre and Legendre 2012) are most commonly used. Model II and OLS regressions differ in their definition of residuals or scatter around a line (Angleton and Bonham 1995). Ordinary least-squares regression minimizes the sum of squares by taking the sum of vertical deviations of the line, whereas MA minimizes the sum of squares of the perpendicular spread from the regression line (Figure 1). Thus, there is only one MA regression line (Legendre and Legendre 2012), and the slope can be calculated as
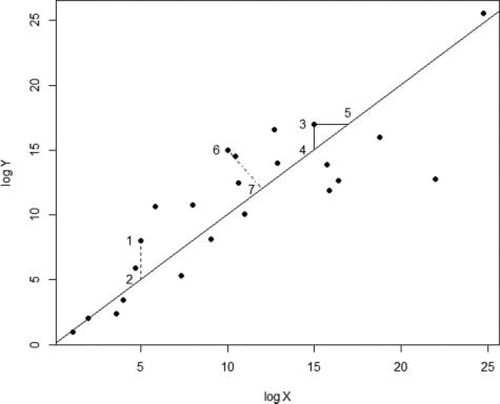
Ordinary least squares regression fits a line that minimizes the vertical spread of values around the line (e.g., segment 1–2). Alternatively, standardized major axis regression minimizes the sum of squared triangular areas bounded by observations and the regression line (e.g., triangle 3–4–5). Ranged major axis regression and major axis regression each minimize the sum of squares of the perpendicular spread from the regression line (e.g.,segment 6–7).

 and
and  are the estimated variances of y and x, respectively, and sxy is their covariance.

We acknowledge that completed-trip surveys are also subject to systematic error, such as nonresponse and recall bias, and thus do not completely approximate the truth. Despite these potential sources of bias, completed trips more closely approximate the truth than do incomplete trips. To address this issue, we first used simulations to illustrate the biased slope caused by measurement error in both variables for a model where “truth” was known. We simulated a data set with a sample size of 50, SDx equal to 6, and SDy equal to 15. We simulated posterior probabilities over 3,000 iterations for a linear model ignoring the error in x. We then repeated the procedure while incorporating error in x, under the assumption that we had reasonable prior knowledge about the measurement precision in x.
We estimated total catch rates using data from roving creel surveys on two streams managed by the NYSDEC stocking program: Kayaderosseras and East Koy creeks (Table 1). The surveys were conducted on all weekend days and holidays and on two randomly selected weekdays each week from April 1 to October 1, 2012. Creel surveys were stratified by weekends and weekdays and sampled randomly, with opening day and holidays considered as weekend days. The start time of each survey day was randomly selected as either morning or afternoon. Creel agents conducted two instantaneous/progressive vehicle counts daily to estimate the total number of anglers. Information collected during the interviews included the start time of the fishing trip, whether the trip was complete at the time of the interview, trip duration, number of anglers per party, number of rods used, and gear type. Creel agents also collected biological data, including the total number of trout caught (by species), the number of trout creeled, the number of trout released, and trout lengths (mm). Fishing parties were systematically skipped (i.e., every other fishing party) during high-use days to ensure time schedule commitments (Pollock et al. 1994). Creel agents were instructed to distribute individually numbered, postage-paid catch cards to anglers who had not completed their fishing trips; this allowed us to obtain completed-trip information and additional catch information. The unique identifier number for each card allowed us to couple each angler's completed-trip data and incomplete-trip information. Returned cards were entered into a US$100 lottery to increase return rates. All interview data from the roving creels where anglers fished for less than 30 min were discarded to reduce variance around the catch rate estimates (Pollock et al. 1997).
| Completed trips | Incomplete trips | |||
|---|---|---|---|---|
| Stream | MOR | ROM | MOR | ROM |
| East Koy | 0.54 | 0.47 | 0.93 | 0.74 |
| Kayaderosseras | 0.41 | 0.43 | 0.86 | 0.63 |
| Mean | 0.48 | 0.45 | 0.89 | 0.69 |
The data evaluated here were taken from roving creel surveys conducted on a total of 84 d for Kayaderosseras Creek and 79 d for East Koy Creek. During the creel survey period, 148 survey cards were issued on Kayaderosseras Creek, and 104 survey cards were issued on East Koy Creek. In total, 196 cards (from both streams) were returned, yielding a mean response rate of approximately 0.78. After eliminating interviews with anglers that had been fishing for less than 30 min and excluding cards that could not be matched with interview data (e.g., due to angler reporting errors or inaccuracies), we had a total of 167 survey pairs (i.e., angler interview + returned catch card) remaining for analysis, allowing for calculation of daily catch on 63 angler-days.
 ; fish/angler-hour) for incomplete trips by calculating the mean of individual ratios for incomplete trips using the mean-of-ratios estimator,


 is the complete catch for the jth angler and
  is the length of the completed trip made by the jth angler, following the methods outlined by Pollock et al. (1997). We also calculated catch rates using both estimators with completed-trip information only and then repeated this procedure using incomplete trips only to test for bias in the estimators themselves. We tested for equality of variance using Levene's test prior to running linear OLS regressions (Keefe et al. 2009). We used quantile–quantile (Q–Q) plots and a Shapiro–Wilk test to evaluate whether our sample came from a normally distributed population. When data were not bivariate normal, we used appropriate log transformations. Following methods described by Sprugel (1983) and further outlined by Qian (2011), we corrected for potential logarithmic transformation bias by multiplying back-transformed estimates by the correction factor

We used Pearson's product-moment correlation coefficient (Pearson's r) to test for significance in the correlation between the two estimators. We assessed significance at an α level of 0.05.
We compared the ratio-of-means and mean-of-ratios estimators using OLS and model II regressions (Keefe et al. 2009; Legendre and Legendre 2012). Although only one test is most appropriate for a given data structure, we provide estimates from all four tests to permit a comparison. We then used the regression equation (i.e., slope and intercept term) from each model to correct for the bias associated with estimates from incomplete trips by incorporating incomplete-trip estimates into the linear model (Keefe et al. 2009) in back-transformed space. The equation was then applied to the mean estimate of incomplete trips. All statistical models and analyses were conducted using R version 2.15.2.
RESULTS
Our simulations demonstrated that neglecting to account for measurement error did indeed result in an underestimation of the slope (Figure 2). Over 3,000 iterations, the model incorporating an approximation of measurement error in x provided much less biased slope estimates than did the naive model (Figure 2). The simulation also showed that when a researcher has prior knowledge of the relative precision of measurement in x, bias in the slope estimate can be reduced by incorporating error into the model (Figure 2).
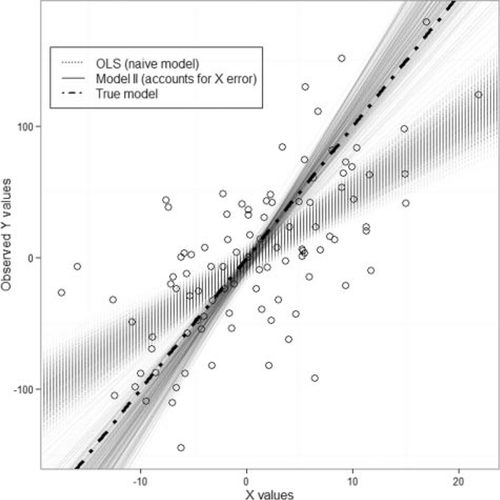
Results of simulations in which data with measurement error were used in the true model (dashed–dotted line). The naive ordinary least-squares (OLS) model (dotted line) did not account for measurement error, whereas the model II type regression (solid line) did account for measurement error on the x-axis. Models were simulated over 3,000 iterations.
Significant differences were found in mean catch rates calculated using the two estimators; the slope of the linear model was consistently below the 1:1 relationship (Figure 3). The mean catch rate was 0.45 fish/angler-hour for completed trips using the ratio-of-means estimator and 0.89 fish/angler-hour for incomplete trips. The mean estimate of catch rate was 0.44-fish/angler-hour higher for incomplete trips than for completed trips, despite the truncation of data from interviews that took place after less than 30 min of angling. Regression analyses between the two estimators revealed that the mean-of-ratios estimator did not yield a significant positive bias relative to the ratio-of-means estimator at the stream level (Pearson's r = 0.30; P = 0.14); however, a significant positive bias between incomplete and completed trips was found at the individual angler level (Pearson's r = 0.63; P = 0.005), indicating that the source of bias for these data was variation in rates calculated from completed and incomplete trips (i.e., measurement error) rather than the estimators themselves. When we compared the mean-of-ratios estimates to the ratio-of-means estimates using data from completed trips alone, bias was reduced to 0.07 for East Koy Creek and 0.02 for Kayaderosseras Creek (Table 1). Sampling variances did not differ significantly for any of the comparisons (Levene's test: w = 0.73; P = 0.81).
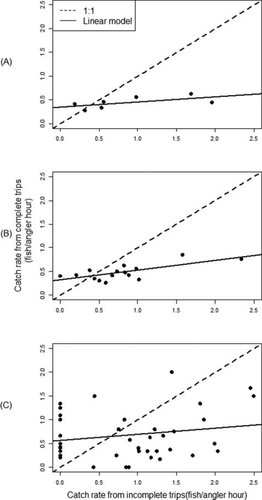
Comparison of (A) mean monthly trout catch rates, (B) weekly mean trout catch rates, and (C) individual angler catch rates estimated with the ratio of means from mail-in survey cards (completed trips) on the y-axis and the mean of ratios from roving creel interviews (incomplete trips) on the x-axis. The linear model is the line of best fit between completed-trip and incomplete-trip estimates using ordinary least-squares regression. The dashed line represents the 1:1 relationship.
Log-transformed data had fewer departures from the theoretical normal line on a Q–Q plot; therefore, the Shapiro–Wilk test was not rejected (w = 0.918; P = 0.45), indicating that log transformation satisfied normality assumptions. Although our data were bivariate normally distributed after log transformation, SMA and RMA were more appropriate estimators than MA because r was significant and the error variances on the two axes differed (Legendre and Legendre 2012). A visual scatterplot inspection of the study data did not indicate the presence of major outliers, so RMA was considered the most appropriate method for comparing the estimators and for use as a corrective model. However, MA, SMA, and OLS estimates are also provided to allow for comparison among the methods (Table 2; Figure 4).
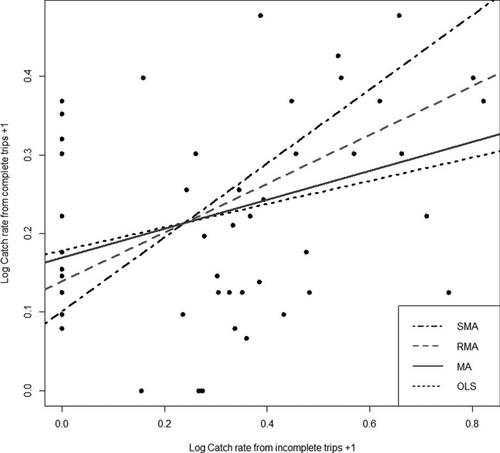
Comparison of mean daily trout catch rates (fish/angler-hour) estimated from incomplete trips (roving creel survey) and completed trips (mail-in card survey) for East Koy and Kayaderosseras creeks. Major axis (MA), ranged major axis (RMA), standard major axis (SMA), and ordinary least-squares (OLS) regressions are provided for comparison; however, for this data set, RMA is the most appropriate method. (To improve clarity and interpretation of the figure, note that 1.0 was added to log-transformed values on the x- and y-axes to keep data in the positive quadrant).
| Method | Intercept | Slope | Bias-corrected catch rate estimate (fish/angler-hour) |
|---|---|---|---|
| OLS | 0.18 | 0.15 | 0.32 |
| MA | 0.17 | 0.18 | 0.34 |
| SMA | 0.10 | 0.47 | 0.54 |
| RMA | 0.13 | 0.31 | 0.42 |
Analysis from the comparison of the OLS model and model II regressions resulted in different estimates of the slope (Table 2; Figure 4). As predicted, the OLS model provided the lowest slope estimate, indicating that the slope was biased due to the presence of measurement error in both variables. Without the corrective models, the catch rate estimated from incomplete trips differed from completed-trip estimates by 0.44 fish/angler-hour. This empirical pattern approximated the pattern identified in our simulations over 3,000 iterations.
Use of the OLS equation as a bias correction model (as in Keefe et al. 2009) underestimated catch rates from incomplete trips by 0.13 when compared with completed trips (Figure 5), providing a catch rate estimate of 0.32 fish/angler-hour (Table 2). The MA model also underestimated catch rates from incomplete trips by 0.11 fish/angler-hour when compared with completed trips but did so to a lesser degree than OLS. The RMA corrective model performed best, accounting for approximately 91% of the incomplete-trip bias and underestimating the completed-trip catch rate by only 0.03 fish/angler-hour (Figure 5). Conversely, the SMA model overestimated catch rates from incomplete trips by 0.09 fish/angler-hour, yielding an estimate of 0.54 fish/angler-hour (Table 2) when compared with completed trips.
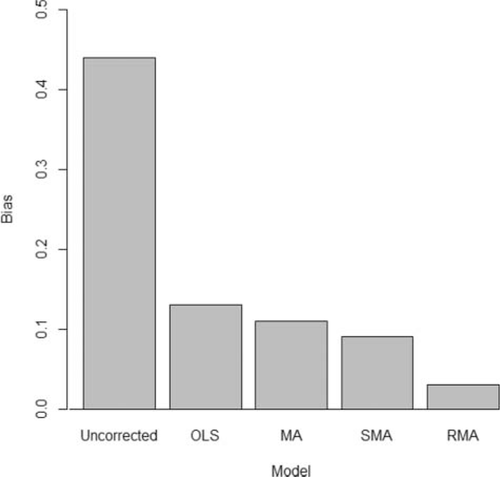
Difference in trout catch rates (fish/angler-hour) estimated using bias correction models compared with uncorrected estimates. Model II regressions (major axis [MA], standardized major axis [SMA], and ranged major axis [RMA]) performed better than ordinary least-squares (OLS) regression, and all models performed better than uncorrected estimates.
DISCUSSION
Our comparison of mean catch rates for individual anglers as estimated from incomplete-trip and completed-trip data indicated a consistent difference between the two estimators, similar to the findings of Keefe et al. (2009). However, this pattern was not observed when comparing differences in mean catch rates for entire streams (i.e., mean catch rates for all anglers who fished a particular stream). When the two estimators were compared using only completed-trip data, bias was greatly reduced, indicating that the source of variation was likely driven by measurement error in the data rather than bias resulting from the estimators themselves, as in Keefe et al. (2009). This presumably occurs because creel surveys rely on data collected from anglers, therefore encompassing uncertainty due to human behavior, fish behavior, and environmental factors, any of which can influence measurement and cause variation between completed-trip and incomplete-trip estimates.
Estimation of catch rates from incomplete trips is based on the assumption that fish catchability remains constant, implying that fish foraging and movement behavior is random (Hoenig et al. 1997; Pollock et al. 1997). However, this assumption is likely violated, as stream trout have been shown to utilize certain habitats more frequently than others (Alexiades et al. 2012) and to forage at different locations throughout the day (Bachman 1984; Bunnell et al. 1998), and these behaviors are often exploited by anglers. Several studies have shown bias in incomplete-trip catch rate estimates (Mackenzie 1991; Malvestuto 1996; Keefe et al. 2009; McCormick et al. 2012), whereas other studies have found that incomplete-trip and completed-trip catch rate estimates do not differ (Malvestuto et al. 1978; Dent et al. 1991). It is likely that the level of variation between the two estimators is influenced by the target species and habitat in the study area (Malvestuto 1996).
The bias between incomplete-trip and completed-trip catch rates may also stem from angler response bias due to respondent memory recall, exaggeration of catch, and nonresponse bias (Carline 1972; Sullivan 2003). Although the high response rate in our study reduced some of the effects of angler response bias, catch cards remain an imperfect approximation of completed-trip lengths. Nevertheless, catch cards provide more information about completed trips than do roving creel surveys. Simulation is the only way to completely evaluate the ability of an analytical approach to estimate “true” values in an empirical system; however, stream fishery managers require the best possible information on actual catch rates, which simulations do not provide. Consequently, although methods such as those employed in this study are imperfect, they more closely approximate completed-trip catch rates than the use of only incomplete-trip data.
The positive bias (i.e., overestimation of catch rates) from incomplete-trip data could have major ramifications for fisheries management and conservation. When it is logistically or economically infeasible to conduct access point surveys for obtaining completed-trip information, roving creel surveys are often the only option available for recreational creel surveys. Thus, statistical tools are needed that can effectively correct for this bias. Keefe et al. (2009) recommended developing species-specific corrective linear regression models for catch rates prior to conducting a roving creel survey. Based on our findings, we agree with Keefe et al. (2009) that corrective linear models are useful in reducing bias associated with the roving creel survey design. However, due to the measurement error inherent in creel survey data collection, OLS regression is not an appropriate linear model because it underestimates the slope. Model II regression is more appropriate because the slope estimate remains unchanged when measurement error is present in both variables, as is the case for creel survey data.
Because creel survey responses can be affected by human subject response, fish behavior, and environmental uncertainty, measurement error is almost certainly a factor (Hilborn and Walters 1992). Completed-trip and incomplete-trip catch rate estimates are both subject to measurement error, making their comparison a useful illustration of the bias inherent in the use of OLS. As expected, we found that OLS estimates provided the lowest slope among the four tested linear models when we compared actual estimates of stream trout fishery catch rates from the NYSDEC roving creel survey (incomplete trips) and the completed-trip estimates from the mail-in card survey.
Our results demonstrated the positive bias that occurs when using roving creel survey data to estimate catch rates, and this study illustrates alternatives to OLS regression when measurement error is present in both variables. This issue, however, is not limited to creel surveys, as the fisheries and ecological literature contains numerous other examples in which OLS regression was used when model II regression would have been a more appropriate choice. We strongly recommend that ecologists and managers utilize model II regression when there is a potential for measurement error in both variables.
As the NYSDEC and other fisheries management agencies use targeted catch rates as part of their management strategies, it is essential to provide the most accurate estimates possible given the uncertainties in available data. If the goal of creel surveys is simply to evaluate temporal trends, then the use of incomplete-trip data will probably be sufficient, as catch rate estimates are likely to be consistently underestimated. However, when management agencies must make decisions based on accurate estimates of catch rate, we recommend employing a two-part strategy of using roving creels coupled with catch card programs and using model II regression methods to apply correction factors. In our study, estimates differed substantially when using the mean of ratios for incomplete trips and the ratio of means for completed trips, but differences were minimal when the two estimates were based on completed trips alone. This finding indicates that the bias is not introduced by the estimators themselves but instead stems from error in the incomplete-trip data collection. Therefore, we recommend that managers continue to use the ratio-of-means estimator for completed trips and the mean-of-ratios estimator for incomplete trips in addition to discarding interviews with anglers that had fished for less than 30 min (as recommended by Pollock et al. 1997).


