Combining Split-Beam and Dual-Frequency Identification Sonars to Estimate Abundance of Anadromous Fishes in the Roanoke River, North Carolina
Abstract
Riverine hydroacoustic techniques are an effective method for evaluating abundance of upstream migrating anadromous fishes. To use these methods in the Roanoke River, North Carolina, at a wide site with uneven bottom topography, we used a combination of split-beam sonar and dual-frequency identification sonar (DIDSON) deployments. We aimed a split-beam sonar horizontally to monitor midchannel and near-bottom zones continuously over the 3-month spring monitoring periods in 2010 and 2011. The DIDSON was rotated between seven cross-channel locations (using a vertical aim) and nearshore regions (using horizontal aims). Vertical deployment addressed blind spots in split-beam coverage along the bottom and provided reliable information about the cross-channel and vertical distributions of upstream migrants. Using a Bayesian framework, we modeled sonar counts within four cross-channel strata and apportioned counts by species using species proportions from boat electrofishing and gill netting. Modeled estimates (95% credible intervals [CIs]) of total upstream migrants in 2010 and 2011 were 2.5 million (95% CI, 2.4–2.6 million) and 3.6 million (95% CI, 3.4–3.9 million), respectively. Results indicated that upstream migrants are extremely shore- and bottom-oriented, suggesting nearshore DIDSON monitoring improved the accuracy and precision of our estimates. This monitoring protocol and model may be widely applicable to river systems regardless of their cross-sectional width or profile.
Received July 16, 2014; accepted November 21, 2014
Anadromous fishes are ecologically, economically, and culturally important. These species transport marine-derived nutrients to often nutrient-deficient freshwater watersheds (Willson and Halupka 1995; Garman and Macko 1998). Many anadromous species along the eastern coast of the United States once supported large commercial fisheries, but anthropogenic influences such as overfishing, water quality degradation, and loss of spawning habitat have caused major declines in abundance (Limburg et al. 2003; Limburg and Waldman 2009). Reliable population assessments are important in guiding restoration and management of these species.
Spawning migrations of anadromous fishes offer an excellent opportunity to assess their status due to their accessibility in rivers. Fixed-location hydroacoustics is an established method for in-river run-size estimates of anadromous fishes along the western U.S. coast, but is used less frequently in east coast rivers (Daum and Osborne 1998; Enzenhofer et al. 1998; Ransom et al. 1998; Simmonds and MacLennan 2005). Ideally, sonar systems are deployed on both shorelines of rivers in areas that have a gentle slope and laminar flow, encouraging active fish migration past the site (Daum and Osborne 1998; Enzenhofer and Cronkite 2000). Monitoring is typically done using either split-beam or multibeam sonar systems. Although difficult to interpret visually, split-beam sonar can position targets in three-dimensional space creating a “fish track” from a set of temporally and spatially correlated returning echoes representing a single fish within the beam (Simmonds and MacLennan 2005). Fish tracks provide information about directional movement, swimming speed, and target strength, a measure of acoustic reflectivity that potentially can be used to estimate fish size or provide insight to species composition (Ehrenburg and Torkelson 1996; Ransom et al. 1998). Multibeam sonar systems on the other hand, such as dual-frequency identification sonar (DIDSON; Sound Metrics Corporation, Lake Forest, Washington), capture high resolution, video-like images (Belcher et al. 2001). Dual-frequency identification sonar operates in either high frequency (1.8 MHz) or low frequency (1.1 MHz); the former has a shorter range (<15 m) but better image quality. Advantages of DIDSON are a large beam width compared with traditional split-beam sonar systems, ease of visual interpretation of data, the ability to capture images containing both substrate and fish, and the ability to measure fish during postprocessing (Holmes et al. 2006; Boswell et al. 2008; Burwen et al. 2010; Hightower et al. 2013).
Despite advances in hydroacoustic technology, species identification remains a challenge for most hydroacoustic assessments. Fish targets can sometimes be identified to species if targets exhibit distinguishable characteristics such as target strength, body morphology or size (i.e., length), migration timing, or position in the water column. Many river systems however, contain multiple migratory species that overlap biologically (e.g., body length and run timing) and acoustically (e.g., target strength), making it difficult to assign species-specific abundance estimates. A standard approach is to use additional sampling (e.g., electrofishing or gill netting) to obtain species composition information that can help describe hydroacoustic data and verify targets (Simmonds and MacLennan 2005).
The Roanoke River is a major river in the mid-Atlantic region of the U.S East Coast and supports populations of several anadromous fish species including Striped Bass Morone saxatilis, American Shad Alosa sapidissima, Hickory Shad A. mediocris, Alewife A. pseudoharengus, Blueback Herring A. aestivalis, and semianadromous White Perch M. americana. Striped Bass support a commercial fishery in Albemarle Sound and a world-renowned recreational fishery in the Roanoke River and were estimated at record abundance in 2008 (Takade-Heumacher 2010). American Shad and river herring (Alewife and Blueback Herring combined) supported large fisheries in the late 1800s, but are currently at a fraction of their historical abundance despite restoration efforts (Walburg and Nichols 1967; Hightower et al. 1996; ASMFC 2007). The North Carolina Division of Marine Fisheries (NCDMF) implemented a moratorium on recreational and commercial harvest of river herring in 2007. Declines of anadromous fishes in the Roanoke River have been attributed to excessive fishing, loss of spawning habitat due to the establishment of hydroelectric dams, and poor water quality (Walburg and Nichols 1967; Winslow 1990). Primary spawning grounds of American Shad and Striped Bass are located at Roanoke Rapids (217 river kilometers [rkm]) and Weldon (209 rkm) respectively, and are situated just downstream from Roanoke Rapids Dam (rkm 221), which acts as a migration barrier for upstream-migrating fish. The Federal Energy Regulatory Commission (FERC) license for Roanoke Rapids Dam calls for additional restoration efforts, such as fish passage, to be considered for American Shad once two annual run-size estimates exceed 20,000.
This study is the final stage in 8 years of hydroacoustic monitoring on the Roanoke River. The previous studies (2004–2005: Mitchell 2006; 2006–2007: Magowan 2008; 2008–2009: Waine 2010) showed the potential of hydroacoustic monitoring, but improvements in spatial coverage and species allocation of sonar counts were needed. Our objectives were to build on previous studies, but in doing so incorporate multiple DIDSON deployments to obtain reliable estimates of spawning run size for the suite of anadromous fishes.
METHODS
Study site.
Our study site, located near Williamston, North Carolina (rkm 64), experiences laminar flow (minimizing milling behavior of fishes) and in general exhibits preferred characteristics for fixed-location hydroacoustics (Enzenhofer and Cronkite 2000); however, acoustic “blind spots” were a concern due to river bottom unevenness along the gentler sloping east bank. At flood stage, the channel reached a maximum depth of approximately 11 m and width of 80 m. Sample seasons were February 24 to May 20, 2010, and March 1 to May 20, 2011, but due to logistical reasons, some sampling gears had slightly different start dates.
Hydroacoustic monitoring.
We deployed a 430-kHz Biosonics split-beam echosounder (Biosonics, Seattle) with a 7° circular transducer, mounted on a fixed H-frame, on the east bank of the river aimed across the channel perpendicular to the flow. Sound transmission was pulsed at 10 pings/s using a pulse width of 0.2 ms and a sensitivity threshold of −70 decibels (dB) for returning echoes. Data collection using Visual Acquisition software (version 6.0, Biosonics) occurred continuously in both sample years, except during equipment maintenance or sonar malfunction. A 30-m range was used, and a fence-weir of 5-cm-square construction fencing was installed 1–1.5 m beyond the split-beam transducer to prevent fish from swimming behind the transducer. The sonar was aimed close to the river bottom in 2010 but farther off bottom in 2011 to eliminate bottom reverberation (Figure 1).
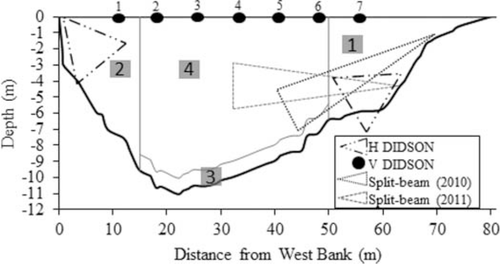
Approximate sonar placement in 2010 and 2011 in the Roanoke River at river flood stage. River strata (1–4) for data analysis are illustrated by grey solid boundaries. For display purposes, vertical (V) DIDSON locations are represented by black ovals numbered 1-7 (beams not drawn); H DIDSON = horizontal DIDSON.
A standard DIDSON, operated in high frequency (1.8 MHz), was used in vertical- (2010 and 2011) and horizontal-aspect (2011) deployments. Settings were adjusted to maximize frame rate (7–10 frames/s) and field of view (window start, 0.42–2.5 m; window length, 5–10 m). A spreader lens provided a field of view of 29° horizontal × 28° vertical. Following Waine (2010), vertical deployment assessed cross-channel and off-bottom distributions of upstream migrants at seven cross-channel locations spaced 10 m apart and aimed perpendicular to the river bottom (1, 2). We sampled each location during daylight hours for 10 min, 5 d/week, except during lightning storms and unavailability (interagency use). Sample times were randomly selected in 2010 but restricted to midday in 2011, revolving around horizontal-aspect DIDSON monitoring protocol. Our horizontal DIDSON deployment monitored nearshore regions (<15 m) on a subset of days and hours in 2011. We angled the DIDSON along the bank slope so bottom edges of beams grazed the river bottom for the entire window length (1, 2). The DIDSON was mounted on a tripod and monitored the east bank over weekends and during at least one week night from March 2 to May 20, 2011. A fence-weir extended 2.6 m beyond the DIDSON unit on the east bank. We mounted the DIDSON on a boat (pole-mount; Hughes 2012) to monitor the west bank during daylight hours, 5 d/week, for a minimum 4 h/d, alternating samples daily between mornings and afternoons from March 8 to May 20, 2011.
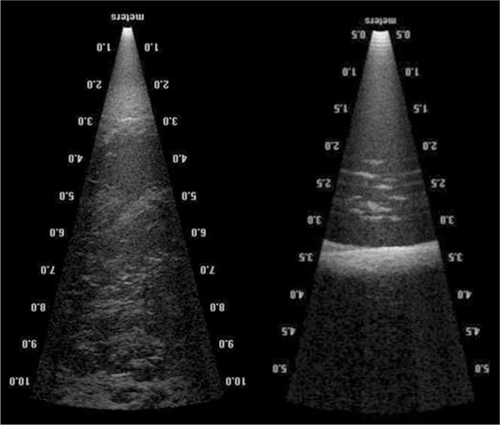
Images of horizontal DIDSON monitoring on the west bank (left image) and vertical DIDSON monitoring (right image) in the Roanoke River during 2011.
Acoustic data processing.
Sonar results and analysis were restricted to upstream-migrating fish only. Split-beam data files were postprocessed in Echoview software (version 5.1, Myriax Software, Hobart, Tasmania, Australia). File processing was automated using Echoview's scripting module and built-in fish tracking. We manually processed vertical DIDSON data using Sound Metrics DIDSON Control and Display software version 5.23. We used the fish measuring tool (Mark Fish command) to measure fish TL and range from the sonar. Echoview's scripting module was used to process horizontal DIDSON data by using an Echoview template similar to that of Boswell et al. (2008) and with a 20-cm-minimum TL threshold (Hughes 2012).
We tested for over- or undercounting bias using linear regression by comparing automated and manual fish counts from a subset of files for each sonar type, deployment strategy, and year. For cases where the estimated slope ±2 SE did not include 1.0, we refitted the regression with no intercept to produce a correction factor to adjust each day's automated counts. Data were excluded from analysis when linear regression indicated no significant relationship (P > 0.05) between automated and manual counts. Manual counts were done for two split-beam files per week and 5-min subsets from two or three horizontal DIDSON files per week.
Species composition.
Boat electrofishing and gill nets were used to obtain fish species composition data at sites approximately 1–3 rkm upstream from our sonar site. We sampled two shoreline transects by using boat electrofishing during morning or afternoon hours for 900 s each, 5 d/week, and calculated CPUE as fish/h. Five bottom-set gill nets were deployed 3 d/week (0.5–1.0 h soak time) from March 1 to May 20, 2010, to sample near-bottom regions with higher proportions of upstream-migrating fish (Waine 2010). Nets measured 2.5 m deep and 46 m long, and had a stretched-mesh size of 7, 9, 10, 11.5, or 14 cm. Bottom-set gill-net CPUE was calculated as fish/h. We used drift gill nets 5 d/week in 2011, conducting two 200-m passes per mesh size (7.3 m depth, 23 m length; 7, 9, 10, and 14 cm stretch mesh), and calculated CPUE as the combined catch from the eight drifts, divided by two to account for the two drifts per mesh. Sex and reproductive stage of targeted anadromous fishes were determined by applying slight pressure along the abdomen (Acolas et al. 2006). Reproductively spent (postspawn) anadromous fishes were classified as out-migrating and not included in the catch.
Run-size estimates.


 was the sum over strata of expected counts, expanded for the area of the ith sample (year y, day d, stratum s; Ay,d,s) and 24 h:

We used an uninformative uniform prior distribution (interval 0–10) for τ, the precision (1/variance) of the normal distribution of random day effects. The prior distribution for δ was an uninformative uniform distribution with an interval −1 to 1. An uninformative normal distribution with of mean 0 and variance of 1 × 10⁶ was used for the stratum effect β. To make fixed effects identifiable, one level for β was set to 0.0 (stratum 4 in 2010) and vertical DIDSON was assigned a gear multiplier value of 1.0 in all strata (Kéry 2010). An uninformative beta distribution was used for other sonar gears in strata where they occurred. For a day with no sonar counts (April 17, 2011), the average split-beam count per square meter from 3 d before and after were used. Our primary analysis used all three sonar types, but for comparison we also obtained estimates using only vertical DIDSON and split-beam and vertical DIDSON only. These analyses provided insight into the gains in precision from increased monitoring and the use of multiple sonar deployments.
Species- or group-specific estimates of run size were obtained using a multinomial distribution using seven categories: Alewife, American Shad, Blueback Herring, Hickory Shad, Striped Bass, White Perch, and other. Species proportions were estimated using weekly samples from electrofishing and gill netting. For each week, one parameter was used to estimate the proportion of “other” species (versus anadromous species), and six parameters represented the anadromous species proportions. An uninformative beta distribution was used for the proportion of “other” species. Prior distributions for anadromous species proportions were obtained using a Dirichlet distribution and total catches from the NCDMF fishery-independent gill-net survey in western Albemarle Sound. Only monthly sample data were available from the NCDMF survey, and because there is a time lag between when species are present in the western sound and in the lower Roanoke River, each weekly prior distribution was based on NCDMF catches shifted forward in time to best match our weekly species composition. Because of low sample sizes from species composition sampling at the sonar site, NCDMF catches were reduced by a factor of eight. This divisor was chosen arbitrarily, but it reduced NCDMF sample sizes to a magnitude similar to our in-river samples, allowing higher catches from in-river sampling to have a major influence on model estimates. Thus, the NCDMF data supplemented and stabilized run-size estimates but did not dominate the model when in-river sampling provided moderate to large sample sizes (Hughes 2012).
To assess American Shad restoration efforts and FERC relicensing agreements, a “step” function in the OpenBUGS analysis was used to determine the probability of American Shad run-size estimates being greater than 20,000. Our model used two independent Markov chain Monte Carlo (MCMC) chains, each with 100,000 iterations. Gelman–Rubin statistics, automatically calculated within OpenBugs, suggested convergence of the independent MCMC chains (R ratio < 1.05) after 1,500 iterations. For our results we used a burn-in of 10,000 iterations to ensure posterior distributions from MCMC chains had converged and stabilized.
RESULTS
Hydroacoustic Monitoring
The highest corrected counts of fish migrating upstream were from horizontal DIDSON and split-beam sonar monitoring (Table 1). Horizontal DIDSON covered relatively high percentages of the two shoreline strata, whereas high counts from the split-beam sonar resulted from its continuous operation. Vertical DIDSON counts were low in comparison, because of the small percentage of the cross-sectional area covered in nearshore strata and comparatively low total effort. Due to bad weather and interagency shared use of the DIDSON, vertical DIDSON missed 10 d in 2010 and 6 d in 2011.
| Year | Stratum | Sonar gear | % coverage | Total effort (h) | Corrected count |
|---|---|---|---|---|---|
| 2010 | 1 | Vertical DIDSON | 7 | 9 | 191 |
| 1 | Split-beam | 21 | 1,931 | 116,927 | |
| 2 | Vertical DIDSON | 6 | 9 | 132 | |
| 3 | Vertical DIDSON | 50 | 44 | 120 | |
| 4 | Vertical DIDSON | 18 | 44 | 49 | |
| 4 | Split-beam | 13 | 1,931 | 38,050 | |
| 2011 | 1 | Vertical DIDSON | 6 | 9 | 327 |
| 1 | Split-beam | 13 | 1,826 | 27,709 | |
| 1 | Horizontal DIDSON | 61 | 851 | 195,886 | |
| 2 | Vertical DIDSON | 4 | 9 | 448 | |
| 2 | Horizontal DIDSON | 33 | 205 | 54,524 | |
| 3 | Vertical DIDSON | 49 | 44 | 634 | |
| 4 | Vertical DIDSON | 19 | 44 | 174 | |
| 4 | Split-beam | 18 | 1,826 | 61,394 |
DIDSON monitoring provided detailed information about upstream migrants. Fish observed in vertical DIDSON monitoring had a median distance off bottom of 0.17 m in 2010 and 0.30 m in 2011. Cross-channel distribution indicated 67% and 49% of the fish observed were in the outermost sample locations during 2010 and 2011, respectively. Fish TL was 33.3 ± 0.4 cm (mean ± SE) in 2010 and 33.4 ± 0.3 cm in 2011 vertical DIDSON measurements, compared with 2011 estimates of 37.4 ± 0.02 cm on the east bank and 38.2 ± 0.1 cm on the west bank made from horizontal DIDSON (Echoview-generated) monitoring. Length-frequency distributions between both banks (horizontal DIDSON) and between years (vertical DIDSON) were similar to length-frequency distributions of electrofishing samples, peaking at 25–30 cm but indicating a higher percentage of smaller-sized fish than that from gill-net methods (Figure 3).
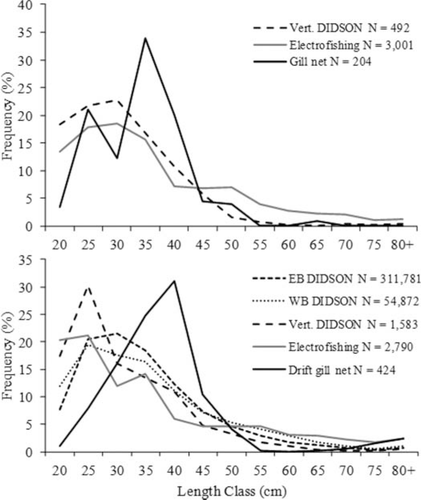
Length-frequency distribution for fish from 2010 sample gear and vertical (Vert.) DIDSON (top panel) and 2011 sample gear, east bank (EB), west bank (WB) and Vert. DIDSON (bottom panel). East and west bank DIDSON measurements were automated within Echoview processing.
Acoustic Data Processing
There was not a statistically significant difference between automated counts and inspected manual counts for split-beam files (n = 26 and 24 files in 2010 and 2011, respectively) or for west bank DIDSON files (n = 22 subsamples of 5 min each; Figure 4). However, automated east bank DIDSON counts were not related to manual counts (n = 18 subsamples of 5 min each; Figure 4) during a period of low water (March 1–11, 2011), apparently due to large schools of milling fish; therefore, these count data were excluded from analysis. Milling behavior was not observed during the remainder of the season, but linear regression suggested an overcounting bias of automated counts compared with manual counts (n = 30 subsamples of 5 min each; Figure 4). We refit the regression, resulting in a slope (correction factor) of 0.775, which was applied to daily automated counts from east bank DIDSON monitoring from March 12 to May 20, 2011.
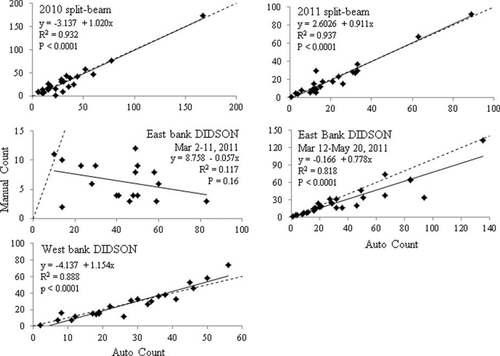
Linear regression of automated counts (Echoview fish-tracking algorithm) versus manual counts from split-beam sonar and horizontal DIDSON data in the Roanoke River during 2010 and 2011. Dotted line represents the one-to-one line and the black line represents fitted regression.
Species Composition
We captured 3,006 fish (22 species) by electrofishing in 2010 and 2,626 fish (25 species) during 2011. Target anadromous species comprised 47% and 46% of total electrofishing catches in 2010 and 2011, respectively. Our bottom-set gill nets in 2010 captured 204 fish (16 species) with a daily mean CPUE of 1.0 fish/h. We captured 424 fish (16 species) with drift gill nets in 2011 with a daily mean CPUE of 3.8 fish/drift-set. Anadromous species made up 28% of the bottom-set gill-net catch (2010) and 58% of the drift gill-net catch (2011), but this variation had less than 2% influence on the total proportion of anadromous species because of the much larger electrofishing collections. In general, species composition sampling observed a general progression of spawning runs beginning with Hickory Shad, followed by Alewife, White Perch, Blueback Herring, Striped Bass, and American Shad (Figure 5).
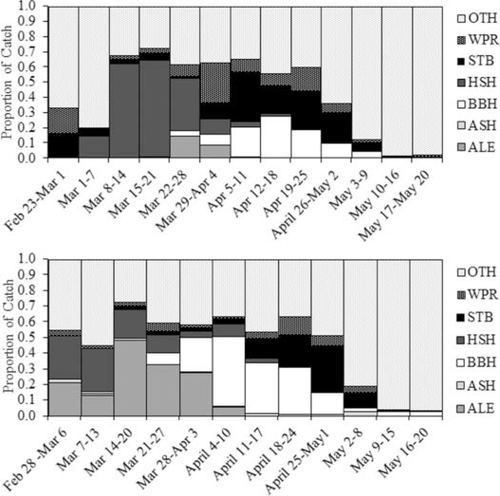
Proportion of species captured in all gear by week in 2010 (top panel) and 2011 (bottom panel) in the Roanoke River. Species abbreviations: ALE = Alewife, ASH = American Shad, BBH = Blueback Herring, HSH = Hickory Shad, STB = Striped Bass, WPR = White Perch, and OTH = other.
Run-Size Estimates
We estimated 2.5 and 3.6 million upstream migrants during the spring monitoring periods of 2010 and 2011, respectively, based on our analysis using all three sonar deployments (Table 2). Precision was generally similar for an analysis of vertical DIDSON and split-beam data, but much poorer when only vertical DIDSON data were analyzed (Figure 6).
| Species | Median estimate | 95% CI |
|---|---|---|
| 2010 | ||
| Alewife | 214,300 | 190,800–240,100 |
| American Shad | 19,510 | 14,190–26,450 |
| Blueback Herring | 210,100 | 192,600–228,800 |
| Hickory Shad | 183,300 | 160,500–208,200 |
| Striped Bass | 354,200 | 328,800–381,300 |
| White Perch | 326,600 | 299,600–355,700 |
| Other | 1,210,000 | 1,142,000–1,282,000 |
| Total run size | 2,519,000 | 2,441,000–2,605,000 |
| 2011 | ||
| Alewife | 268,700 | 241,200–298,100 |
| American Shad | 29,010 | 21,550–38,340 |
| Blueback Herring | 456,900 | 413,900–502,700 |
| Hickory Shad | 131,800 | 113,300–152,500 |
| Striped Bass | 550,900 | 502,900–601,700 |
| White Perch | 361,700 | 326,000–399,900 |
| Other | 1,844,000 | 1,716,000–1,974,000 |
| Total run size | 3,645,000 | 3,420,000–3,868,000 |
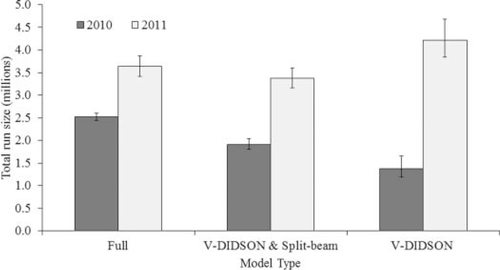
Total run-size estimates and 95% credible intervals (lower [2.5%] and upper [97.5%] bounds) from an analysis using all three sonar deployments compared with vertical DIDSON (V-DIDSON) and split-beam sonar data and only V-DIDSON data.
Run-size estimates for anadromous species in 2010 were highest for Striped Bass and White Perch followed by Alewife and Blueback Herring (Table 2). Estimates in 2011 were highest for Striped Bass, followed by Blueback Herring, White Perch, and Alewife (Table 2). The estimated probability of an American Shad run size of less than 20,000 was 0.56 ± 0.50 (mean ± SD) in 2010 and 0.008 ± 0.09 in 2011.
The split-beam gear multiplier was estimated at 0.35 in stratum 1 and 1.00 in stratum 4, relative to vertical DIDSON (fixed at 1.00), suggesting split-beam sonar was far less effective in detecting upstream migrants than vertical DIDSON in stratum 1, but similar in stratum 4 (Table 3). Horizontal DIDSON was estimated to be as efficient as vertical DIDSON in stratum 1, but moderately less so in stratum 2 (Table 3). The model indicated pronounced differences among cross-channel strata. The highest numbers of upstream migrants per unit area were observed for the two nearshore strata followed by stratum 3 then stratum 4 (log-scale effect fixed at 0.00 in 2010).
| Parameter | Stratum | Median estimate | 95% CI |
|---|---|---|---|
| Split-beam sonar | 1 | 0.35 | 0.34–0.35 |
| Horizontal DIDSON | 1 | 1.00 | 0.99–1.00 |
| Horizontal DIDSON | 2 | 0.65 | 0.59–0.72 |
| Split-beam sonar | 4 | 1.00 | 0.99–1.00 |
| Stratum, 2010 | 1 | 2.90 | 2.90–2.92 |
| 2 | 1.55 | 1.37–1.71 | |
| 3 | 0.32 | 0.13–0.49 | |
| Stratum, 2011 | 1 | 0.65 | −0.60–2.26 |
| 2 | 1.60 | 0.36–3.22 | |
| 3 | 0.27 | −1.00–1.87 | |
| 4 | −1.56 | −2.81–0.05 |
There was substantial daily variation in run-size estimates (Figure 7). Pulses generally corresponded to the timing of spawning runs: for example, Hickory Shad in mid-March 2010 (Figure 5). Daily variation did not appear to be correlated with changes in river stage within years (Figure 7).
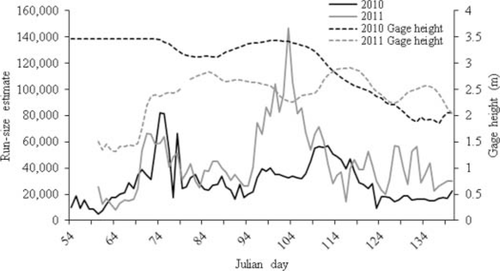
Daily (day of the year [Julian day]) hydrograph of modeled run-size estimates from hydroacoustic monitoring and river stage in the Roanoke River during 2010 and 2011. Data are from U.S. Geological Survey gauge number 02081054 located near Williamston, North Carolina.
DISCUSSION
Hydroacoustic Monitoring
Hydroacoustics can be a valuable tool for estimating population size of anadromous fishes, but there are technical considerations. For the Roanoke River, these challenges included unfavorable channel morphology, fluctuating water levels, excessive suspended and embedded debris, and multiple species overlapping in size and run timing. We were unable to monitor both banks continuously, which is recommended for bank-oriented migratory fishes (Enzenhofer and Cronkite 2000). The approach we developed is flexible enough to address these challenges.
Vertical DIDSON deployments allow spot-coverage across the river channel and gather important distribution (off-bottom and cross-channel), size, and count data, regardless of the physical characteristics of the river. Spatial results in 2010 and 2011 were consistent with previous Roanoke River hydroacoustic findings, which showed upstream migrants are shore- and bottom-oriented (Magowan 2008; Waine 2010). Our model estimates from both years showed differences between numbers of fish migrating along each bank, illustrating the risk of assuming equal passage rates along both river banks (Daum and Osborne 1998).
Utilizing multiple sonar technologies and deployment strategies allows the assessment of their relative effectiveness. Our results suggest a lower efficiency for split-beam sonar compared with horizontal and vertical DIDSON deployments. The addition of horizontal DIDSON substantially improved coverage of important nearshore regions. Lower efficiency of split-beam sonar versus horizontal DIDSON in the nearshore region (i.e., <10 m range) is expected due to the narrow beam width of the split-beam sonar (Maxwell and Gove 2007). For example, at a range of 10 m, our split-beam sonar had a beam width of 1.2 m compared with 5 m for the DIDSON. In this near-range, determining direction of travel is often unattainable for fish larger than the beam itself, potentially leading to an undercounting bias by split-beam sonar (Maxwell and Gove 2007). Also, the narrow beam width would reduce the odds of detecting enough return echoes in a series to qualify as a fish track. Presence of “blind spots” near the bottom, caused by bank slope unevenness, is another concern with split-beam monitoring, which is less of a factor with multibeam sonars (Daum and Osborne 1998; Xie et al. 2005; Holmes et al. 2006). Effectiveness of horizontal DIDSON deployment was less than vertical DIDSON in stratum 2, likely due to the lack of background clutter in the vertical deployment (Figure 2), making fish detection easier and less prone to missing fish that are indistinguishable from bottom substrate (e.g., slow moving). We recognize these two deployments were not operated simultaneously and future trials monitoring known numbers of fish would be beneficial for deployment comparison.
Variables such as target strength, spatial or temporal differences, size differences, or even tailbeat patterns can occasionally be used to identify fish to species (Love 1977; Simmonds and MacLennan 2005; Burwen et al. 2010; Mueller et al. 2010). More commonly, however, physical sampling or visual confirmation is necessary to accurately apportion hydroacoustic data to species (Pedersen and Boettner 1992; Hartman et al. 2000; Baldwin and McLellan 2008; Kucera 2009). Our gill-net and electrofishing sampling captured the progression of anadromous spawning runs. Peaks in CPUE for anadromous fishes corresponded with peaks in hydroacoustic counts, supporting our method of apportioning counts by species composition sampling (Hughes 2012). In both years, low catches of anadromous fishes towards the end of the season corresponded with lower hydroacoustic counts. Although we captured the progression of migratory species, the precision of proportions of each species may be biased due to gear and size selectivity for different species. We pooled weekly species composition data to increase sample size and to reduce size- and species-selectivity, but undoubtedly some gear biases remain. Incorporating NCDMF netting data as prior information for species composition within our model was effective in reducing uncertainty caused by gear selectivity or low and variable sample sizes. Having prior information helped stabilize species-specific run-size estimates when in-river catches were low but had much less influence during peaks in run size when in-river catches were high. Potential improvements in this approach would be to obtain data on a finer time scale (i.e., weekly or daily) and incorporate a time-series analysis to estimate the appropriate lag (rather than basing it on inspection).
Multibeam technology provides the capability to estimate fish length directly, which can potentially be used for discrimination between species (Burwen et al. 2010). Vertical- and horizontal-aspect DIDSON techniques produced length-frequency distributions similar to those determined from electrofishing, suggesting DIDSON is capable of providing representative length measurements, which can be extracted manually as well as through an automated processing scheme such as Echoview. Other studies have found DIDSON-derived length distributions to be representative of sampling data as well as accurate for individual fish (Burwen et al. 2010; Crossman et al. 2011; Hightower et al. 2013). In our study, DIDSON length distributions showed a higher proportion of small fish (<35 cm) compared with gill-net samples, but this is most likely a result of gear selectivity or smaller fish migrating in areas where gill nets did not sample (i.e., along shoreline). Study-specific ground-truthing or in situ trials using fish of known lengths at different ranges would be necessary for application to species-specific apportioning of hydroacoustic counts based on sonar length data.
Fixed-location hydroacoustic monitoring has traditionally been used for anadromous species in rivers with gentle sloping banks. Our design, however, should also be applicable to potamodromous species and less favorable river morphology. The combination of split-beam sonar and DIDSON offers design flexibility and can aid in identification for some species, whether based on size or body morphology. For example, Auer and Baker (2007) used fixed-location split-beam sonar to estimate spawning stock of Lake Sturgeon Acipenser fulvescens but noted the inability to visually validate assumed Lake Sturgeon targets due to turbid water. Multibeam sonar (e.g., DIDSON) offers the ability to capture video-like imagery in turbid or dark environments unlike conventional underwater videography and directly measure targets as a possible identification mechanism (Belcher et al. 2001; Hightower et al. 2013). Our Bayesian framework would be beneficial to studies, such as Auer and Baker (2007), as it easily incorporates multiple sonar methods. Crossman et al. (2011) noted range limitations of DIDSON while monitoring White Sturgeon A. transmontanus below known spawning areas. Vertical DIDSON monitoring at cross-channel locations may address those range limitation concerns and provide a noninvasive technique for estimating the spawning run size of White Sturgeon or other large river fishes.
Run-Size Estimates
The combination of counts from multiple sonars, modeled using a Bayesian framework that accounted for gear and spatial (stratum) differences, suggests run sizes in the Roanoke River are much larger than previously reported (Mitchell 2006; Magowan 2008; Waine 2010). Although total run-size estimates varied between years (2010 and 2011), there were approximately 1 million more individuals than in previous years (2004–2009). Comparisons with prior estimates (2004–2009) may be misleading because those estimates did not include side-aspect DIDSON monitoring of the nearshore zone, where the highest densities of upstream migrants are found, and were based solely on split-beam data with no adjustment for gear bias (2004–2007). Estimates for 2008–2009 (Waine 2010) adjusted for the lower effectiveness of split-beam sonar, but did not include horizontal DIDSON, which we found to be more effective than split-beam sonar in the nearshore region.
Fish passing just beyond the weir in the nearshore region were likely difficult to detect in split-beam monitoring due to the small beam diameter at close range. Split-beam counts per unit area were much less than vertical DIDSON counts in the nearshore stratum, but were very similar to vertical DIDSON in the midchannel stratum where the split-beam sonar's beam width is much greater than it is in its nearshore region. This further illustrates the value of a large beam width provided by horizontal DIDSON in the nearshore stratum. Additional evidence that split-beam monitoring is less effective in the first few meters is in the spatially explicit plots for 2008–2009 monitoring, which showed the highest split-beam densities were several meters offshore (Waine 2010).
The total run-size estimates for 2010–2011 were relatively precise compared with the previous Bayesian model (2008–2009 results: Waine 2010). The improved precision may be due to stratifying the river cross section into broad zones with consistent relative densities of fish (e.g., high, medium, low). Stratification should reduce uncertainty by having more consistent counts within strata (compared with among strata). Waine (2010) also modeled spatial patterns of upstream migrants but used a finer scale (1 × 2-m cells) and estimated parameters for distance offshore and off the bottom. Our estimates of stratum effect (spatial distribution) were consistent with previous years (Magowan 2008; Waine 2010). Another factor that might account for improved precision in 2010–2011 is the addition of horizontal DIDSON monitoring. This gear covered a high percentage of the nearshore strata exhibiting greatest fish passage (strata 1 and 2). Run-size estimates varied when sonar data sets were excluded, but there was an overall trend of lower precision when horizontal DIDSON and split-beam data were excluded (Figure 6). Although the cost of additional sonar equipment is a major factor to consider, further improvements in precision would be expected from a balanced design with all three sonar deployments used continuously in all strata or an increased DIDSON monitoring effort.
Run-size estimates for Striped Bass in 2010 and 2011 (354,200 and 550,900, respectively) were much greater than previous hydroacoustic estimates (range, 118,778–226,094) (Mitchell 2006; Magowan 2008; Waine 2010). Our estimates were lower than those reported for age-3+ Striped Bass (2010: 483,000; 2011: 610,000) in the most recent assessment for the Albemarle Sound–Roanoke River (A–R) stock, based on a forward-projecting catch-at-age model with fishery-dependent and fishery-independent data (Mroch and Godwin 2014). Some uncertainties when interpreting our estimates relative to the A–R assessment results are the proportion of Striped Bass that spawns annually and the proportion of the A–R stock that spawns in the Roanoke River. Anything less than 100% would reduce the gap between our estimates and predicted run size based on the assessment results. Olsen and Rulifson (1992) and Boyd (2011) estimated more than 95% of A–R Striped Bass of age 4+ to be sexually mature, but Boyd's (2011) estimate of 29% for mature age-3 bass was roughly 20% lower than the Olsen and Rulifson (1992) estimate. Boyd (2011) also suggested that 12–13% of mature age-3 and age-4 A–R Striped Bass do not contribute to the spawning population in a given year, compared with 96% at age 5 and 100% at ages 6+.
Our run-size estimates for American Shad (19,510–29,010) were greater than all but one previous year of hydroacoustic monitoring on the Roanoke River (35,483 ± 4,936 [mean ± SE] in 2006: Magowan 2008). Higher estimates for 2010–2011 are likely due to increases in total run size based on accounting for gear bias and improved species composition estimates using both in-river and NCDMF samples. In-river collections of American Shad have been very low and variable throughout the 8-year hydroacoustic study and run-size estimates for 2004–2009 have varied accordingly. However, North Carolina Wildlife Resources Commission CPUE estimates for American Shad at Roanoke Rapids suggest that the population has remained relatively stable (Wynne et al. 2011), a finding consistent with other population estimates (Harris and Hightower 2012). The FERC license agreement for Roanoke Rapids Dam requires that additional restoration efforts (such as fish passage) for American Shad be considered if two annual run-size estimates exceed 20,000. The probability of a run size of less than 20,000 individuals was 0.56 in 2010 but was only 0.008 in 2011.
No direct stock assessment or population monitoring is conducted for river herring, Hickory Shad, or White Perch in the Roanoke River, making reliability of our estimates difficult to assess. High 2010–2011 estimates of White Perch run size relative to previous years may be a reflection of high abundance in NCDMF catches. White Perch are more of an estuarine, semianadromous species with an unknown portion of the population migrating past our sonar site to spawn. If a species (e.g., White Perch) is represented as a higher percentage of catch in Albemarle Sound data than from in-river sampling, our model would underestimate other anadromous species’ abundance. Further investigation into the proportion of White Perch migrating past our sonar site would help in determining whether White Perch run size is overestimated (and whether other species are underestimated).
Our combination of split-beam sonar and vertical- and horizontal-aspect DIDSON deployments offers an effective and widely applicable strategy to monitor migratory fish in river systems not well suited for traditional sonar monitoring. These strategies, along with modeling gear effectiveness by stratum, considerably increased the magnitude and precision of our run-size estimates and illustrate advantages of multiple sonar deployments. Our species-specific estimates provide a reference point for future abundance estimates and inform managers of in-river status of important recreational species. Species of conservation importance, such as endangered species, may also benefit from these noninvasive methods, because of the likelihood of restrictions on physical sampling (e.g., Damon-Randall et al. 2010; Kahn and Mohead 2010). Apportioning hydroacoustic counts by species continues to be an area of needed improvement. Hydroacoustic studies that have inefficient species sampling or relatively few species with distinguishable physical attributes should investigate size-stratified abundance estimates using sonar-derived length estimates as a potential method for improving allocation of sonar counts among species.
Our study will aid in harvest management of Striped Bass, assist managers in assessing American Shad restoration efforts as part of FERC relicensing agreements, and serve as the only current abundance estimates for river herring, Hickory Shad, and White Perch in the Roanoke River. Methods used in this study are applicable to other large rivers in need of anadromous, or even potamodromous, monitoring programs.
ACKNOWLEDGMENTS
Funding for this project was provided by Dominion Power Company and the North Carolina Wildlife Resources Commission. We thank fisheries technicians Joshua Ashline and Jacob Johnson for field assistance, Anna-Marie Mueller and Don Degan of Aquacoustics for hydroacoustic training and guidance, and Charlton Godwin of North Carolina Division of Marine Fisheries for providing monthly catch data from netting surveys. This manuscript benefited from the comments of Carolyn Griswold and two anonymous reviewers. The Cooperative Fish and Wildlife Research Unit is jointly supported by North Carolina State University, North Carolina Wildlife Resources Commission, U.S. Geological Survey, U.S. Fish and Wildlife Service, and Wildlife Management Institute. Any use of trade, firm, or product names is for descriptive purposes only and does not imply endorsement by the U.S. Government. Sampling was conducted under Institutional Animal Care and Use Committee protocols 08-008-O and 11-037-O.


