Relationship of Glycosyltransferases and mRNA Levels to Ganglioside Expression in Neuroblastoma and Melanoma Cells
Abbreviations used : C, chloroform ; β1,4-GalNAc-transferase, β1,4-N-acetylgalactosaminyltransferase ; M, methanol ; PBS, phosphate-buffered saline ; SDS, sodium dodecyl sulfate.
Abstract
Abstract : Most human neuroblastoma tumors are characterized by the high expression of GD2 (or GD2 and/or GM2) gangliosides, whereas melanomas characteristically express GD3 ganglioside. The molecular basis for these patterns was investigated by examining the relationship between ganglioside levels, glycosyltransferase (GM2/GD2 synthase and GD3 synthase) activity, and corresponding mRNA levels in a panel of human neuroblastoma and melanoma cell lines. In general, the ganglioside patterns could be explained by the levels of the transferases and their mRNA, indicating control at the level of transcription. A key role was noted for GD3 synthase. Notably, it was found that neuroblastoma cell lines with high GD2 ganglioside levels had low levels of GD3, its synthase, and mRNA for the enzyme even though this step provides the substrate for GD2 synthesis. The key role for GD3 synthase was also examined by stably transfecting GD3 synthase cDNA into a neuroblastoma cell line (SH-SY5Y) not expressing GD3 and GD2. The resulting cell line had high levels of GD2 ganglioside and altered morphology and growth characteristics.
Patterns of ganglioside expression are characteristic of a particular cell type. Moreover, ganglioside expression changes during development and differentiation in many tissues and organs. This has been best illustrated by studies on the brain and nervous system. Such changes presumably reflect the functional roles played by gangliosides and their involvement in such biological functions as adhesion, cell-cell interactions, and proliferation, but this is as yet poorly understood. In addition to changes occurring during normal development, specific alterations in ganglioside expression have also been noted following malignant transformation, particularly in tumors of neural crest-derived tissues (for reviews, see Hakomori, 1984 ; Lloyd and Furukawa, 1998). For example, in malignant melanoma GD3 levels are considerably enhanced (Pukel et al., 1982 ; Thampoe et al., 1989), and in neuroblastomas GD2 is a predominant component (Saito et al., 1985 ; Ruan and Lloyd, 1992). These changes are thought to be involved in some of the characteristic biological properties of tumor cells, such as proliferation and metastasis.
Neuroblastoma and melanoma cell lines provide useful models for studying ganglioside expression and the enzymatic and molecular basis for tissue- and tumor-specific expression. Progress in this area has been greatly aided by the recent cloning of the cDNAs coding for many of the glycosyltransferases involved in ganglioside biosynthesis, including GM2/GD2 synthase (EC 2.4.1.92) and GD3 synthase (EC 2.4.99.8) (Table 1). In earlier studies (Ruan and Lloyd, 1992), we classified melanoma and neuroblastoma cell lines into four groups according to their ganglioside content and patterns of enzyme activities (Table 2). Further analysis of these parameters and the mRNA levels of the corresponding glycosyltransferases has confirmed the important role played by GD3 synthase in determining the characteristic ganglioside profiles of melanoma and neuroblastoma cells. The role of GD3 synthase was also studied by examining the effect of introducing GD3 synthase into a neuroblastoma cell line (SH-SY5Y) not expressing this enzyme.
| Enzyme (synthase) | Enzyme (transferase) | Substrate | Reference (cloning) |
|---|---|---|---|
| GM2/GD2 synthase | β1,4-N-Acetylgalactosaminyltransferase (β1,4-GalNAc-transferase) | GM3/GD3 | Nagata et al. (1992) |
| GD3 synthase | α2,8-Sialyltransferase | GM3 | Haraguchi et al. (1994), Sasaki et al. (1994), Nara et al. (1994) |
| Classification | Ganglioside composition | Representative cell lines |
|---|---|---|
| Group 1 | GM3 ≅ GD3 | SK-MEL-28 (M), MeWo (M) |
| Group 2 | GM3 ≅ GD3 > GM2 > GD2 | SK-MEL-31 (M), SK-MEL-37 (M), LAN-1 (N) |
| Group 3 | GD3 ≪ GM2 ≅ GD2 | SMS-SAN (N), IMR-32 (N), BE-2C (N) |
| Group 4 | GM2 ≅ GD1a | SK-N-MC (NE), SH-EP-1 (N), SH-SY5Y (N) |
MATERIALS AND METHODS
Cell culture
Human neuroblastoma cell lines SH-SY5Y, SH-EP-1, BE-2C, SK-N-MC, IMR-32, and LAN-1 were kindly provided by Dr. June Biedler (Memorial Sloan-Kettering Cancer Center) and have been described (Ciccarone et al., 1989). The human melanoma cell lines, SK-MEL-28, SK-MEL-31, and MeWo used in this study were described by Carey et al. (1979). The conditions of passage, culture, and harvest for these cell lines were described previously (Carey et al., 1979).
Antibodies
Monoclonal antibody R24 (anti-GD3) was purified in our laboratory (Pukel et al., 1982). GMR6 (anti-GM3 ; Kotani et al., 1992), M696 (anti-GM2 ; Shitara et al., 1994), and 3F8 (anti-GD2 ; Saito et al., 1985) were kindly provided by Drs. T. Tai (Metropolitan Institute, Tokyo, Japan), N. Hanai (Kyowa Kakko, Kogyo, Tokyo, Japan), and N. K. Cheung (Sloan-Kettering Institute), respectively. Fluorescein-labeled anti-Ig antibodies for immunocytology were purchased from Southern Biotechnology Associates (Birmingham, AL, U.S.A.). Peroxidase-conjugated anti-Ig antibodies for TLC immunostaining were from Dako Co. (Carpinteria, CA, U.S.A.).
Extraction and purification of gangliosides
Methods for extraction and isolation of gangliosides from cells were described previously (Ruan and Lloyd, 1992). Further purification was carried out to remove the trace contaminants of peptides, nucleotide sugars, and free fatty acids from the isolated ganglioside fractions. In brief, silicic acid beads (2 g ; 200-400 mesh ; Bio-Rad, Richmond, CA, U.S.A.) were washed thoroughly in chloroform (C)/methanol (M)/2.5 M NH4OH (30:60:8), C/M/H2O (30:60:8), and C/M (1:1). The gel was packed and rinsed in C/M (1:1), then in C/M (95:5), and applied to the column. The column was eluted first with 10 ml of this solvent and then with 40 ml of C/M (1:2) for elution of the purified gangliosides.
TLC and immunostaining
TLC of gangliosides was carried out on high-performance TLC plates (Merck EM Division, Gibbstown, NJ, U.S.A.) in C/M/0.2% aqueous CaCl2 (55:45:10). The components (not isolated from equivalent numbers of cells) were visualized by spraying with resorcinol-HCl and their ratios (percentage of total ganglioside) quantified by scanning the plates with a TLC scanner (Shimadzu, GS-930 ; Columbia, MO, U.S.A.). The identify of the individual gangliosides was confirmed further by TLC and immunostaining using the specific antibodies as listed above. The detailed procedures have been described (Furukawa et al., 1985).
Glycosyltransferase assays
The activities of α2,8-sialyltransferase (GD3 synthase) and β1,4-N-acetylgalactosaminyltransferase (β1,4-GalNAc-transferase ; GM2/GD2 synthase) were measured on cell membrane preparations by determining the transfer of 14C-labeled sugars from appropriate sugar nucleotides to exogenous glycolipid acceptors. The optimized conditions of the individual assays and the detailed procedure were described previously (Ruan and Lloyd, 1992).
Northern blot hybridization
Poly(A)+ RNA was isolated from cell pellets by using an mRNA isolation kit (Invitrogen, Carlsbad, CA, U.S.A.). Isolated mRNA was quantified by measuring absorbance at 260 nm, and the measurement was confirmed with a DNA Dipstick Kit (Invitrogen).
For northern blot analysis, mRNA (5 μg) was size-fractionated on a formaldehyde-agarose gel and then transferred onto a nitrocellulose membrane (Optitran BA-S, Schleicher & Schuell, Keene, NH, U.S.A.). The baked and fixed membrane was incubated at 42°C for 3 h in a hybridization buffer consisting of 50% formamide, 10% dextran sulfate, 1% sodium dodecyl sulfate (SDS), 1 M NaCl, and 100 ng/ml denatured salmon sperm DNA (GibcoBRL, Gaithersburg, MD, U.S.A.). To detect GD3 synthase mRNA, the blot was hybridized with a 32P-labeled, 900-bp fragment produced by PCR using α2,8-sialyltransferase-specific primers (Nakano et al., 1996). These probes were radiolabeled with a Random Primed DNA Labeling Kit, and purified with a G-25 Sephadex Quick Spin column (Boehringer Mannheim, Indianapolis, IN, U.S.A.). The blot was washed with 1% SDS/1 × saline-sodium citrate and exposed to Bio-Max film (Kodak, Rochester, NY, U.S.A.) at -70°C for 1-3 days. Each blot was quantified by phosphor-screen imaging using GS 525 Molecular Imager System and GS-363 Molecular Analyst Software (Bio-Rad Laboratories, Hercules, CA, U.S.A.). After stripping with boiling 0.1% SDS, the same blot was also probed with a 1.8-kb BamHI fragment of γ-actin cDNA following the procedures described above.
Transfection of GD3 synthase cDNA into cells
DNA containing the complete α2,8-sialyltransferase coding sequence (Haraguchi et al., 1994) excised from a pCDM8 plasmid by HindIII and NotI digestion was subcloned in sense orientation into a mammalian expression vector, pcDNAI/neo (Invitrogen). For transfection, 1.5 × 10⁵ SH-SY5Y cells in 4 ml of medium were seeded into a 60-mm tissue culture dish and cultured for 48 h at 37°C in a CO2 incubator. Following two washes with serum-free medium, 5 μg of the GD3-T-containing plasmid or pcDNAI/neo (a vector control) formulated with Lipofectin reagent (1:3 ; GibcoBRL) in 2 ml of Opti-MEM (GibcoBRL) was added over the cells and cultured for 15 h. The cells were then cultured in minimum essential medium, supplemented with 10% fetal calf serum, for 24 h. cDNA-transfected clones were selected in a medium containing geneticin (400 μg/ml G418 sulfate ; GibcoBRL) for 2-3 weeks. The surviving cells were subcloned further, and GD3-expressing clones were identified by immunofluorescent staining with monoclonal antibody R24 (anti-GD3). One clone (SH-SY5Y/GD3-T) was subcloned and selected for further study.
Immunofluorescent staining of cells
Cell suspension (1.2 ml) containing 3-6 × 10⁴ cells was evenly distributed into a 60-well Terasaki plate (Nunc Inc., Naperville, IL, U.S.A.). The cells were allowed to grow for 48 h at 37°C in a 5% CO2 incubator. To detect cell-surface antigens, the cells were gently washed twice with phosphate-buffered saline (PBS), pH 7.4, and then fixed with 2% PBS-buffered formaldehyde for 30 min at room temperature. After washes with PBS, the cells were treated with 10 μl of 2% PBS-bovine serum albumin containing 20 μg/ml purified monoclonal antibodies for 1 h, followed by another hour of incubation with 10 μl of fluorescein isothiocyanate-conjugated goat anti-mouse IgG (1:100 dilution ; Southern Biotechnology Associates). After gentle washes with 2% PBS-bovine serum albumin between and after antibody incubations, the cells were finally examined by fluorescent microscopy.
RESULTS
GM2 and GD2 ganglioside expression and transferase and mRNA levels
As reported previously (Ruan and Lloyd, 1992), melanoma tumors and cell lines (group 1) have either no or very low levels of GM2 and GD2 and corresponding β1,4-GalNAc-transferase activity. This group of cell lines, lacking detectable GM2, GD2, and transferase levels, also lacks mRNA for β1,4-GalNAc-transferase as detected by northern blotting (Table 3 and Fig. 1). Melanoma cell lines with moderate levels of GM2 and GD2 (group 2) have appreciable levels of mRNA for β1,4-GalNAc-transferase as detected by northern blotting (Table 3 and Fig. 1. These cell lines had approximately equal levels of the two mRNA species (5.4 and 2.2 kb) coding for this enzyme, or the 2.2-kb species predominated.
| Ganglioside composition a | mRNA expression c | ||||
|---|---|---|---|---|---|
| Cell line | GM2 | GD2 | Enzyme activity b | 5.4 kb | 2.2 kb |
| Group 1 | |||||
| 1. SK-MEL-28 | 0 | 0 | 0 | 1.0 | 1.0 |
| 2. MeWo | 0 | 3 | 68 | 1.0 | 1.0 |
| Group 2 | |||||
| 3. SK-MEL-31 | 16.5 | 33.0 | 131 | 6.3 | 4.0 |
| 4. SK-MEL-37 | 24.5 | 23.0 | 125 | 2.0 | 4.8 |
| 5. LAN-1 | 6.4 | 34.9 | 613 | 2.6 | 10.4 |
| Group 3 | |||||
| 6. SMS-SAN | 28.2 | 26.4 | 612 | 3.7 | 1.4 |
| 7. IMR-32 | 34.4 | 31.7 | 638 | 2.3 | 1.0 |
| 8. BE-2C | 39.6 | 16.8 | 85 | 3.7 | 1.5 |
| Group 4 | |||||
| 9. SK-N-MC | 17.4 | 0 | 58 | 1.3 | 1.5 |
| 10. SH-EP-1 | 35.2 | 0 | 17 | 1.4 | 2.2 |
| 11. SH-SY5Y | 56.2 | 0 | 615 | 4.4 | 2.2 |
- a GM2 and GD2 levels are expressed as percentage of total ganglioside content (Ruan and Lloyd, 1992).
- b Activity of β1,4-GalNAc-transferase, expressed as pmol of donor incorporated into product/mg of membrane protein/h, shows the average of two experiments, with SE values of <5%.
- c Phosphor density of 5.4- and 2.2-kb species of β1,4-GalNAc-transferase mRNA was obtained by northern blot analysis, relative to background of film (1.0), normalized to the γ-actin signal for each sample.
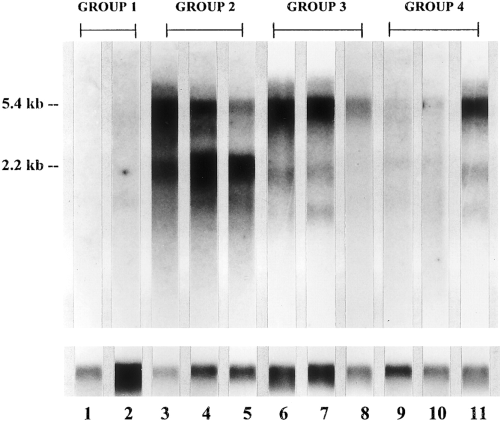
Northern blotting of mRNA from 11 melanoma and neuroblastoma cell lines with 32P-labeled β1,4-GalNAc-transferase cDNA. The cell lines are arranged in the same order as in Table 3:lane 1, SK-ML-28 ; lane 2, MeWo ; lane 3, SK-MEL-31 ; lane 4, SK-ML-37 ; lane 5, LAN-1 ; lane 6, SMS-SAN ; lane 7, IMR-32 ; lane 8, B-2C ; lane 9, SK-N-MC ; lane 10, SH-P-1 ; and lane 11, SH-SY5Y. The lower half of the figure shows northern blots on the same samples hybridized with γ-actin probe.
The three neuroblastoma cell lines studied that had high levels of GM2 and GD2 (group 3) also had prominent mRNA bands for β1,4-GalNAc-transferase as detected by northern blotting (Table 3). In these cell lines, the 5.4-kb mRNA species predominated and the message levels were generally higher than for group 2 cells. Finally, the three neuroblastoma cell lines expressing GM2, but no GD2 (group 4), had low or moderate levels of β1,4-GalNAc-transferase and its mRNA.
GD3 ganglioside expression and transferase and mRNA levels
All melanoma tumors and cell lines have high or moderate levels of GD3 and α2,8-sialyltransferase (groups 1 and 2), and mRNA levels for the enzyme are correspondingly high or moderate (Table 4). The three neuroblastoma cell lines expressing high levels of GM2 and GD2 (group 3) had very low GD3 and α2,8-sialyltransferase levels (Table 4). mRNA levels for this enzyme were low or barely detectable in these cell lines (Fig. 2). The low level of α2,8-sialyltransferase is unexpected given that it catalyzes the synthesis of GD3, the substrate from which GD2, which is highly expressed in these cell lines, is formed. The three neuroblastoma cell lines expressing GM2, but no GD2 (group 4), lacked α2,8-sialytransferase and had no or barely detectable levels of mRNA for this enzyme (Table 4 and Fig. 2).
| Cell line | Ganglioside composition a | Enzyme activity b | mRNA expression c |
|---|---|---|---|
| Group 1 | |||
| 1. SK-MEL-28 | 40.0 | 4,285 | 17.3 |
| 2. MeWo | 42.5 | 123 | 3.5 |
| Group 2 | |||
| 3. SK-MEL-31 | 20.0 | 1,507 | 10.8 |
| 4. SK-MEL-37 | 19.0 | 210 | 5.8 |
| 5. LAN-1 | 25.3 | 112 | 14.3 |
| Group 3 | |||
| 6. SMS-SAN | 4.2 | 8 | 3.6 |
| 7. IMR-32 | 6.4 | 9 | 1.6 |
| 8. BE-2C | 9.5 | 5 | 1.3 |
| Group 4 | |||
| 9. SK-N-MC | 0 | 0 | 1.8 |
| 10. SH-EP-1 | 0 | 0 | 1.3 |
| 11. SH-SY5Y | 0 | 0 | 1.0 |
- a GD3 is expressed as percentage of total gangliosides (Ruan and Lloyd, 1992).
- b Activity of α2,8-sialyltransferase, expressed as pmol of donor incorporated into product/mg of membrane protein/h, shows the average of two experiments, with SE values of <5%.
- c Phosphor density of 2.3-kb species of α2,8-sialyltransferase mRNA was obtained by northern blot analysis, relative to background of film (1.0), normalized to the γ-actin signal for each sample.
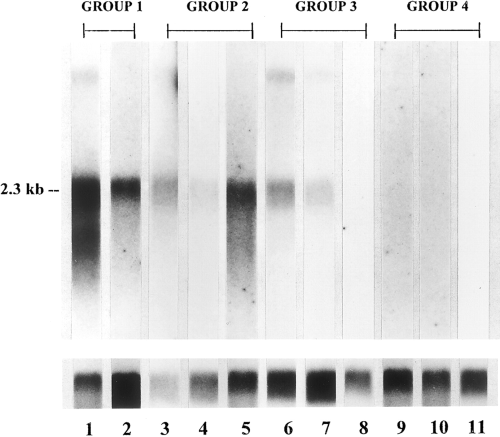
Northern blotting of mRNA from 11 melanoma and neuroblastoma cell lines with 32P-labeled α2,8-sialyltransferase cDNA. The cell lines are arranged in the same order as in Table 4 : lane 1, SK-MEL-28 ; lane 2, MeWo ; lane 3, SK-MEL-31 ; lane 4, SK-MEL-37 ; lane 5, LAN-1 ; lane 6, SMS-SAN ; lane 7, IMR-32 ; lane 8, BE-2C ; lane 9, SK-N-MC ; lane 10, SH-EP-1 ; and lane 11, SH-SY5Y. The lower half of the figure shows northern blots on the same samples hybridized with γ-actin probe.
Effect of introducing α2,8-sialyltransferase cDNA into SH-SY5Y neuroblastoma cells
The neuroblastoma cell line SH-SY5Y is characterized by high levels of GM2 and GD1a and the absence of GD3 and GD2 (Ruan and Lloyd, 1992). To examine the effect of introducing α2,8-sialyltransferase (GD3 synthase) on the ganglioside composition of this cell line, SH-SY5Y was transfected with a plasmid containing the α2,8-sialytransferase cDNA and the neomycin resistance gene. GD3-expressing transfectants were selected by drug resistance and immunofluorescence with an anti-GD3 antibody. One stable transfectant (SH-SY5Y/GD3-T) was selected for further study. This cell line had reduced GM2 and GD1a ganglioside levels and de novo production of GD3 and GD2 as determined by glycolipid isolation and TLC analysis (Table 5 and Fig. 3, lane 3). A number of minor ganglioside bands migrating between GD3 and GD2 were also noted in the SH-SY5Y GD3-T cell line (Fig. 3, lane 3) ; their identities were not determined. The changes in GM2, GD3, and GD2 were shown most dramatically by immunofluorescence staining with specific antibodies (Fig. 4). In the parent cell line (Fig. 4A, D, and G) and a control transfectant (Fig. 4B, E and H), only GM2 was observed, whereas in the SH-SY5Y/GD3-T cell line moderate GM2 and GD3, and strong GD2 staining was observed (Fig. 4I, C, and F, respectively). Although the cell surface expression of GD3 in SH-SY5Y/GD3-T, as judged by staining with a specific antibody, was not very high (Fig. 4C), the actual GD3 level in the cells as determined by extraction and TLC was quite high (Fig. 3, lane 3) and the α2,8-sialyltransferase level in the cells was also high (Table 5). As detected by antibody staining, the transfected cell line had more numerous and longer neurites than did the parent cell line and the control transfectant (Fig. 4F vs. G and H). This property was not as noticeable in unstained cells (data not shown) and may be a function of the distribution of the various gangliosides in the cells. Another noticeable difference between the cell lines was that the parent SH-SY5Y cells and the control transfectant cells tended to grow in vitro in large clumps (Fig. 4G and H), whereas the GD3-T transfected cells grew in a more dispersed pattern (Fig. 4F). In addition to altering ganglioside composition and cell morphology, the introduction of GD3 synthase into SH-SY5Y cells also altered their growth characteristics. As shown in Fig. 5, the transfected cell line had a much slower growth rate than either the parent or control cell line. The latter cells had a doubling time of ~3.0 days, whereas the SH-SY5Y/GD3-T cells doubled in number in ~2.0 days.
| Ganglioside composition a | ||||||||
|---|---|---|---|---|---|---|---|---|
| Cell line | GM3 | GM2 | GM1 | GD1a | GD3 | GD2 | GT1b | GD3 synthase activity b |
| SH-SY5Y | 10.0 | 56.5 | 5.0 | 28.5 | 0 | 0 | 0 | 0 |
| SH-SY5Y/neo | 20.1 | 56.4 | 7.3 | 16.2 | 0 | 0 | 0 | 0 |
| SH-SY5Y/GD3-T | 6.5 | 25.0 | 0 | 4.5 | 25.5 | 35.5 | 3.0 | 1,978 |
- a The level of each ganglioside is expressed as percentage of total ganglioside content.
- b Activity is expressed as pmol of donor incorporated into product/mg of membrane protein/h.
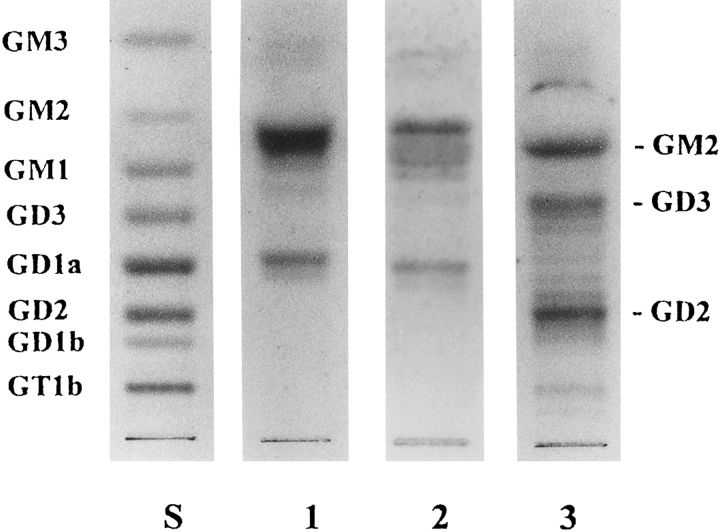
TLC of acidic glycolipids from SH-SY5Y (lane 1), SH-SY5Y/neo (lane 2), and SH-SY5Y/GD3-T (lane 3). Lane S, ganglioside standards. Gangliosides were detected resorcinol-HCI reagent.
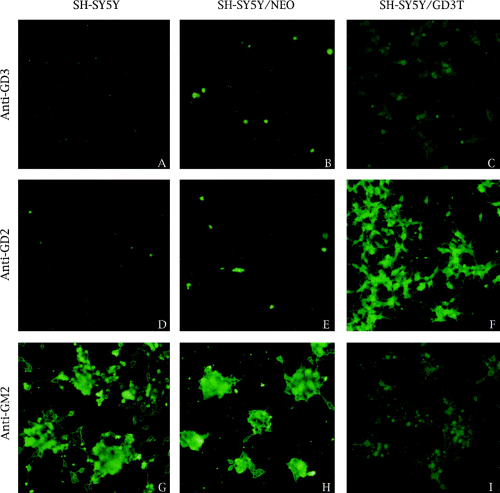
Immunofluorescent staining of gangliosides in SH-SY5Y neuroblastoma cells and its transfectants. A, D, and G : SH-SY5Y. B, E, and H : SH-SY5Y/neo. C, F, and I : SH-SY5Y/GD3-T. The following monoclonal antibodies were used : A-C : anti-GD3 (R24) ; D-F : anti-GD2 (3F8) ; G-I : anti-GM2 (696). Magnification : ×70.
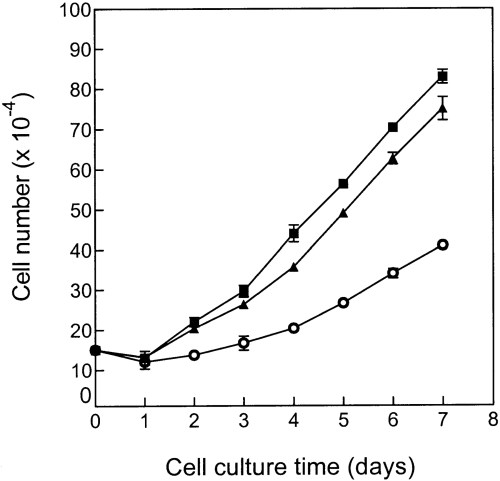
Growth characteriztics of SH-SY5Y neuroblastoma cell line and its transfectants. ▪, SH-SY5Y ; ▴, SH-SY5Y/neo ; ○, SH-SY5Y/GD3-T.
DISCUSSION
Numerous studies, initiated in the 1960s, have demonstrated that gangliosides are synthesized by a set of specific glycosyltransferases and that certain of these enzymes play key roles in determining the final ganglioside composition of a cell or tissue (Caputto et al., 1971 ; Fishman and Brady, 1976 ; Van Echten and Sandhoff, 1993). More specifically, GM3 synthase, GD3 synthase, and GT3 synthase determine entry into the a, b, and c biosynthetic pathways, and GM2 synthase plays a key role in the elongation of ganglio-series species in these three pathways. Furthermore, it appears that the relative levels of certain glycosyltransferases are critical factors in determining overall ganglioside composition. Examples of the latter phenomenon are the demonstration that neutral-series gangliosides (GA1, etc.) are synthesized by β1,4-Ga1NAc-transferase only when GM3 synthase is low or absent (Lutz et al., 1994 ; Yamashiro et al., 1995a). Similarly, the introduction of GM2/GD2 synthase into Neuro2 cells leads to the synthesis of GD1b and GQ1b in the transfected cells (Kojima et al., 1994).
In our studies, we have emphasized the important role played by GD3 synthase (α2,8-sialyltransferase) levels in determining the characteristic ganglioside patterns of different human melanoma and neuroblastoma cells (Ruan and Lloyd, 1992). Among the key points still to be explained is the ability of some melanoma cell lines (SK-MEL-31 and -37) and neuroblastoma cell lines (LAN-1) to express substantial amounts of GM2 and GD2, as well as GM3 and GD3 (group 2), whereas most neuroblastoma cell lines express GD2 and/or GM2 almost exclusively (group 3 and 4). This characteristic in group 3 cells seems to be determined by low levels of GD3 synthase. This property has now been shown to be determined at the level of transcription. Thus, group 2 cell lines had appreciable levels of GD3 synthase and its mRNA, whereas group 3 cell lines had extremely low levels of enzyme and message (Table 4). In SMS-SAN, IMR-32 (see also Yamashiro et al., 1995b), and BE-2C (group 3) cell lines, GD3 synthase and mRNA were barely detectable. This result is surprising considering that these cell lines exhibit high levels of GD2 ganglioside. A priori, one would predict that GD3 synthase activity should be high to provide substrate for the synthesis of GD2. A possible explanation is that by regulating the level of GD3 synthesized, group 3 cells ensure that all or almost all the GD3 is converted to GD2, thus resulting in cells with a typical neuroblastoma ganglioside composition (high GD2 and low GD3). In other words, the cellular level of a particular ganglioside is determined by both the level and activity of its synthase and the level of the preceding glycosyltransferase in the pathway producing its substrate. The efficiency of the GD2 synthase in utilizing low levels of GD3 precursor could be determined by its Km or by other unknown factors.
Another factor governing the amount of GD2 synthesis in group 2 and 3 cell lines may be the relative levels of the two mRNA species for β1,4-GalNAc-transferase. In group 2 cells (SK-MEL-31, SK-MEL-37, and LAN-1), appreciable levels of both the 5.4- and 2.2-kb mRNA species were detected, whereas in group 3 (SMS-SAN, IMR-32, and BE-2C) the 5.4-kb species predominated. The transferases produced by the two species may have different levels of activity or substrate specificities. Group 4 neuroblastoma cells (SK-N-MC, SH-EP-1, and SH-SY5Y) expressed GM2, but no GD2. This pattern is readily explained by the absence of GD3 synthase (and its mRNA) and the inability to synthesize b series gangliosides. It should be recalled, however, that levels of enzyme, mRNA, and ganglioside product are not necessarily correlated, as has been shown in other studies (Yamashiro et al., 1995a,b ; Lloyd and Furukawa, 1998).
We also attempted to assess the role of GD3 synthase in determining the characteristic ganglioside pattern of neuroblastoma cells by introducing GD3 synthase into a cell line (SH-SY5Y) that expresses only the a series gangliosides (GM2 and GD1a). A stably transfected cell line (SH-SY5Y/GD3-T) was isolated that expressed high levels of GD2 ganglioside and moderate levels of GD3. These properties are characteristic of group 3 neuroblastoma cell lines. It is interesting that this transfected cell line had altered morphological and growth characteristics corresponding to a more differentiated neuroblastoma cell type. In similar studies, Kojima et al. (1994) showed that introduction of GD3 synthase into mouse Neuro 2 cells resulted in the expression of GD1b and GQ1b gangliosides. Although not commented on by the authors, this transfected cell line had low levels of GD3 ganglioside, resembling group 3 cells. The transfected Neuro 2 cells also had slower growth characteristics and a more differentiated morphology. In a study on the changes in ganglioside expression in SH-SY5Y cells upon retinoic acid-induced neuronal differentiation, Rebhan et al. (1994) noted an increase in a pathway gangliosides, rather than b pathway gangliosides. However, the SH-SY5Y clone used by these investigators differed from the cell line used in this study in having substantial expression of GD3 and GD2, as well as GM2 and GD1a. The ganglioside composition of our SH-SY5Y cells more closely resembled that reported by Wu et al. (1991) for their SH-SY5Y clone.
Taken together with previous studies (Thampoe et al., 1989 ; Ruan and Lloyd, 1992 ; Ruan et al., 1995), these experiments indicate the importance of the following factors in determining ganglioside profiles in melanoma and neuroblastoma cells : (a) high GM3 and GD3 synthase levels and low GM2/GD2 synthase activity result in typical melanoma cell patterns (GM3 ≅ GD3 levels) ; (b) high GM3 and GD3 synthase levels in the presence of moderate levels of GM2/GD2 synthase (and its mRNA species) lead to cells with a less common melanoma pattern (GM3 ≅ GM2 ≅ GD3 ≅ GD2 levels) ; (c) the absence of GD3 synthase results in a group of neuroblastoma cell lines with only the a series gangliosides (GM2 and GD1a) ; and (d) high levels of GM2/GD2 synthase (and its 5.4-kb message), together with low levels of GD3 synthase, result in cells having a typical neuroblastoma ganglioside pattern (GD2 predominating). In future studies, it will be important to determine how these different ganglioside patterns determine the biological behavior of the different cell types.
Acknowledgements
These studies were supported by N.I.H. grants CA 60680 and CA 08748. We thank Ms. Claudette Bryant for skillful secretarial assistance.


