Invasion of exotic plants in nutrient-enriched urban bushland
Abstract
Abstract Invasion of exotic plants into vegetation communities on low-nutrient soils in Sydney is often attributed to increased phosphorus in the soil. However, the composition of native vegetation in nearby national parks has been found to be more closely correlated to combinations of soil nutrients and other environmental variables than phosphorus alone. This study examined whether phosphorus or a range of variables better matched patterns of native and exotic plants in urban bushland. Sites in urban bushland and national parks were sampled, vegetation frequency recorded and soil samples collected. Soil samples were analysed for a range of chemical and physical attributes. A significantly greater number of exotic species were found at the urban sites, and significantly fewer native species than in the national parks. All measured soil nutrients were found to be of a significantly increased concentration in urban soil. Using regression analysis, an index of all measured soil nutrients was found to explain more of the variation in the percentage of exotic species at a site than phosphorus alone. Multivariate analysis showed a gradient of sites from minimal exotic invasion to heavy invasion. However, this gradient also corresponded to changes in native species. The gradient was found to match that of increasing soil nutrient levels. A combination of soil nutrients was found to correlate better with the multivariate species composition than was phosphorus alone. The results suggest that it is the increase of many soil nutrients, not phosphorus alone, that is contributing to the invasion of urban bushland by exotic plants and the alteration of the suite of native species.
Introduction
Disturbance can enhance the invasion of exotic species by increasing the availability of a limiting resource, such as light, water or nutrients (Hobbs 1989). In plant communities, nutrient enrichment of soil can increase susceptibility to invasion of exotic plants directly, independent of physical disturbance (Huenneke et al. 1990). Furthermore, plant communities that occur on soils with very low levels of nutrients may be particularly sensitive to nutrient enrichment (Kirkpatrick 1986). The present study examines the invasion of exotic plants into nutrient-enriched soils in Sydney.
Invasion of exotic plants into Hawkesbury Sandstone vegetation communities in northern Sydney is often attributed to the rise of phosphorus levels in the soil (Clements 1983; Leishman 1990). Soils derived from Hawkesbury Sandstone are deficient in phosphorus and other nutrients, and it has been claimed by Beadle (1966) and Adamson and Buchanan (1974) that this renders the soils resistant to invasion. However, urban development has introduced nutrients into the soils from stormwater, sewerage overflows, fertilizers from gardens and pet excrement (Benson & Howell 1990). Urban gardens have also increased the spread of seeds and propagules of exotic species into urban bushland (Adamson & Buchanan 1974). Clements (1983) found that invaded urban bushland had increased levels of total soil phosphorus compared with non-invaded bushland in nearby national parks.
Further evidence also supports the idea that increased soil phosphorus creates conditions suitable for exotic invasion. For example, the number of exotic plants in bushland decreases with distance from an urban edge, and also increases with time since development (Rose & Fairweather 1997). The same pattern has been found for total soil phosphorus levels (Leishman 1990), so the link between soil phosphorus and invasion seems reasonable. However, it is also possible that soil variables other than phosphorus may be altered in urban bushland, and may affect vegetation patterns. In a study of the native Hawkesbury Sandstone vegetation of Ku-ring-gai Chase National Park, Le Brocque and Buckney (1994) found that the total phosphorus content of the soil could not adequately explain the observed vegetation patterns. A combination of soil nutrients and environmental variables was required to explain the patterns. Similar results were found by King and Buckney (2000) for vegetation in urban streams. Therefore, soil phosphorus may be inadequate to explain the vegetation patterns in urban bushland, in particular the occurrence and abundance of exotic plants. In the present study we examine a range of soil variables to determine if soil phosphorus, or a combination of soil variables, adequately explains the vegetation patterns found in urban bushland on Hawkesbury Sandstone.
Methods
Site locations
Twenty-four sites in northern Sydney were sampled between September and December 1997 and January and March 1999. Sixteen sites were in ‘urban’ and eight were in ‘non-urban’ bushland (Table 1). Urban sites were situated in catchments with urban development. Sites in Garigal National Park were classified as urban, as there is development within the catchment. In urban bushland a range of sites were selected on a stratified random basis, from minimally to heavily invaded by exotic plants. Sites were on hillsides, and did not include creeks, stormwater outlets or obvious disturbances. Distances from urban edges were randomized, but no site was directly on an edge. The non-urban sites were in undeveloped catchments, and were either uphill from or at least 50 m away from tracks. Six of the non-urban sites were in Ku-ring-gai Chase National Park, and two were in Royal National Park, south of Sydney. Royal National Park was sampled to remove any bias from Ku-ring-gai Chase National Park being north of the urban sites. The vegetation of the sites was classified by Benson and Howell (1994) as being in the Sydney Sandstone Complex. The vegetation varies depending on aspect and topography, but all sites were open forest or woodland (Benson & Howell 1994). All sites were on hillsides with a slope of less than 30°, but aspect was randomized. It is assumed that all sites had similar vegetation prior to European settlement, and this is supported by the historical work of Benson and Howell (1990). All sites have a similar climate (Benson & Howell 1994).
| Site type | Site | Site name | Easting | Northing |
|---|---|---|---|---|
| Non-urban | 1 | Topham Track, KCNP | 33818 | 628072 |
| 2 | Hungry Track, KCNP | 33480 | 627508 | |
| 3 | Smiths Creek East, KCNP | 33546 | 627308 | |
| 4 | KCNP, Duffy's Forest | 33324 | 627504 | |
| 5 | Coal & Candle Creek, KCNP | 33458 | 627614 | |
| 6 | Elvina Track, KCNP | 33970 | 627600 | |
| 7 | Flat Creek, Royal NP | 32170 | 622340 | |
| 8 | Bungoona Track, Royal NP | 32120 | 622920 | |
| Urban | 1 | David Thomas Reserve, Manly Vale | 33896 | 626078 |
| 2 | Wellings Reserve, Balgowlah | 33950 | 625832 | |
| 3 | Gore Creek Reserve | 33166 | 625522 | |
| 4 | Northbridge | 33452 | 625660 | |
| 5 | The Spit | 33766 | 625828 | |
| 6 | Sailors Bay | 33522 | 625808 | |
| 7 | Plunkett Road, Mosman | 33804 | 625520 | |
| 8 | Magdala Park, East Ryde | 32800 | 625774 | |
| 9 | Explosives Reserve, Castle Cove | 33555 | 625980 | |
| 10 | Sir Phillip Game Reserve, West Lindfield | 32918 | 626020 | |
| 11 | Magazine Track, Killarney Heights, Garigal NP | 33564 | 626040 | |
| 12 | Koola Avenue, East Killara, Garigal NP | 33222 | 626380 | |
| 13 | Farrer Place, Davidson, Garigal NP | 33396 | 626376 | |
| 14 | Kangaroo Point, West Pymble | 32570 | 626285 | |
| 15 | Forestville Park, Forestville | 33578 | 626276 | |
| 16 | Comenarra Playing Field, Sth Turramurra | 32555 | 626396 |
- KCNP, Ku-ring-gai Chase National Park; Royal NP, Royal National Park; Garigal NP, Garigal National Park. Eastings and Northings based on Australian Map Grid (AMG).
Vegetation sampling
Two quadrats were sampled at each site, except for urban sites 1 and 2, at which three quadrats were sampled for a pilot study, and the results retained for the main study. The quadrats were 200 m2 in size, and comprised a set of nine concentric nested subquadrats of 0.5, 1, 2, 5, 10, 20, 50, 100 and 200 m2 (Outhred 1984; Morrison et al. 1995). The quadrat was positioned to be representative of the surrounding vegetation. All vascular plants in the quadrat were assigned a frequency score between one and nine corresponding to the number of subquadrats in which they were found. The frequency score method generates a closer approximation of species density than standard frequency techniques, and is capable of detecting more subtle community patterns (Morrison et al. 1995). The second quadrat was placed a nominal distance of 50 m away in a random direction, the exact placement taking account of the constraints mentioned previously for the first quadrat.
All nomenclature follows Harden (1993).
Univariate statistical analysis of vegetation results
For each quadrat the number of species, the number of exotic species and the percentage of exotic species were calculated. These indices were then tested for significant differences between urban and non-urban sites. The results from each site were averaged to satisfy the assumption of independence, and a Levene test was used to test for heterogeneity of variances. The number of exotic species and percentage of exotic species at each site had heterogeneous variances, and were analysed with a Mann–Whitney U-test in statistica version 5.1. All other indices were analysed using analysis of variance (anova; statistica version 5.1). For consistency, all results are presented as mean values, but median values were used in the non-parametric analyses. Pearson product–moment correlations between indices were conducted using statistica version 5.1. All comparisons were made using an α value of 0.05.
Multivariate statistical analysis of vegetation patterns
A non-metric multidimensional scaling ordination (NMDS; primer version 4.0) was used to look for patterns in community composition among sites. There was no need to combine the quadrats at each site, as the ordination displays quadrat variability and the analysis makes no assumptions about independence. The Bray–Curtis similarity measure was used to construct a similarity matrix. An additional NMDS with exotic species removed was conducted to assess the influence of exotic species on the ordination patterns. RELATE (primer version 4.0) was used to assess the similarity of the two ordinations. RELATE is a Mantel test based on ranks that compares two similarity matrices. A Spearman rank correlation is calculated between the corresponding values of each matrix, giving a global ρ, and the significance of the correlation is then determined by a permutation procedure (Somerfield & Clarke 1995). An NMDS ordination of the species was then used to look for any groups of species that commonly occurred together. The number of species was reduced to 124, by removing the least common species, to fit the constraints of the analysis. Orientation of a multidimensional scaling ordination is arbitrary, so principal components analysis (PCA; primer version 4.0) was used to rotate the ordinations so the maximum variation was displayed along the x-axis. PROCRUSTES rotation (patn version 3.6) was used to rotate, transpose and scale all ordinations to be as similar as possible for display.
Soil sampling and physical and chemical analysis
Soil samples were collected at each site after scraping away any leaf litter. We used a plastic tube and collected soil to a depth of 5 cm. We took sufficient samples to fill a plastic bag of approximately 740 cm3. Shallower samples were taken where the soil was less than 5 cm deep.
Soil samples were dried at 30–40°C for 48 h. Samples were first sieved through a 2-mm mesh to remove gravel and large vegetation fragments. The gravel fraction was retained and weighed. The pH of samples in 0.01 m CaCl was determined using a pH meter (Hendershot et al. 1993). The cations sodium, potassium, calcium and magnesium were brought into solution by shaking 2 g soil with 50 mL ammonium acetate for 18 h (Grimshaw 1989). The concentrations were measured using atomic absorption spectrophotometry. The remainder of the soil samples were then dried at 110°C for 48 h. The organic content of the soil was determined by measuring the loss of sample weight when 5 g of sample was placed in a muffle furnace at 550°C for 3 h (Grimshaw 1989). Total nitrogen and phosphorus were determined colourimetrically after digesting 0.2 g ball-milled soil in a mixture of sulphuric acid and hydrogen peroxide (Allen 1989). The distribution of particle sizes (sand >100 µm; silt <100 µm) was determined by dry and wet sieving of 50 g soil (Grimshaw 1989), the gravel percentage having been previously determined from the whole sample.
Univariate statistical analysis of soil results
Results from each site were averaged before analysis. Product–moment correlations were conducted between all variables measured. Homogeneity of variances were checked by a Levene test before conducting an anova. Calcium and phosphorus had heterogeneous variances, so were analysed using a Mann–Whitney U-test. Linear regression was used to see how well phosphorus could explain variation in the percentage of exotic species at each site.
Multivariate statistical analysis of soil and vegetation results
Principal components analysis was used to examine patterns between sites on the basis of the measured soil variables. The first and second principal components were used to construct an ordination diagram. The first principal component was also used in a regression analysis to see if a combination of variables explained the percentage of exotic species at each site better than did phosphorus alone.
The relationship between floristic composition and the soil variables was examined using BIO-ENV (primer version 4.0) and canonical correspondence analysis (CCA; canoco version 4.0), to see if phosphorus, or a combination of variables, better explained the observed vegetation patterns. These analyses are based on different assumptions and algorithms. BIO-ENV compares patterns in the Bray–Curtis similarity matrix of species with the Euclidean distance matrix of the environmental variables using only rank orders. Any pattern of sites, based on species composition, should be similar to patterns based on a subset of environmental variables if the variables determine or correlate with the species patterns. The set of variables that best match the species patterns are found, and a Spearman rank correlation value calculated (Clarke & Ainsworth 1993). Canonical correspondence analysis ordinates the species and sites by explaining variation in the species data with linear combinations of environmental variables (Jongman et al. 1987). The nutrients sodium, potassium, magnesium, calcium, nitrogen and phosphorus were log transformed prior to CCA. Gravel was excluded, being made redundant by the inclusion of sand and silt. In the CCA ordination diagram, environmental variables are represented as arrows. The length of an arrow reflects how closely the environmental variable matches the patterns in species variation (Jongman et al. 1987). The percentage of variance explained is not reported, as Okland (1999) found it to be underestimated by CCA.
Results
General floristic patterns
Two hundred and twenty-nine species were found, of which 29 (12.7%) were exotic. The highest number of exotic species found in any quadrat was 10, and the highest percentage of exotic species in a quadrat was 43%. Urban sites had an average of 15.2% exotic species. Only one non-urban site was found to have an exotic plant, but every urban site had at least one exotic species, although some urban quadrats had no exotic species. At urban sites that had only one exotic species, the species was always Protasparagus aethiopicus.
The most common species were native (Table 2). Pittosporum undulatum, a native environmental weed, was found in 67.6% of urban quadrats, but not at any non-urban sites. Most exotic species were uncommon, and approximately half were encountered only once (Table 3).
| Species | Occurrence (% quadrats) |
|---|---|
| Angophora costata | 86 |
| Entolasia stricta | 84 |
| Dianella caerula | 82 |
| Smilax glyciphylla | 66 |
| Eucalyptus gummifera | 66 |
| Dillwynnia retorta | 64 |
| Lomandra longifolia | 64 |
| Persoonia levis | 60 |
| Protasparagus aethiopicus * | 60 |
| Pteridium esculentum | 60 |
- * Exotic species.
| Exotic species | Occurrence (% quadrats) |
|---|---|
| Protasparagus aethiopicus | 60 |
| Ochna serrulata | 38 |
| Cinnamomum camphora | 36 |
| Ligustrum sinense | 34 |
| Lantana camara | 26 |
| Senna pendula var. glabrata | 20 |
| Ligustrum lucidum | 12 |
| Ipomoea indica/purpurea | 10 |
| Nephrolepis cordifolia | 10 |
| Hedychium gardnerianum | 6 |
| Cardiospermum grandiflorum | 4 |
| Citrus limonia | 4 |
| Tradescantia albiflora | 4 |
| Ageratina adenophora | 2 |
| Andropogon virginicus | 2 |
| Bryophyllum delagoense | 2 |
| Bryophyllum pinnatum | 2 |
| Cardiospermum halicacabum | 2 |
| Chlorophytum comosum | 2 |
| Cotoneaster glaucophyllus | 2 |
| Hypochaeris radicata | 2 |
| Olea europaea | 2 |
| Phytolacca octandra | 2 |
| Passiflora sp. | 2 |
| Pelargonium×domesticum | 2 |
| Rubus sp. | 2 |
| Setaria palmifolia | 2 |
| Solanum mauritianum | 2 |
| Solanum nigrum | 2 |
The number of native species was significantly less at urban sites, but there was a significantly higher number and percentage of exotic species at urban sites than at non-urban sites (Table 4). The decreased number of native species at urban sites was offset by the increase in exotic species, as the total number of species at urban bushland sites was not significantly different from that at the non-urban sites.
| Site type | Total no. species | No. native species* | No. exotic species* | Percentage exotic species* |
|---|---|---|---|---|
| Non-urban | 40.9 (2.2) | 40.84 (2.2) | 0.06 (0.06) | 0.13 (0.1) |
| Urban | 34.0 (2.5) | 29.83 (3.1) | 4.17 (0.78) | 15.2 (3.4) |
- * Significant difference between urban and non-urban sites (P < 0.05). Numbers in brackets are the standard errors of the mean. Non-urban n= 8; urban n= 16.
The indices were highly intercorrelated (Table 5). With regard to the percentage of exotic species at a site, there were strong negative correlations with the total number of species and number of native species.
| No. species | No. exotic species | Percentage exotic species | |
|---|---|---|---|
| No. exotic species | −0.61 | ||
| Percentage exotic species | −0.73 | 0.96 | |
| No. native species | 0.98 | −0.76 | −0.85 |
- All correlations significant at P < 0.05. n = 24.
Soil
A general increase in soil nutrient content was found in urban bushland. All of the measured soil nutrients were significantly higher at urban sites (Table 6). However, the percentage of silt was significantly higher at non-urban sites (Table 7). There was greater nutrient variability at urban sites, in particular calcium, with some sites having very high values.
| Site type | P* | N* | Na* | K* | Mg* | Ca* | pH |
|---|---|---|---|---|---|---|---|
| Non-urban | 9.24 (0.88) | 84.29 (12.61) | 3.44 (0.58) | 5.72 (0.57) | 9.12 (1.22) | 20.58 (3.97) | 3.87 (0.09) |
| Urban | 17.26 (1.85) | 268.83 (23.81) | 5.74 (0.56) | 11.57 (1.33) | 21.76 (3.93) | 83.83 (24.23) | 3.59 (0.15) |
- * Significant difference between urban and non-urban sites (P < 0.05). Standard error of the mean shown in parentheses. All variables, except pH, expressed as mg per 100 g soil. Non-urban n = 8; urban n = 16.
| Site type | Gravel | Sand | Silt* | Organic* |
|---|---|---|---|---|
| Non-urban | 4.38 (0.75) | 78.35 (2.70) | 17.27 (2.32) | 5.25 (0.72) |
| Urban | 5.81 (0.88) | 81.53 (1.42) | 12.66 (0.96) | 11.65 (0.82) |
- * Significant difference between urban and non-urban sites (P < 0.05). Standard error of the mean shown in parentheses. Non-urban n = 8; urban n = 16.
There were many significant correlations between soil variables (Table 8). The strongest correlation was between nitrogen and organic content, suggesting that much of the organic material contained nitrogen, as would be expected. The correlation between percentage organic content and phosphorus was lower, but still strong. Phosphorus and nitrogen were strongly correlated, and both were reasonably correlated with the other nutrients. Sodium, potassium, calcium and magnesium were well correlated with each other. The percentage of silt was lower at urban sites, so it was negatively correlated with most parameters.
| P | N | Na | K | Mg | Ca | Gravel | Sand | Silt | Organic content | |
|---|---|---|---|---|---|---|---|---|---|---|
| N | 0.79* | |||||||||
| Na | 0.68* | 0.79* | ||||||||
| K | 0.77* | 0.78* | 0.85* | |||||||
| Mg | 0.81* | 0.75* | 0.78* | 0.91* | ||||||
| Ca | 0.71* | 0.57* | 0.66* | 0.83* | 0.84* | |||||
| Gravel | 0.39 | 0.21 | 0.23 | 0.44* | 0.38 | 0.44* | ||||
| Sand | 0.07 | 0.25 | 0.06 | 0.00 | 0.08 | 0.01 | −0.58* | |||
| Silt | −0.32 | −0.43* | −0.22 | −0.27 | −0.32 | −0.28 | 0.11 | −0.87* | ||
| Organic content | 0.71* | 0.94* | 0.82* | 0.74* | 0.63* | 0.48* | 0.29 | 0.13 | −0.34 | |
| pH | 0.46* | 0.08 | 0.25 | 0.41* | 0.56* | 0.69* | 0.35 | −0.33 | 0.19 | −0.01 |
- * Correlation significant at P < 0.05; n = 24.
PCA of soil
The PCA ordination of the soil variables shows a gradient of increasing nutrients from non-urban to urban sites (Fig. 1). The first principal component is a gradient of increasing nutrients, organic content and slight pH rise contrasted with a slight decrease in silt.

Principal components (PC) ordination of quadrats based on soil variables. (●) Non-urban sites; () urban sites. The diagram explains 76.3% of the variation in the soil data. PC1, first principal component; PC2, second principal component.
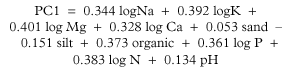
The second principal component contrasts decreasing sand with increasing pH and silt. The first two principal components explain 76.3% of the variation in the soil. As the first principal component explains 55.2% of variation in the soil variables, it was used in the regression analyses as a multivariate index of the nutrient status of each site.
Regressions
Phosphorus explained 68.0% of the variation in the percentage of exotic species at each site, and nitrogen alone explained 57.1%. Potassium had the highest r2 of any single variable, explaining 70.9% of the variation in percentage of exotic species. However, the first principal component, which accounts for 55% of the variation in the soil data, explained 73.6% of the exotic species variation. Both the first principal component and phosphorus were less successful at explaining the variation in the number of native species. Phosphorus explained 47.2%, and the first principal component explained 54.0%. Therefore, in all cases the first principal component, a combination of variables, explained more of the variation in the occurrence of native and exotic species than did phosphorus alone.
Multivariate patterns
The orientation of an NMDS diagram is arbitrary, so no scales are shown on the axes. The distance between points reflects their similarity, with points close together more similar in floristic composition than points far apart (Clarke 1993). A gradient of changing floristic composition is seen on the NMDS ordination of the vegetation, extending from the non-urban sites on the left of the diagram, to the urban sites on the right (Fig. 2). No clear groups are evident. In most cases the two quadrats from each site are similar to one another. The sites at each end of the gradient have no species in common, indicating complete species turnover.

Non-metric multidimensional scaling ordination of quadrats, based on floristic composition. (●) Non-urban sites; () urban sites. Stress = 0.13.
The NMDS ordination of quadrats after removing exotic species from the analysis (figure not shown) was very similar to the ordination with all species included (Fig. 2). The Spearman rank correlation coefficient (from RELATE) between the two ordinations was 0.985 (P < 0.01). This indicates that the gradient seen on Fig. 2 is largely due to changes in native species, and not directly to the occurrence of exotic species.
The NMDS ordination of species (Fig. 3) only shows nine exotic species out of 29. Most exotic species were rare in the study, and were removed from the analysis as explained. The exotic species are seen on the right of the diagram, and are mixed with a number of native species. These natives tend to be more mesophyllic and typical of rainforests, such as Livistona australis, Cissus hypoglauca, Pandorea pandorana and Pittosporum undulatum. The species on the left of the diagram tend to be sclerophyllous, such as Hibbertia bracteata, Gompholobium grandiflorum and Lasiopetalum ferrugineum. The gradient of sites from non-urban through to urban (Fig. 2) is explained by this gradient of changing species.

Non-metric multidimensional scaling ordination of the 124 most common species. Native species are represented by circles; exotic species represented by numerals: 1, Ipomea indica; 2, Nephrolepis cordifolia; 3, Ligustrum lucidum; 4, Lantana camara; 5, Senna colutoides; 6, Ligustrum sinense; 7, Ochna serrulata; 8, Cinnamomum camphora; 9, Protasparagus aethiopicus. Stress = 0.21.
The BIO-ENV analysis found the variables that best correlated with the vegetation patterns were a combination of potassium or magnesium, calcium, silt, phosphorus and nitrogen (r = 0.53). Phosphorus alone had a correlation with the vegetation data of 0.33, whereas the best single variable was nitrogen (r = 0.39). The correlation between all nutrients and the vegetation was 0.49.
The NMDS ordination of sites, based on the combination of variables identified by the BIO-ENV analysis (Fig. 4), is similar to the PCA (Fig. 1), and the Spearman rank correlation coefficient between the two was very high (r = 0.913). In contrast, the Spearman rank correlation between the PCA and the site ordination based on species (Fig. 2) was 0.606. Therefore, there is variation in the vegetation that is not fully explained by the measured soil variables.

Non-metric multidimensional scaling ordination of quadrats based on soil variables selected by BIO-ENV. Euclidean distance similarities used. (●) Non-urban sites; () urban sites. Stress = 0.09.
The CCA ordination diagram shows the principal gradient to consist of increasing nutrient and organic levels, with urban sites tending to be in the middle of the diagram or further to the right along the gradient than non-urban sites (Fig. 5). Most of the exotic species were also further along the gradient than the native species, although some native species are also far to the right (Fig. 6). The gradient of species is similar to Fig. 3, with sclerophyllous species on the left, and more mesophyllic species typical of rainforest on the right. The secondary gradient perpendicular to the first is largely a gradient of increasing pH and decreasing sand. The first environmental axis was well correlated with organic content, nitrogen, magnesium, calcium and potassium, and less so for phosphorus. There was a negative correlation with silt. The many similar arrow lengths mean that the variables have similar correlations with the gradient (Jongman et al. 1987). The second gradient is positively correlated with pH and, to a lesser extent, silt, and negatively correlated with sand. The CCA ordination diagram is similar to the PCA diagram (Fig. 1). Overall, phosphorus is clearly not the most important variable, and a combination of nutrients is seen to explain the species patterns best.

Canonical correspondence analysis ordination diagram of quadrats. (●) Non-urban sites; () urban sites. Arrows represent environmental variables. Eigenvalue axis 1 = 0.418; eigenvalue axis 2 = 0.204.

Canonical correspondence analysis ordination diagram of species. (●) Exotic species; () native species. Arrows represent environmental variables. Eigenvalue axis 1 = 0.418; eigenvalue axis 2 = 0.204.
Discussion
Floristics
The gradient on the ordination diagrams shows that urban bushland encompasses a large range of sites, from those with vegetation similar to non-urban national parks to sites with a high number of exotic species and no native species in common with some non-urban sites. The urban sites most different to non-urban sites not only had the greatest percentage of exotic species, but the least native species in common with non-urban sites. These sites also had the highest soil nutrients. The results agree with those of Clements (1983), who concluded that the abundance of both native and exotic mesophyllic species in urban areas has increased, and the abundance of native sclerophyll species has decreased.
The number of native species at a site was negatively correlated with the percentage and number of exotic species, as was also found by Rose and Fairweather (1997). The native species absent from some of the urban sites are the sclerophyllous species, which are typically shrubs and herbs. The natural understorey of Hawkesbury Sandstone vegetation communities is very rich in these plants (Benson & Howell 1994). The increased abundance of exotic species occurs alongside the decline of native species. Furthermore, most of the difference between sites was due to changes in the type and abundance of native plants. However, because of the observational nature of this study it cannot be resolved if exotic species directly lead to the loss of native plants, or exotic plants are favoured by conditions that cause the loss of native species.
Only one exotic species, Protasparagus aethiopicus, was found at the non-urban national park sites. Outhred et al. (1985), in a floristic survey of Ku-ring-gai Chase National Park, found 14 exotic species, totalling 4% of the 365 species found. However, very few exotic species were found in what Outhred et al. (1985) termed ‘moderately low open forest’, which was sampled in the present study.
As well as being found at a non-urban site, the exotic species P. aethiopicus was found at every urban site. In the study by Rose and Fairweather (1997), P. aethiopicus was the most common and widespread exotic species. Furthermore, the five most frequent exotic plants found by Rose and Fairweather (1997) match the top five of the present study (Table 3). The seeds of all these species are transported by birds (Buchanan 1989).
Soil
The soil in urban bushland differs from that in non-urban areas in more than just phosphorus content. Phosphorus, sodium, potassium, magnesium, calcium, nitrogen, percentage organic content and sand content were all found to be significantly higher at urban sites. As these soil variables were higher at urban sites, most variables, except sand, silt and gravel, were significantly correlated with phosphorus. This suggests that previous studies (e.g. Clements 1983) that only examined phosphorus, and subsequently linked phosphorus to an increase in exotic species, may be over-simplified. Phosphorus had particularly high correlations with potassium, magnesium and nitrogen (Table 8). However, as phosphorus did not correlate perfectly with any measured soil variable, variation in species patterns not accounted for by phosphorus may be explained by other variables. This does not imply that phosphorus is important alone and the other variables just happen to correlate with phosphorus. Residual variation in the other nutrients, that is, the variation different to phosphorus, is important in helping to explain the species patterns. If phosphorus on its own adequately explained community patterns then all the sites would fall on a straight line on the ordination diagrams. The gradients on the ordination diagrams are more complicated.
A combination of soil parameters including phosphorus, rather than phosphorus alone, correlated best with the observed vegetation communities. A combination of variables also explained more of the variability in the percentage of exotic species at each site. Several other authors have found a combination of nutrients or environmental variables in different environments explained species patterns or distributions better. Le Brocque and Buckney (1994) found complex environmental gradients correlated best with species patterns in undisturbed bushland in Ku-ring-gai Chase National Park. Adam et al. (1989), studying species richness of coastal NSW communities, concluded that total soil phosphorus was not the only factor correlated with species richness. Margules et al. (1987) found that no single environmental variable could predict the species richness of eucalypts in south-eastern Australia, and suggested that single variable gradients are special cases that are unlikely to be common.
Although the ordination diagrams do not show simple linear gradients, they do show similar patterns, with the gradient from non-urban to urban sites present on them all. The PCA, CCA and NMDS analyses were based on different algorithms, so the appearance of the same trend in all three strongly suggests that the pattern is real, and not an artefact of the data. 3, 6 show that species change along the gradient, and that these changes closely match changes in soil variables, particularly the nutrients.
The ordinations of the soil data (1, 4) did not exactly match the ordination based on the vegetation (Fig. 2). This suggests that there is some variation in the environmental data not reflected in the vegetation patterns, or vice-versa. There are a number of reasons why vegetation patterns may not exactly reflect soil pattern. Fire interval and intensity (Keith 1996), physical disturbance (Sousa 1984) and variation due to unmeasured variables such as moisture (Amor & Stevens 1976) can all influence vegetation patterns.
Regardless of how well species patterns match the soil patterns, definite conclusions cannot be drawn. Correlation techniques cannot show causality, as an unmeasured variable that directly affects the vegetation may be correlated with the measured ones (Clarke & Ainsworth 1993). However, direct manipulation studies (Heddle & Specht 1975; Specht et al. 1977; Huenneke et al. 1990) have shown that nutrient addition can cause vegetation changes in low nutrient communities, so it is probable that the increased soil nutrients in urban bushland are causing the vegetation changes in the present study. Unmeasured variables such as fire and moisture may help to explain the residual variation. Furthermore, the present study cannot determine if exotic invasion is directly affecting the native plant community, or if exotic plants invade after the native species become disadvantaged (Bridgewater & Backshall 1981). It is likely that both processes are occurring, but manipulative experiments are needed to determine their relative importance.
The level of soil phosphorus alone is probably adequate to estimate the percentage of exotic species in urban bushland. The index of all soil variables (first principal component) only explained 5% more of the variability in the percentage of exotic species than phosphorus alone. If phosphorus alone is used, approximately half of the pattern in the percentage of exotic plants is explained. However, phosphorus on its own performed less well at explaining the community patterns in CCA and BIO-ENV, where larger combinations of nutrients better matched the observed species patterns. This was expected, as phosphorus alone was inadequate to describe distribution patterns in native species in undisturbed bushland (Le Brocque & Buckney 1994).
The variables most consistently found to match the species patterns in CCA and BIO-ENV were nitrogen, phosphorus, magnesium, potassium and calcium. These, along with sulphur, carbon, oxygen and hydrogen, are the plant macronutrients (Salisbury & Ross 1992). Because the soil concentration of all nutrients seems to increase together, the question of which ones are more important may not be relevant on a practical level. However, if the information is found to be necessary, a manipulative experiment would be needed to separate the contribution of different soil nutrients. Experiments on individual species (Specht & Groves 1966; Groves & Keraitis 1976) can establish the response of plants to different combinations of nutrients, but a knowledge of community-level responses is of most importance for adequate management of urban bushland.
In conclusion, the concentrations of many nutrients other than phosphorus have been raised in urban bushland soils. Combinations of these nutrient concentrations, including phosphorus, were better correlated with the vegetation patterns than phosphorus alone, and also explained more of the variation in the percentage of exotic species found at a site.
Acknowledgements
This work was conducted while the first author was in receipt of a University of Technology, Sydney Faculty of Science Doctoral Scholarship and an Australian Postgraduate Award. The New South Wales National Parks and Wildlife Service granted permission for fieldwork in National Parks. The technical staff of the Department of Environmental Sciences, University of Technology, Sydney, in particular Narelle Richardson and Alex Statzenko, gave advice on the soil analysis. Louisa Mamouney read and offered advice on the manuscript.