The effect of flooding and flood timing on leaf litter breakdown rates and nutrient dynamics in a river red gum (Eucalyptus camaldulensis) forest
Abstract
Comparisons of litter standing-stocks in low-lying and higher areas of the floodplain and the effects of controlled flooding events on leaf litter decomposition and leaf litter nutrients were examined during autumn and winter in a southeastern Australian river red gum (Eucalyptus camaldulensis) floodplain forest. The mean mass of total litter and some litter components was significantly greater in autumn than in winter but there were few differences in litter mass between low-lying flood runners and higher sites (1.5 m) on the floodplain, regardless of season. Leaf decomposition was more rapid in flooded areas than in non-flooded areas and was significantly faster in autumn than in winter. In flooded leaves, concentrations of phosphorus and nitrogen dropped rapidly during the first 3 days of each experiment, increased to near original after 7–10 weeks and then decreased again. After 112 days of decomposition the C:N:P ratios of leaf litter increased, but this effect was most marked for flooded leaves. Simple models of leaf litter dynamics indicated that leaf litter standing-stocks in low-lying flood runners would be reduced by flooding, particularly during autumn. In contrast, models predicted a net gain in standing-stocks of leaf litter to be higher on the floodplain, particularly in autumn. Alteration to the seasonal timing of floods by river regulation has probably decreased litter standing-stocks and nutrients available in low-lying areas of the floodplain to support the production of macrophytes and biofilms during winter and spring floods.
INTRODUCTION
Recent reviews of the function of floodplain rivers have stressed the importance of lateral links between floodplain and river systems ( Gurtz & Tate 1988; Junk et al. 1989 ; Walker et al. 1995 ). The fertility of floodplains and their standing water bodies may depend upon sediments and nutrients from the river ( Junk et al. 1989 ) and the release of nutrients from decomposing terrestrial litter ( Brinson 1977). Forest litter and macrophyte and algal production in floodplain wetlands are also major contributors to the energy budgets of stream and lowland river ecosystems ( Fisher & Likens 1973; Petersen & Cummins 1974; Richey et al. 1991 ; Campbell et al. 1992a , b; Bailey 1995).
Claims regarding the net effect of flooding on the dynamics of energy and nutrients in the litter layer of floodplain forests have been contradictory ( Neckles & Neill 1994). Most studies have demonstrated that submerged leaves break down more rapidly when submerged or influenced by flooding ( Brinson et al. 1981 ; Webster & Benfield 1986; Gurtz & Tate 1988; Boulton 1991). It is unclear though how the duration, frequency and timing of floods influence mass loss and nutrient dynamics in leaf litter.
The Barmah/Millewa floodplain forests on the Murray River in southeastern Australia provide an excellent site for examining some of these questions. These floodplain forests exist in a semi-arid environment where floodwater supports significant growth of river red gum, Eucalyptus camaldulensis ( Bacon et al. 1993a ). River regulation has altered the frequency, duration, extent and timing of flooding patterns to varying degrees along the Murray River ( Maheshwari et al. 1995 ), and now, low-lying areas of the Barmah/ Millewa floodplain are more likely to experience small floods in summer and early autumn ( Dexter 1978; Bren 1987) while winter and spring floods now extend over less of the forests and have been less frequent and of shorter duration than before ( Maheshwari et al. 1995 ). It is likely that seasonal patterns of litter decomposition and nutrient release, the life cycles of aquatic flora and fauna and the growth of terrestrial plants have been affected by these changes ( Chesterfield 1986).
On the Barmah/Millewa floodplain, densities of individual trees, tree biomass and the growth rates of individuals of E. camaldulensis are greater within and immediately adjacent to shallow floodways than they are in higher portions of the floodplain ( Bacon et al. 1993a , b; Robertson unpublished data, 1998). These differences appear to be a result of greater flood frequencies in shallow floodways ( Bacon et al. 1993b ). However, greater tree biomass may result in greater litter mass in shallow floodways within the forests, thus making litter-associated nutrients more available to trees growing in these habitats.
Here we investigate whether litter standing-stocks vary between low-lying and high areas of the floodplain forest system in the Millewa Forest. We also use experimental floods to test how the rates of loss of mass and the dynamics of nutrients in leaf litter of E. camaldulensis varied in response to seasonal flooding events. We combine data on litter mass and decomposition to model litter turnover in two seasons and in flooded and non-flooded regions of the floodplain.
METHODS
Study sites and experimental floods
All field work was performed in Gulpa Island State Forest, a floodplain forest located between Gulpa Creek and the Edward River, approximately 26 km south of Deniliquin, New South Wales (35°45′37′′S, 144°50′46′′E). The Murray River lies approximately 15 km southeast of the study area where it divides the Millewa and Barmah Forests. The topography is flat, with an east–west gradient of approximately 0.2 m km–1 ( Bren & Gibbs 1986). Highest monthly rainfall generally occurs between April and October ( ABS 1995). Vegetation is characterized by the dominance of river red gums (E. camaldulensis) and a grassy understorey. A low annual average rainfall (460 mm) and high annual rate of evaporation (1530 mm) means that floodplain vegetation relies on frequent and extensive flooding from the Murray River ( Bacon et al. 1993a ).
Litter collections and leaf decay experiments were performed at the site of an ongoing study on the ecological effects of different flooding regimes on river red gum growth ( Bacon et al. 1993b ). In our study, sites A1 and A2 ( Fig. 1) were flooded in late February and remained flooded for 120 days. These floods are hereafter called autumn floods. Sites W1 and W2 ( Fig. 1) were flooded in July and remained flooded for 120 days. These floods are hereafter called winter floods. These flood regimes had been applied at the sites for 4 years prior to our study ( Bacon et al. 1993b ). Flooded runners were 10–20 m wide, with a maximum depth during flooding of 20–100 cm. Such floods would naturally have occurred, on average, once per year in this location prior to river regulation ( Maheshwari et al. 1995 ).
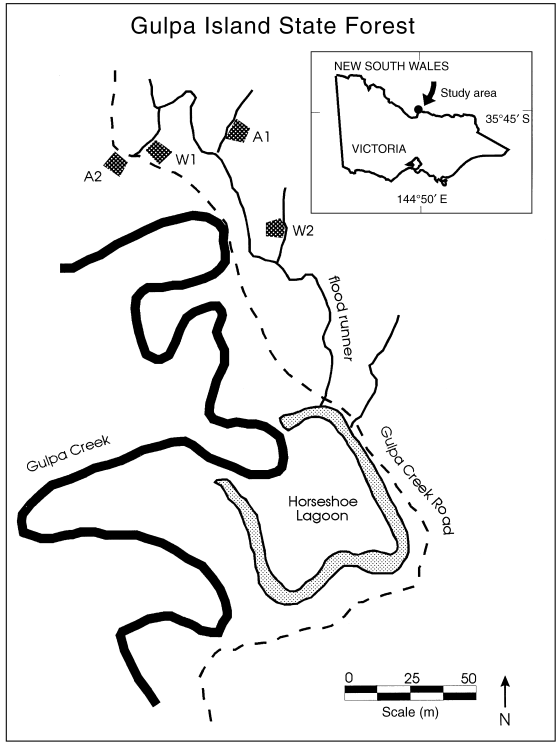
Location of study sites at Gulpa Island State Forest, New South Wales. A1 and A2 are sites that were flooded in autumn, and W1 and W2 were flooded in winter.
Litter standing-stocks
Forest floor litter (all organic matter above the soil) was collected from two habitats; within low-lying areas of the floodplain called flood runners and in adjacent positions 1.5 m higher on the floodplain. Such collections were performed at two sites in each of two seasons (sites A1 and A2 in autumn and W1 and W2 in winter; Fig. 1). In each habitat at each site and season, litter was collected from five 1-m2 quadrats placed at 3 m intervals along a randomly placed 30 m transect (i.e. a total of 20 samples per season).
All litter samples were sorted and sieved into components, namely, (i) the differentiated fraction of the litter: bark, twigs (<1 cm in diameter) and leaves (essentially intact), and (ii) coarse particulate organic matter (CPOM), the undifferentiated fraction of the litter containing small (passing through a 1-cm sieve) gum nuts, buds, faeces, grass, leaf fragments and fine twigs. Although pieces of wood were present in litter samples, mass data for this litter component are not reported here because dead wood biomass is not accurately assessed using 1-m2 quadrats. The dry weight of each component of each litter sample was determined after oven-drying at 105°C for 12 h ( Ashton 1975).
Leaf decomposition
To examine the rate of mass loss and nutrient changes within leaves during decomposition, browning, preabscission leaves were collected randomly from mature trees of E. camaldulensis located in a similar floodplain forest near the study site. Leaves were air-dried for 24 h before grouping into leaf packs.
Groups of approximately 7–10 leaves were weighed (5–6 g total weight) the day before emplacement in the field and tied securely with surveyors tape and monofilament fishing line. A subset of 20 leaf packs was immediately oven-dried at 50°C to constant weight. This enabled the determination of a conversion factor, so that the initial dry weight of each leaf pack could be estimated.
Leaf packs were placed in the forest in March and again in late July to coincide with autumn and winter floodings. In each season 28 leaf packs were tethered in two habitats: beneath the water in flood runners (flooded treatment) and on higher (1.5 m), dry ground approximately 30 m from the flood runners (non-flooded treatment). Such a design was repeated at two sites in each season. There were thus 224 leaf packs deployed over the whole experiment. In each season, four leaf packs were removed from each habitat and site on day 3 and weeks 1, 2, 4, 7, 11 and 16 after placement in the field.
Upon removal, leaf packs were immediately returned to the laboratory and washed gently in tap water to remove algal biofilms, silt and invertebrates ( Campbell et al. 1992b ). Packs were dried at 50°C to constant weight. Following drying and weighing, all leaf packs were stored dry for later chemical analyses.
Chemical analyses
Several randomly chosen leaves from each leaf pack were ground to a powder (<2 mm) and a subsample taken for each analysis (phosphorus and nitrogen 400 mg; carbon 40 mg). Whole leaf packs were not ground to powder owing to the size of the available mill.
Total Kjeldahl nitrogen (TKN) was determined by the sulphanilamide colourometric method and total phosphorus as phosphate by the molybdate blue colourometric method ( Oweczkin & Kerven 1980). Total organic carbon (TOC) was determined using a rapid wet oxidation–titration procedure with potassium dichromate ( Allen 1989).
All concentrations were expressed as total phosphorus (P) mgP g–1, total nitrogen (N) mgN g–1, and total organic carbon (C)% of leaf dry weight. Concentration data were used with dry mass data to calculate the percentage of the original mass of carbon, nitrogen and phosphorous remaining in leaves at each sampling time.
For each litter component, a three-way analysis of variance ( ANOVA) with habitat (two levels: within flood runners and higher on the floodplain), season (two levels: autumn and winter) and site (two levels) as fixed factors, was used to compare means of litter standing-stocks. A log (x) transformation was used on data for bark, CPOM and total litter to achieve homoscedacity ( Fowler & Cohen 1990).
Preliminary analysis, which included site as a separate fixed factor in a four-factor model, revealed that site did not have a significant influence on mass loss from leaves. Consequently, for ease of presentation and interpretation, a three-way ANOVA model was used to compare mean mass loss and nutrient changes obtained from the decomposition experiment. The model included time (fixed factor, seven levels), treatment (fixed factor, two levels: flooded and not-flooded) and season (fixed factor, two levels: autumn and winter). All percentage data were arcsin √–p transformed before analysis ( Fowler & Cohen 1990). As only five leaf pack collections (spanning 49 days) were analysed for nutrients in winter, seasonal comparisons of changes in nutrients were made on the basis of the first five collections from each season. For significant ANOVA, a multiple comparison procedure (post hoc LSD test) ( SPSS 1992) was used to determine differences between sample means.
Exponential models were fitted to mass loss data. For flooded leaves a double exponential model, % original mass remaining = Ae–k1t + (1 –A)e–k2t, where A is the relatively labile portion of initial mass (1 –A) is the more refractory portion, k1 and k2 are decay constants and t is time in days, provided the most appropriate characterization of leaf decomposition ( Wieder & Lang 1982). Single exponential models best described leaf decomposition at non-flooded sites, where mass loss was slower.
RESULTS
Litter standing-stocks
The overall mean mass of litter in our study area was 1.184 kg m–2. The most noticeable pattern in litter standing-stocks was that seasonal differences accounted for a large proportion of the total variance in total litter mass and the mass of the major litter component, CPOM ( Tables 1, 2), with the greatest standing-stocks in autumn. Although the mean mass of leaf litter varied across sites and habitat with season ( Table 2), seasonal differences accounted for 20% of the total variance in leaf litter mass, and leaves were more abundant in autumn ( Table 1). There were few consistent patterns for the other litter components. For instance, there was a greater mass of bark on the floodplain in winter but no difference between habitats in autumn ( Tables 1, 2). Overall, difference in litter mass between flood runners and higher portions of the floodplain were minor and not consistent ( Tables 1, 2).
| Autumn | Winter | |||||||
|---|---|---|---|---|---|---|---|---|
| Litter | Site 1 | Site 2 | Site 1 | Site 2 | ||||
| component | runner | floodplain | runner | floodplain | runner | floodplain | runner | floodplain |
| Leaves | 227.8 | 107.6 | 146.6 | 178.0 | 128.1 | 100.4 | 104.0 | 52.8 |
| Bark | 267.1 | 127.8 | 98.6 | 127.5 | 70.2 | 159.9 | 54.8 | 132.7 |
| Twigs | 243.4 | 123.0 | 133.6 | 217.5 | 161.4 | 107.5 | 92.7 | 102.5 |
| CPOM | 1615.0 | 995.8 | 915.1 | 1389.3 | 410.4 | 324.6 | 353.6 | 206.6 |
| Total | 2353.4 | 1354.2 | 1293.9 | 1912.3 | 770.2 | 692.3 | 605.1 | 494.6 |
- Rounding errors result in some total litter mass data differing from the sum of components.
| Source ofvariation | Leaves | Bark | Twigs | CPOM | Total |
|---|---|---|---|---|---|
| Season (Se) | **(20) | NS | *(13) | ***(64) | ***(55) |
| Habitat (H) | *(8) | NS | NS | NS | NS |
| Site (Si) | NS | NS | NS | NS | NS |
| Se × H | NS | *(12) | NS | NS | NS |
| Se × Si | NS | NS | NS | NS | NS |
| H × Si | NS | NS | **(15) | NS | NS |
| Se × H × Si | *(8) | NS | NS | NS | *(4) |
- NS, not significant; *P < 0.05, **P < 0.01; ***P < 0.001. Numbers in parentheses are the percentage of the total variation accounted for by significant main factors and interactions. CPOM, coarse particulate organic matter.
Leaf decomposition
Dry mass
The pattern of leaf decomposition between treatments varied with season ( ANOVA three-way interaction term, P < 0.001; Fig. 2; Table 3). Overall, most variation in mass loss was due to the flood treatment (39.8% of total variation), while seasonal differences accounted for 4.7% of total variation. Weight loss was most rapid in flooded sites in autumn and slowest in non-flooded sites in winter.

Changes in dry mass of leaves (mean ± SE) in flooded (●) and non-flooded (○) sites in (a) autumn and (b) winter. Lines are derived from double exponential decay models fitted to the data for flooded leaf packs and single exponential decay models fitted to data for non-flooded leaf packs.
| Source of variation | Dry mass loss | Carbon mass loss | Nitrogen mass loss | Phosphorus mass loss |
|---|---|---|---|---|
| Treatment (T) | *** | *** | *** | NS (flooded/non-flooded) |
| Season (S) | *** | *** | *** | *** (autumn/winter) |
| Time (D) (days) | *** | *** | *** | ** |
| T × S | *** | *** | * | NS |
| T × D | ** | NS | * | NS |
| S × D | **** | NS | ** | * |
| T × S × D | *** | NS | ** | NS |
- Significance levels: NS, not significant; *P < 0.05; **P < 0.01; ***P < 0.001.
Using the parameters derived from the fitted double and single exponential models describing mass loss in leaves we calculated half-lives for leaf decomposition ( Table 4). The models predicted that it would take longer in winter (364 days) than in autumn (169 days) for non-flooded leaves to lose 50% of their original mass, but that there was only a minor seasonal difference for flooded leaves ( Table 4).
| Autumn | Winter | |||||||
|---|---|---|---|---|---|---|---|---|
| flooded | non-flooded | flooded | non-flooded | |||||
| A% | 24.1 | (3.7) | 15.4 | (5.8) | ||||
| k1 | 0.496 | (0.223) | 0.004 | (0.001) | 0.687 | (1.110) | 0.002 | (0.000) |
| k2 | 0.003 | (0.001) | 0.004 | (0.001) | ||||
| t 0.5 (days) | 138 | 169 | 132 | 364 | ||||
Nutrients
Carbon The loss of original carbon mass generally paralleled that for total mass loss in flooded and non-flooded sites in both seasons ( Fig. 3; Table 3).
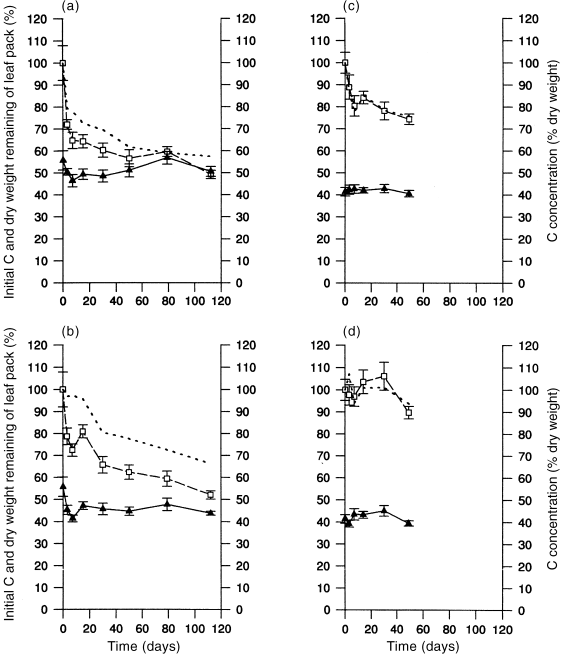
Changes (mean ± SE) in leaf carbon over time. (a) Autumn flooded; (b) autumn non-flooded; (c) winter flooded; (d) winter non-flooded. (□) % initial carbon; () carbon concentration (% dry weight); (–) % dry weight remaining of leaf pack.
Nitrogen Decomposing leaves exhibited periods of nitrogen mass loss and enrichment during both seasons ( Fig. 4; Table 3). In autumn, initial losses in nitrogen concentration were followed by generally steady enrichment between days 7 and 79 of the experiment, and then further losses. With the exception of non-flooded leaves in winter, for which there was no consistent pattern, graphs of the percentage of initial nitrogen remaining showed a similar pattern, with nitrogen mass increasing during the middle of the experimental period. There was a significant loss of nitrogen mass late in the experiment.
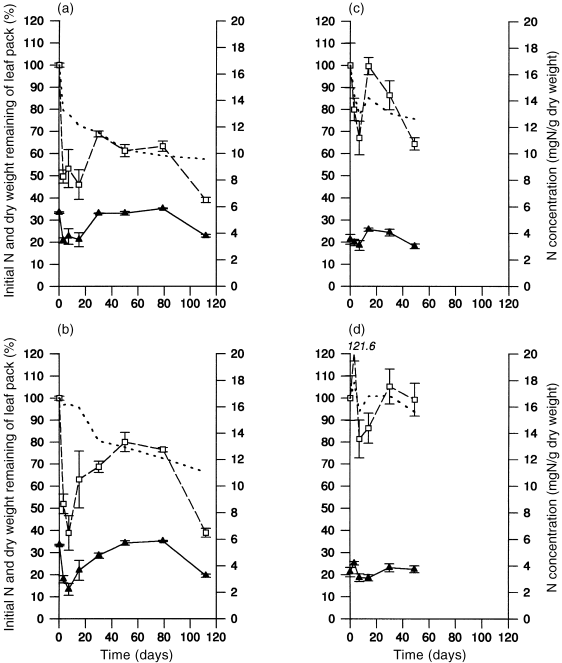
Changes (mean ± SE) in leaf nitrogen over time. (a) Autumn flooded; (b) autumn non-flooded; (c) winter flooded; (d) winter non-flooded. (□) % initial nitrogen; () nitrogen concentration (mg N/g dry weight); (–) % dry weight remaining of leaf pack.
Phosphorus Mass loss and enrichment of phosphorus was observed during both seasons, but changes in the percentage of original phosphorus remaining in leaves were similar in flooded and non-flooded habitats ( Fig. 5; Table 3). Initial rapid losses in phosphorus concentrations were generally followed by a period of enrichment in all treatments and seasons. Enrichment was followed by a loss during the final sampling interval for flooded leaves in autumn, but this did not occur in winter.
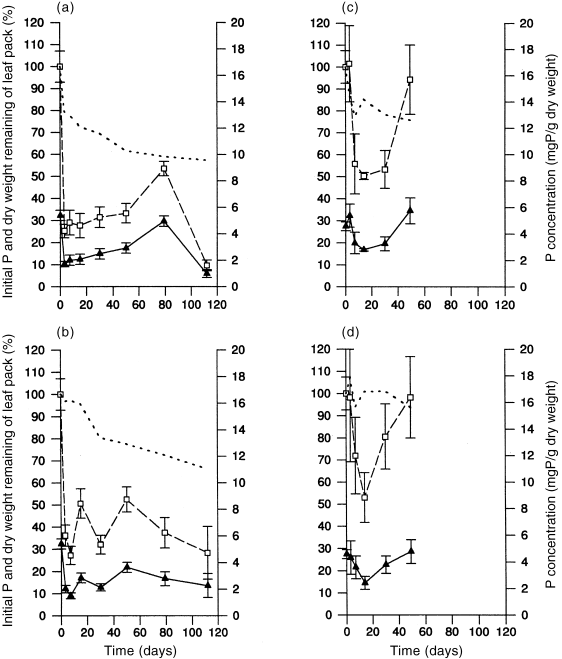
Changes (mean ± SE) in leaf phosphorus over time. (a) Autumn flooded; (b) autumn non-flooded; (c) winter flooded; (d) winter non-flooded. (□) % initial phosphorus; () phosphorus concentration (mg P/g dry weight); (–) % dry weight remaining of leaf pack.
Nutrient ratios
In autumn the rapid leaching of carbon from leaves ( Fig. 3) resulted in a drop in the C:N ratio of litter in flooded sites after 49 days ( Table 5). However, after 112 days the C:N ratio in litter was much higher in flooded areas than in non-flooded habitats. In winter the C:N ratio of litter was greater in flooded than in non-flooded sites after 49 days. Regardless of flood treatment, concentrations of phosphorus decreased in relation to carbon and nitrogen during the autumn experiment, but increased in winter ( Table 5).
| Autumn | Winter | |||
|---|---|---|---|---|
| flooded | non-flooded | flooded | non-flooded | |
| Day 0 | 104 : 1.1 : 1.0 | 104 : 1.0 : 1.0 | 90 : 0.8 : 1.0 | 90 : 0.8 : 1.0 |
| Day 49 | 175 : 3.9 : 1.0 | 193 : 1.4 : 1.0 | 70 : 0.5 : 1.0 | 82 : 0.8 : 1.0 |
| Day 112 | 516 : 3.9 : 1.0 | 123 : 1.6 : 1.0 | ||
DISCUSSION
Litter standing-stocks in eucalypt (and other) forests generally reflect regional climate, soils and forest structure, as well as the seasonal timing of litterfall ( Attiwill & Leeper 1987). The overall mean standing-stock of litter at our study site (~12 t ha–1) was low compared to other eucalypt forests in higher rainfall regions (>20 t ha–1; Ashton 1975; Rogers & Westman 1977) but similar to eucalypt forests in other lower rainfall regions (<12 t ha–1; Birk 1979; Hart 1995).
The greater standing-stocks of litter we observed in autumn reflects summer litterfall at our study site (Robertson & Heagney, unpublished observations, 1999). We sampled litter in early March about 1.5 months after peak litter fall. While leaf litter mass was high in our samples relative to later in the year, the litter was dominated by undifferentiated CPOM, indicating relatively rapid leaf breakdown during summer. Although we expected greater standing-stocks of litter in low-lying flood runners based on tree biomass in these habitats, there was little evidence that this was generally the case. This indicates a more rapid decomposition of litter in flood runner habitats.
Results from the decomposition experiment showed clearly that mass loss from leaf litter was significantly faster in flooded than non-flooded sites and was more rapid in autumn than in winter. Generally, weight loss from decaying leaf litter is faster in aquatic than in terrestrial systems at similar latitudes owing to greater leaching and microbial metabolism in aquatic habitats ( Hutson 1985; Webster & Benfield 1986; Boulton 1991; Molles et al. 1995 ). At our field site, rates of benthic respiration are low in flood runners during the first days following flooding (Robertson, unpublished data, 1998) indicating that most of the mass loss from leaves during this period is via leaching. Leaves in our study lost ~20% of their initial mass in 72 h, a similar rate of leaching of dissolved organic material as that observed in other studies on eucalypt leaves ( Pidgeon & Cairns 1981; Bunn 1988; Boulton 1991). Previous studies on decay of eucalypt leaves in aquatic habitats have indicated greater rates of decay in winter, or no seasonal pattern ( Bunn 1988; Campbell et al. 1992a ). In contrast, autumn flooding in our study resulted in the most rapid rates of decay for leaf litter.
There is a possible problem of using half-lives to compare decay when conditions may change during processing of litter, such as occurs on periodically inundated floodplains ( Briggs & Maher 1983). Nevertheless, comparisons of half-lives derived from other studies of eucalypt leaf decomposition in temperate and semi-arid streams and wetlands (median value ~50 days, Lake 1995) indicate that in our study red gum leaf litter decayed very slowly (range of half-lives, 132–364 days). Only Bunn (1988) has recorded longer half-lives (206–340 days) in his study of Eucalyptus marginata leaves in a Western Australian stream. It is likely that the slow rate of leaf decomposition at our study site reflects both the rather arid conditions when leaves are not flooded and the often anaerobic conditions which prevail in flood runners, particularly during summer floods (Robertson, unpublished data, 199?).
To illustrate how flooding at different times of the year influences litter standing-stocks in flood runners and other habitats higher on the floodplain we developed simple models of leaf dynamics at our study site ( Fig. 6). The models used data on leaf litter mass and leaf decomposition from this study and litterfall data from Robertson and Heagney (unpublished observations, 1999). The models describe a 2-week period during autumn and winter in which environmental conditions (particularly water and air temperatures) would have been relatively stable. During floods, litter mass decreases in flood runners and the decrease is much greater in autumn. Areas of the forest not affected by flooding experience a net gain in leaf litter mass, and this is greatest during autumn.
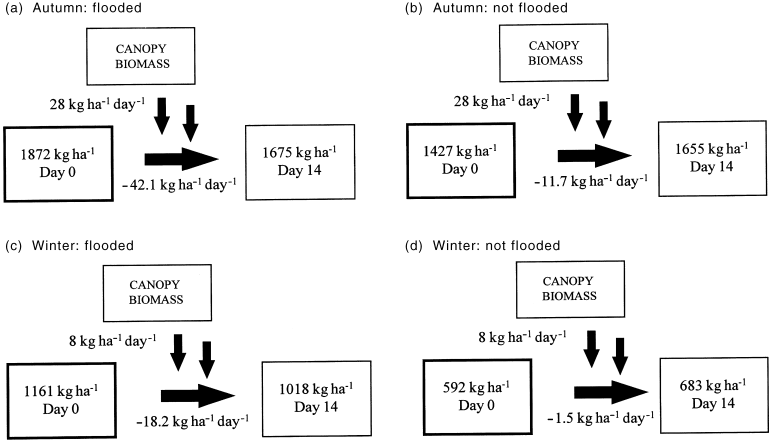
Models of leaf litter dynamics for all combinations of flooding and season in this study. Fluxes are litterfall (vertical arrows) and litter decomposition (horizontal arrows). Boxes are leaf litter mass at days 0 and 14.
Such models provide only a preliminary picture of the dynamics of litter processing in these forests, and a number of other factors should be considered in more robust models of leaf turnover. For instance, the influence of alternate wetting and drying of leaf material may be an important consideration when determining long-term rates of leaf breakdown in floodplain environments ( Xiong & Nilsson 1997). Different flood durations and different flood frequencies influence the growth cycle of floodplain vegetation ( Bren & Gibbs 1986; Bren 1987) and thus influence litter production, the extent of leaf breakdown and the export of carbon from the floodplain ( Junk et al. 1989 ). The inclusion of data from spring and summer would include the time of the year when litterfall is generally greatest (Robertson & Heagney, unpublished observations, 1999) and may also enhance our understanding of the role of seasonal variables such as rainfall ( Molles et al. 1995 ) and temperature in leaf breakdown ( Junk et al. 1989 ). Burying of litter by sediments may slow the decomposition of litter in flood-prone sites, and complicate the analyses of the influence of flooding on decomposition rates ( Molles et al. 1995 ).
Flooding, and the timing of flooding had a significant impact on nutrient dynamics in decaying leaves. Little change was observed in the C:N:P ratios of decaying leaves in winter, regardless of flooding, but flooded litter in autumn exhibited a major increase in C:N:P ratios. The concentrations of carbon, nitrogen and phosphorus in leaves fell rapidly during the first 3 days of decay and the magnitude of loss was greatest for flooded litter. Leaves continued to lose carbon during the next 7 weeks but the significant nitrogen enrichment during this period, resulting from increases in microbial biomass on leaves and the complexing of nitrogen in humic compounds ( Robertson 1988), caused a drop in the C:N of leaves. However, after 16 weeks in autumn, the C:N ratio of flooded litter was greater than at the beginning of the experiment and in non-flooded litter. C:P ratios in flooded and non-flooded litter decreased throughout autumn as phosphorus was lost from leaves at a greater rate than carbon. Similar trends have been observed for leaves of Eucalyptus blakelyi in streams ( Pidgeon & Cairns 1981) but it appears that C:P ratios decrease with time for litter in northern hemisphere streams and wetlands (e.g. Brinson 1977; Meyer 1980).
Taken together, our data on mass loss and nutrient dynamics in leaf litter indicate that increases in the frequency of summer and early autumn floodings in this region ( Bren 1987) may have altered litter and nutrient turnover in the following ways. More frequent floods in summer and early autumn will have decreased litter standing-stocks in low-lying areas of the floodplain. A consequence of lower litter mass, and the higher C:N:P ratios of litter following prolonged flooding, is that nutrients may be less available to support biological production in spring. This may not be a problem for trees, because wood production by E. camaldulensis appears to be greatest in areas receiving short summer floods (Robertson et al., unpublished observations, 1999). However, primary production by aquatic macrophytes and biofilm accumulation is greatest during late winter and spring floods in flood runners (Robertson, unpublished data, 1999). The food chains dependant on these sources of primary production may have been affected by lower nutrient availability in the form of litter.
Acknowledgements
This study was made possible by the co-operation of State Forests of New South Wales. Geoff Heagney and Damian Green provided valuable field assistance. Dr Jann Williams offered valuable comments on a draft of the paper. Nutrient analyses were undertaken by Jim Watt and colleagues at Charles Sturt University, Bathurst, New South Wales.
The project was supported by an ARC Large Grant (no. A19601941), a CSU Women in Science Foundation Scholarship (to HG) and the School of Environmental and Information Sciences at Charles Sturt University.


