Eye movements during the Rorschach test in schizophrenia
Abstract
Abstract In order to understand relationships between scanning behaviors, characteristics of visual stimuli and the clinical symptoms in schizophrenia, eye movements of 37 schizophrenic patients and 36 controls were recorded using an eye-mark recorder during a free-response period in a Rorschach test. Four cards (I, II, V and VIII) were used. Data were analyzed during 15 s from the presentation of each card. For all cards, the number of eye fixations and the number of eye fixation areas were fewer, and total scanning length and mean scanning length were shorter for schizophrenic patients than for controls. For card II, in the non-popular response group, eye fixation frequency upon area 5 + 6 (red) was higher for schizophrenic patients. For card VIII, in the popular response group, eye fixation frequency upon area 5 + 6 (pink) was lower for schizophrenic patients. For cards II and VIII, the number of eye fixations was inversely correlated with negative symptoms. For card II, total scanning length tended to be inversely correlated with negative symptoms, and mean eye fixation time was correlated with negative symptoms. The number of eye fixation areas was inversely correlated with positive symptoms. For card VIII, eye fixation frequency in a stimulative area tended to be correlated with positive symptoms. Scanning behaviors in schizophrenic patients are affected by characteristics of visual stimuli, and partially by clinical symptoms.
INTRODUCTION
Eye movement abnormalities have been reported in schizophrenia. Holzman et al. demonstrated abnormalities of smooth pursuit eye movements in schizophrenic patients.1 This dysfunction improved in a number reading task, but differences persisted between patients and controls.2 Moriya reported that eye fixations in chronic schizophrenic patients and their relatives were few and were localized within limited areas.3 Moreover, eye fixation areas in schizophrenic patients were fewer than in controls when subjects were asked for a confirmative question.4 Holzman et al. considered dysfunction of smooth pursuit eye movements to be an impairment of non-voluntary attention, while exploratory eye movements were considered to reflect voluntary attention.5 In face recognition, Williams et al. reported that in the more difficult task condition, schizophrenic patients did not concentrate their eye fixations on feature areas, and they suggested that they were unable to form the initial registration of a general gestalt, followed by an abnormal emphasis on serial processing.6 These studies detected eye movement aberrations in schizophrenia during various task performance.
Rorschach cards present unfamiliar and vague stimuli. The Rorschach test requires subjects to see the blots on the card, recall the internal constructs and images, and reconstitute visual images corresponding to the blots. Responses to this task represent cognitive function for integration of perception, and cognitive style is manifested in response to the various stimuli on each card.7 These points differ from the task of a visual retention test used in many other studies. Rorschach insisted that cognition for these cards in schizophrenia differ from that in normal subjects. Thus, we were interested to investigate scanning behaviors during Rorschach test. However, eye movements during Rorschach test in schizophrenic subjects have not been reported except in one article.8 In that report, eye movements of schizophrenic patients for achromatic cards were limited, even when the patients gave a popular response with a frequency similar to that of controls. For chromatic cards, popular responses were seen less in schizophrenic patients than in controls, leading the author to describe an impairment of selective attention in schizophrenia. In that study, relationships of scanning behaviors to clinical symptoms were not examined because patients were chronically ill and had predominantly negative symptoms. In the present study, we investigated correlations of eye movements with clinical symptoms in schizophrenic patients as well as with characteristics of visual stimuli on individual Rorschach cards.
MATERIALS AND METHODS
Subjects
Subjects included 37 schizophrenic patients (19 men and 18 women) who were inpatients or outpatients at Kagoshima University Hospital, Kagoshima, Japan. All subjects gave their informed consent to participate in the study. Patients fulfilled the criteria for schizophrenia specified in the Diagnostic and Statistical Manual of Mental Disorders, 4th edn (DSM-IV),9 and were not mentally retarded. The mean age (± SD) was 26.7 ± 7.6 years. The mean duration of illness was 3.1 ± 3.6 years, and the mean neuroleptic dose in chlorpromazine equivalents10 was 383.8 ± 386.5 mg/day. Five patients were neuroleptic-naive at the time of examination. A control group included 36 subjects (20 men and 16 women) who were university students and staff of Taniyama Hospital, Kagoshima, Japan and had no history of neuropsychiatic illness. Their mean age was 26.6 ± 5.4 years.
Experimental methods
Each subject's head was fitted with an eye-mark recorder (EMR-7; NAC, Tokyo, Japan). Subjects were seated in a chair. Rorschach cards (24.2 × 16.9 cm) were presented directly in front of the subject at a distance of 52 cm. Under these conditions, the card size was adjusted to a vertical visual angle of 18 degrees and a horizontal angle of 26 degrees. Four cards were selected (achromatic cards, I and V; chromatic cards, II and VIII). Cards I and V wholly consist of solid blots and are relatively simple. Card II consists of segmented red and black blots with white space in the middle. This card is difficult to be integrated. Card VIII consists of some segmented blots and all are pastel in color. We can observe effects of color on recognition. Cards were presented in the usual manner and sequence (I, II, V and VIII). Eye movements were recorded by an eye-mark recorder during a free-response period in the Rorschach test.
Evaluation of clinical symptoms
On the day after eye movement recording, clinical symptoms were assessed in schizophrenic patients by one neuropsychiatrist using the Oxford version of the Brief Psychiatric Rating Scale (BPRS; range 0–6).11 This scale includes five items representing positive symptoms and four items representing negative symptoms. Each item is given a score of 0–6 points. The sum of scores for conceptual disorganization, suspiciousness, hallucinatory behavior, mannerisms and posturing, and unusual thought content was recorded as subscale scores for positive symptoms. Negative symptom scores were estimated in terms of emotional withdrawal, motor retardation, uncooperativeness and blunted affect. Symptom selection criteria were based on the report of Kitamura et al.12 The mean score of positive symptoms was 10.2 ± 4.7, and that of negative symptoms was 5.5 ± 3.8.
Data analysis
Data collected during an interval of 15 s from the presentation of each card were analyzed with software designed for the EMR-7 recorder. When scanning movements remained within one point at a visual angle of 2 degrees for more than 200 msec, the point was defined as an eye fixation point. With each card, eye movement parameters including total scanning length, the number of eye fixations, mean scanning length, the number of eye fixation areas, and mean eye fixation time were determined. In addition, six areas were defined for each card according to the method of Kataguchi, and the frequency of eye fixation upon each area was determined13 (Fig. 1).
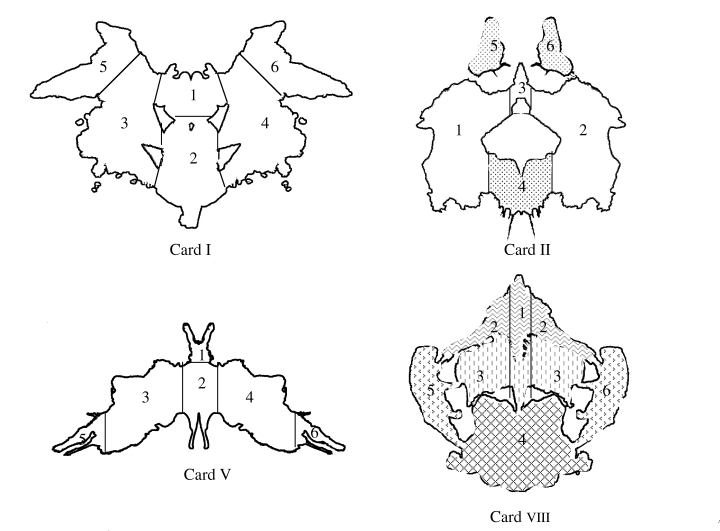
Numbering of areas on cards. Card I and card V are achromatic cards. Card II and card VIII are chromatic cards. red; pink with yellow;
 pink;
gray;
 green.
Statistical procedures
Eye movement parameters and eye fixation frequency upon each area were analyzed by t-test comparing schizophrenic patients to normal controls. Moreover, differences in response style (popular or non-popular) between patient and control groups were tested using χ2 test, and eye fixation frequency upon each area was analyzed by t-test comparing between the popular response subgroup and the non-popular response subgroup. Subject's response to the blot was classified into two subtypes, popular or non-popular, because this classification is performed with high reliability. The popular response is a response content given by many normal subjects and indicates commonsense. For cards I and V, it is a butterfly and a bat. For card II, it is dogs or bears or pigs, etc. and humans. For card VIII, it is animals with four legs and a flower. Correlation between eye movement parameters and clinical symptom scores, and between eye fixation frequency upon each area and clinical symptom scores were analyzed by Spearman's rank correlation coefficients (rs). Correlation between eye movement parameters and neuroleptic dose was analyzed by Pearson's correlation coefficients (r). Data were discarded when eye fixation was beyond the extent of the blots on the card and also when noise in a recording precluded analysis. Thus, the number of subjects analyzed differed between cards.
RESULTS
Comparisons between schizophrenic patients and normal controls
For chromatic cards, the reaction time was shorter for schizophrenic patients than for controls (P < 0.05, card II). For all cards, the numbers of eye fixations and eye fixation areas were fewer, total and mean scanning length were shorter, and mean eye fixation time was longer for schizophrenic patients than for controls (Table 1).
| Card | RT (S) | TSL (deg) | NF | MSL (deg) | NFA | MFT (S) | |
|---|---|---|---|---|---|---|---|
| I | Normal (n = 28) | 9.9 ± 9.3 | 73.36 ± 35.07 ] ***** | 19.9 ± 5.5 ] ****** | 3.76 ± 1.24 ] ** | 4.3 ± 1.3 ] * | 0.73 ± 0.30 ] *** |
| Schiz (n = 25) | 10.0 ± 9.2 | 39.48 ± 25.08 | 13.4 ± 5.4 | 2.93 ± 0.84 | 3.4 ± 1.2 | 1.30 ± 0.84 | |
| II | Normal (n = 29) | 20.6 ± 16.9 ] * | 97.53 ± 22.10 ] ****** | 23.0 ± 4.0 ] ****** | 4.44 ± 0.68 ] ****** | 5.2 ± 1.0 ] *** | 0.58 ± 0.13 ] ****** |
| Schiz (n = 25) | 12.0 ± 7.3 | 54.25 ± 21.10 | 16.6 ± 4.2 | 3.39 ± 0.78 | 4.2 ± 1.0 | 0.90 ± 0.37 | |
| V | Normal (n = 27) | 7.7 ± 6.3 | 106.15 ± 35.5 ] ****** | 21.5 ± 5.2 ] ****** | 5.15 ± 0.88 ] ****** | 4.9 ± 0.9 ] ****** | 0.68 ± 0.36 ] *** |
| Schiz (n = 24) | 7.5 ± 6.7 | 45.99 ± 23.80 | 14.1 ± 4.3 | 3.25 ± 1.09 | 3.8 ± 1.0 | 1.16 ± 0.67 | |
| VIII | Normal (n = 30) | 16.0 ± 10.0 | 108.83 ± 28.78 ] ****** | 22.3 ± 4.2 ] ****** | 5.14 ± 0.93 ] ****** | 5.4 ± 0.7 ] ****** | 0.62 ± 0.20 ] ***** |
| Schiz (n = 28) | 11.7 ± 8.6 | 60.27 ± 32.24 | 16.9 ± 4.4 | 3.66 ± 1.08 | 4.4 ± 1.1 | 0.91 ± 0.32 |
- Values are mean ± SD, taken over 15 s.
- * P < 0.05,
- ** P < 0.01,
- *** P < 0.005,
- **** P < 0.001,
- ***** P < 0.0005,
- ****** P < 0.0001 (t-test: unpaired).
- RT, reaction time; TSL, total scanning length; NF, number of eye fixations; MSL, mean scanning length; NFA, number of eye fixation areas; MFT, mean eye fixation time.
For card I, eye fixation frequency upon each area did not differ between schizophrenic patients and controls. For card II, eye fixation frequency upon area 5 + 6 was higher for schizophrenic patients than for controls (P < 0.05; Fig. 2). For card V, eye fixation frequency upon area 5 + 6 was lower for schizophrenic patients than for controls (P < 0.005; Fig. 3). For card VIII, eye fixation frequency upon each area was not significantly different between schizophrenic patients and controls.
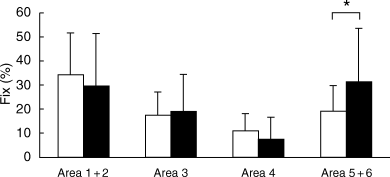
Card II. Eye fixation frequency upon each area is shown, comparing (▪) schizophrenic patients (n = 25) with (□) normal controls (n = 29). Each bar represents the mean ± SD. *P < 0.05 (unpaired t-test).
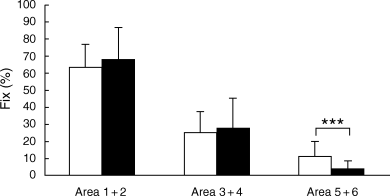
Card V. Eye fixation frequency upon each area is shown, comparing (▪) schizophrenic patients (n = 24) with (□) normal controls (n = 27). Each bar represents the mean ± SD. ***P < 0.005 (unpaired t-test).
For all cards, the popular response frequency was not significantly different between schizophrenic patients and controls. However, for card VIII, controls respond with animals more frequently than schizophrenic patients (χ2 = 3.85, P < 0.05).
For cards I and V, eye movement parameters and eye fixation frequency upon each area did not differ between the popular response subgroup and the non-popular response subgroup. For card II, in the non-popular response group, eye fixation frequency upon area 5 + 6 was higher for schizophrenic patients than for controls (P < 0.05; Fig. 4). For card VIII, in controls, eye fixation frequency upon area 1 was higher for the non-popular response subgroup (P < 0.0001; Fig. 5), and eye fixation frequency upon area 5 + 6 was higher for the popular response subgroup (P < 0.0005; Fig. 5). In the popular response group, eye fixation frequency upon area 5 + 6 was lower for schizophrenic patients (P < 0.05; Fig. 5).
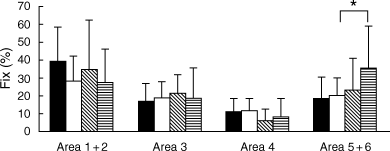
Card II. Eye fixation frequency upon each area is shown, comparing schizophrenic patients with normal controls. Subjects are divided into two groups: a popular (P) response group and a non-popular (non-P) response group. Each bar represents the mean ± SD. *P < 0.05 (unpaired t-test). (▪) Normal P (n = 16); (□) normal non-P (n = 13); () schizophrenic P (n = 8); () schizophrenic non-P (n = 17).
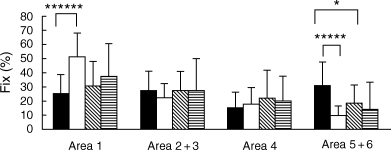
Card VIII. Eye fixation frequency upon each area is shown, comparing schizophrenic patients with normal controls. Subjects are divided into two groups: a popular (P) response group and a non-popular (non-P) response group. Each bar represents the mean ± SD. *P < 0.05, *****P < 0.0005, ******P < 0.0001 (unpaired t-test). (▪) Normal P (n = 19); (□) normal non-P (n = 11); () schizophrenic P (n = 12); () schizophrenic non-P (n = 16).
Correlation coefficients between eye movement parameters and Brief Psychiatric Rating Scale scores
For card II, the number of eye fixations was negatively correlated with negative symptoms (rs = – 0.56, P < 0.01), and total scanning length tended to be negatively correlated with negative symptoms (rs = – 0.36, P < 0.1), while mean eye fixation time was positively correlated with negative symptoms (rs = 0.53, P < 0.01). The number of eye fixation areas tended to be negatively correlated with positive symptoms (rs = – 0.34, P < 0.1). Concerning the subscales of BPRS, for card II, the number of eye fixations was negatively correlated with blunted affect (rs = – 0.58, P < 0.005). Total scanning length tended to be negatively correlated with blunted affect (rs = – 0.35, P < 0.1), and motor retardation (rs = – 0.36, P < 0.1). Mean eye fixation time was positively correlated with blunted affect (rs = 0.61, P < 0.005). The number of eye fixation areas was negatively correlated with unusual thought content (rs = – 0.47, P < 0.05). For card VIII, the number of eye fixations was negatively correlated with motor retardation (rs = – 0.43, P < 0.05). For cards I and V, no significant correlation emerged.
Correlation coefficients between eye fixation frequency upon each area and Brief Psychiatric Rating Scale scores
For cards I, II and V, no correlation was seen between eye fixation frequency upon each area and the clinical symptoms. For card VIII, eye fixation frequency upon area 2 + 3 was negatively correlated with positive symptoms (rs = –0.44, P < 0.05). Eye fixation frequency upon area 4 tended to be positively correlated with positive symptoms (rs = 0.32, P < 0.1). Concerning the subscales of BPRS, eye fixation frequency upon area 2 + 3 was negatively correlated with suspiciousness (rs = –0.58, P < 0.005). Eye fixation frequency upon area 4 tended to be positively correlated with suspiciousness (rs = 0.32, P < 0.1).
Examples of eye scanning behaviors for cards II and VIII are presented in 6, 7.

Card II. Examples of scanning behaviors. In a normal control with a popular response, two dogs D F ± A P, eye fixations are upon broad areas (top). In a schizophrenic patient with a popular response, dogs D FM ± A P, eye fixations are deviated to area 1 + 2, rather than to red areas (centre). In a schizophrenic patient with a non-popular response, blood on menstruation D C, eye fixations are upon relatively broad areas including red areas (bottom).

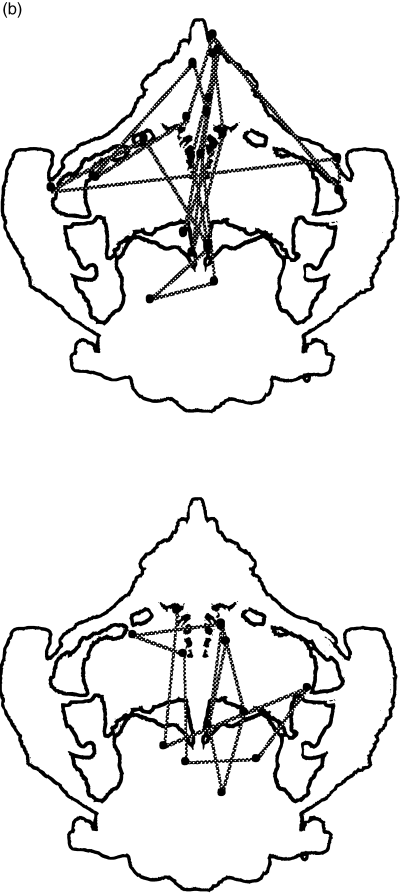
(a) Card VIII. Examples of scanning behaviors. In a normal control with a popular response, animals D F ± A P, eye fixations occur over the entire card (top). In a schizophrenic patient with high score for positive symptoms, a butterfly D F ± A, eye fixations are deviated to area 4 (centre). In a schizophrenic patient with low score for positive symptoms, an open-air bathroom D F-Land, eye fixations are deviated to area 2 + 3 (bottom). (b) In a normal control with a non-popular response, a tomato W CF Food, eye fixations are deviated in area 1 (top). In a schizophrenic patient with a popular response, a flower W CF Pl, eye fixation areas are more restricted compared with a normal control with a popular response (bottom).
Eye movement parameters and neuroleptic dose
For card V, the number of eye fixation areas was negatively correlated with daily neuroleptic dose (r = – 0.41, P < 0.05, n = 24). Negative symptom was positively correlated with dose (r = 0.36, P < 0.05, n = 37). When the effect of negative symptoms was controlled for partial correlation, the partial correlation coefficient for card V between number of eye fixation areas and dose was r = – 0.35 (P > 0.1, n = 24).
DISCUSSION
Eye movement parameters
For all cards, the total scanning length and mean scanning length were shorter, the numbers of eye fixations and eye fixation areas were fewer, and the mean eye fixation time was longer for schizophrenic patients than for controls. Therefore, scanning behaviors during the Rorschach test in schizophrenia were inactive and spatially limited. These results correspond to findings in many previous studies using various stimulus presentation methods.3,14–16 In one study, there was no significant difference between schizophrenic patients and controls in terms of the number of eye fixation areas for achromatic cards and the number of eye fixations per sec for all cards.8 One reason for differences between our results and Harada's may be differences in analyses times. In our study, data were uniformly analyzed during 15 s from the presentation of each card. However, data in Harada's study were analyzed during total response times. In fact, using WAIS picture completion test, Kurachi et al. found differences in the number of eye fixations and the total scanning length between schizophrenic patients and controls during the last 10 s but not during the first 10 s.14 For chromatic cards, reaction time was shorter for schizophrenic patients, which suggests that patients respond quickly without collating their inner image with blots on the cards. Considering a reaction content for card II, in controls the reaction time was longer for the non-popular response subgroup than for the popular response subgroup (t = 2.59, P < 0.05). On the other hand, in schizophrenic patients there was no significant difference between the popular response subgroup and the non-popular response subgroup. In the non-popular response group, reaction time was shorter for schizophrenic patients than for controls (t = 3.21, P < 0.005). Therefore, when perception is integrated with more difficulty, controls may try to integrate with effort, but schizophrenic patients may not.
Relation between eye fixation frequency upon each area and response content
Harada pointed out that schizophrenic patients were less likely than controls to gaze at stimulative areas for maintaining a controlled inner image.8,17,18 In the present results, for card II, when we examined data separately in two subgroups, a popular response group and a non-popular response group, schizophrenic patients in the non-popular response group showed a higher eye fixation frequency upon area 5 + 6 than did the controls. Some of them responded with a color response: the heart, blood, a red sky in night, etc. This may mean that patients who cannot easily integrate perception, frequently gaze at red areas. These results support the hypothesis that schizophrenic patients have impaired control of perceptive attitude toward chromatic stimuli.8,18
In the present results, for card VIII, in controls, eye fixation frequency upon area 1 was higher for the non-popular response subgroup, and eye fixation frequency upon area 5 + 6 was higher for the popular response subgroup. Moreover, in controls, total scanning length and mean scanning length were shorter for the non-popular response subgroup (t = 3.01, P < 0.01 for total scanning length; t = 3.33, P < 0.005 for mean scanning length). Many of them responded with a rough response such as ‘a tomato’ and ‘a pumpkin’. Card VIII is called an ‘all color card’. Under this stimulation, differences in individual response are considered to be marked. In the popular response group, eye fixation frequency upon area 5 + 6 was lower for schizophrenic patients than for controls. In popular responses, it is necessary to gaze at area 5 + 6 for responding with animals, but it is not necessary for responding with a flower. Subjects respond easily with an answer of ‘flower’ when they mainly determine a response content with a color response. On the other hand, they respond with ‘animal’ when they search at area 5 + 6 for confirming the forms. Thus, in the present results, it was significantly difficult to respond with an animal response for schizophrenic patients (χ2 = 3.85, P < 0.05). Healthy subjects catch a general gestalt and select the response area,8 however, schizophrenic patients cannot do this. Eye fixation areas of patients may therefore be more deviated and more restricted than controls. Thus, the quality of responses of schizophrenic patients differs from that of controls.
Correlation between eye fixation frequency upon each area and clinical symptoms
For card VIII, the present results do not correspond with Harada's observation that the eye fixation frequency upon area 4 was significantly lower in schizophrenic patients.8 In the present study, the variances of eye fixation frequency upon areas 2 + 3 and 4 were larger for schizophrenic patients than for controls (F = 2.13, P < 0.05 for area 2 + 3; F = 2.59, P < 0.05 for area 4). Moreover, eye fixation frequency upon area 4 tended to be correlated with positive symptoms. On the other hand, eye fixation frequency upon area 2 + 3 was inversely correlated with positive symptoms. These results suggest that attention may be directed to stimulative areas in patients with high scores for positive symptoms, while patients with low scores for positive symptoms may avoid stimulative areas. The present subjects included patients with varying degrees of positive symptoms, while subjects in Harada's study had chronic schizophrenia without evident positive symptoms. This may contribute to differences between the results of the two studies.
Correlation between eye movement parameters and clinical symptoms
For cards II and VIII, the number of eye fixations was inversely correlated with negative symptoms. For card II, total scanning length tended to be negatively correlated with negative symptoms, and mean eye fixation time was correlated with negative symptoms. These results are consistent with studies by Tsunoda et al.16 and Gaebel et al.19 Tsunoda et al. reported that several eye movement parameters showed inverse correlation with negative symptoms, especially avolition–apathy and affective flattening or blunting (SANS).16 Gaebel et al. found two types of eye movement patterns in schizophrenia; staring scanning and extensive scanning, and indicated associations between staring scanning patterns and negative symptoms.19 In the present study, it was found that these scanning patterns might be more prominent when a chromatic card is used. On the other hand, Williams et al. noted that visual scanning showed minimal correlation with positive and negative symptoms, and suggested that restricted style was generally a typical feature in schizophrenic patients.
For card II, the number of eye fixation areas was inversely correlated with positive symptoms, which might be interpreted differently. One is that gaze avoidance might be more obvious in patients with high scores for positive symptoms. The other interpretation is that these patients might become preoccupied with a few chromatic stimuli. No correlation between eye fixation frequency upon each area and positive symptoms was noted for card II. We could not differentiate between these in the present study.
In summary, the present study indicates that characteristics of visual stimuli affect scanning behaviors in schizophrenic patients, and clinical symptoms partially do too.
Eye movement parameters and neuroleptic dose
Kurachi et al. reported that among parameters, only the mean number of eye fixations showed a significant negative correlation with neuroleptic dose.14 Gaebel et al. found that the number of eye fixations and the mean eye fixation time were negatively correlated with dose, but this was attributed to patients’ thought disorder, not neuroleptics.19 Other previous studies have shown no significant correlation between eye movement parameters and daily dose of neuroleptics.14–16,19–21 In the present study, no significant correlation was evident between eye movement parameters and neuroleptic dose. Thus, neuroleptics appear to have little effect on eye movement parameters in schizophrenic patients.
CONCLUSIONS
Scanning behaviors in schizophrenic patients are affected by characteristics of the visual stimuli presented, and partially by clinical symptoms.
Scanning behaviors in schizophrenia are inactive and limited. These characteristics may be particularly marked in patients with high scores for negative symptoms, especially upon viewing a chromatic card. On the other hand, under this card, eye fixation areas may be narrow in patients with high scores for positive symptoms.
Schizophrenic patients who cannot easily integrate perception, frequently gaze at strong stimuli. Patients with high scores for positive symptoms may be less likely to avoid such stimuli.
ACKNOWLEDGEMENTS
We would like to thank Drs Yutaka Hirota and Tsuyoshi Fukuzako and Mr Kazuhide Motoyama (Taniyama Hospital) for their cooperation on this experiment. We thank Dr Yasuhiro Sakamoto and Ms Taeko Nagano for their assistance.


