Large extent of mitochondrial DNA transfer from Oreochromis aureus to O. niloticus in West Africa
Abstract
Introgressive hybridization has an important evolutionary significance in terms of gene diversity and speciation. Among the major groups of vertebrates, fish show a strong propensity to hybridize. In order to highlight the possible occurrence of gene flow between two tilapia species, Oreochromis niloticus and O. aureus, a comparison of allozyme and mitochondrial DNA (mtDNA) polymorphism was performed on sympatric and allopatric populations of these two species. Nuclear data were congruent with the morphological identification of O. niloticus and O. aureus populations. In opposition, the mtDNA analysis resulted in two strictly differentiated groups which did not follow the morphological and nuclear DNA classification. The first group consisted of East African O. niloticus populations and the second included all the O. aureus populations and the West African O. niloticus populations. Moreover, in some cases, the same sequences were detected in both species. These data strongly support a differential introgression of mtDNA from O. aureus to O. niloticus involving all the West African area. This work points out the risk of misinterpretation of mtDNA or nuclear DNA data when only one single class of marker is used.
Introduction
Natural introgressive hybridization between species has been described in all major groups of organisms (Barton & Hewitt 1989). This phenomenon, even if more common in plants than animals (reviewed in Arnold 1997), seems relatively widespread and to have an important evolutionary significance for adaptation and speciation (Dowling & DeMarais 1993; Arnold 1997; Barton 2001). It provides favourable conditions for major and rapid evolution and has a significant contribution in the within-species gene diversity (Barton & Hewitt 1989; DeMarais et al. 1992; Smith 1992; Arnold 1997; Martinsen et al. 2001). With regard to the other groups of vertebrates, teleosts (mainly freshwater species) show a higher aptitude to hybridize (Hubbs 1955; Campton 1987; Smith 1992). This could result from the combination of intrinsic characteristics such as external fertilization and weakness of ethological reproductive barriers or gametic specificity, and high susceptibility to secondary contacts between recently evolved forms (Campton 1987). Furthermore, viable hybrids are often fertile and gene introgression could frequently occur after natural or man-induced secondary contacts (Billington & Hebert 1991; Verspoor & Hammar 1991). In some cases, the occurrence of hybrid zones has provided very valuable situations to investigate consequences of hybridization in species evolution, the extent and major features of gene co-adaptation and the role of diverse factors which can be involved in initial steps of speciation in fish (Dowling & Hoeh 1991; Smith 1992; Dowling & DeMarais 1993; Bernatchez et al. 1995; Glémet et al. 1998; Lu et al. 2001).
The tribe Tilapiini (family Cichlidae) consists of more than 70 species (Trewavas 1983) widely distributed in Africa (except Madagascar) and the Middle East (Jordan valley and coastal rivers). The Tilapiini have been divided into 10 genera (Trewavas 1983; Stiassny 1991) based on breeding habit, food and trophic adaptations, structural characters and biogeography. The three major genera are Tilapia, Sarotherodon and Oreochromis, and are conveniently known as the tilapias. The distinction of species is notoriously difficult (Nagl et al. 2001), due to large variation and overlapping in the meristic and morphometric characters (Trewavas 1983; Wohlfarth & Hulata 1983). The tilapias exhibit high phenotypic plasticity (between species) resulting in a great capacity to survive in a variety of conditions (Trewavas 1983; Wohlfarth & Hulata 1983). More especially, tilapias exhibit large variation in feeding habits (omnivorous species, phytoplankton feeders, or macrophyte feeders) and a large spectrum of temperature or salinity tolerance.
In the tilapia, hybridization between species generally leads to viable and fertile progenies (Wohlfarth & Hulata 1983). Despite numerous reports of successful hybridization between tilapia species in aquaculture (Wohlfarth & Hulata 1983; Macaranas et al. 1986), only one possible case of true natural hybridization involving three species (Tilapia zillii, T. guineensis and T. dageti) has been described (Pouyaud 1994). Other reports of hybrids found in the wild result from environmental human perturbations such as transplantation of fish species outside their natural range (Gregg et al. 1998) or dam building (Pouyaud 1994).
Within the genus Oreochromis, two species, O. niloticus (the Nile tilapia) and O. aureus (the blue tilapia) inhabit vast areas with large overlap (Trewavas 1983 and Fig. 1). The natural distribution of the Nile tilapia includes the Nilo-Sudanian area (i.e. Senegal, Gambia, Niger, Volta, Chad and Nile basins) as well as several lakes in East Africa, while the Blue tilapia inhabits Senegal, Middle Niger and upper tributaries of the Benoue and Chad basins, the Nile delta, the Jordan basin and some Israeli rivers. These two species show a rather small nuclear genetic differentiation (Nei's standard genetic distance ranges from 0.161 to 0.289; Sodsuck & McAndrew 1991; this study) and can be easily interbred (Wohlfarth & Hulata 1983). Despite these characteristics which could be favourable (but not necessarily sufficient) to hybridization in the wild, hybrids between the two species have never been observed in samples of natural populations. In order to highlight the possible occurrence of gene flow under natural conditions, we have investigated gene diversity of sympatric and allopatric populations of these species, using together nuclear and mitochondrial genome data. The joint utilization of these two molecular methods has been proved very powerful to detect previously unreported cases of hybridization (Lu et al. 2001; Campton 1987).
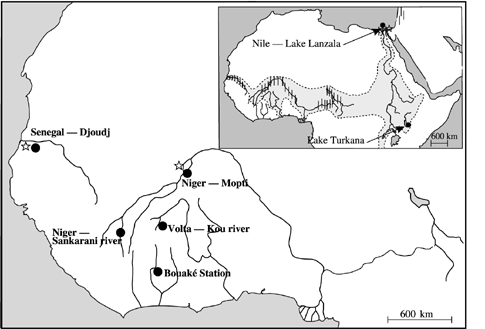
Geographic location of Oreochromis niloticus (•) and O. aureus (⋆) populations sampled. Collection sites are shown. Shaded area indicates the natural distribution range of O. niloticus and the vertical lines indicate that of O. aureus.
Materials and methods
Samples
Seven Oreochromis niloticus and three O. aureus samples of West and East African populations were analysed (Fig. 1 and Table 1). The Nile tilapia samples were a subset of populations already investigated for enzyme polymorphism in Rognon et al. (1996) and represented four West (Sudano-Sahelian area) African and two East (Nile basin and Lake Turkana) African populations and one cultured stock (Bouaké strain). The Blue tilapia samples belonged to populations living in sympatry with Nile tilapia. The two West African O. aureus were directly caught in the rivers and the Lake Manzala sample were provided by the Institute of Aquaculture of Stirling. Fish were identified by morphological characters as described by Trewavas (1983).
| Species | Origin river (locality — country) | Population code | Sample size* | Location number | |
|---|---|---|---|---|---|
| Oreochromis niloticus | Nile (Lake Manzala — Egypt) | E | ONnil | 15 (2) | 1 |
| Lake Turkana (El Molo Bay — Kenya) Niger | E | ONtur | 20 (3) | 2 | |
| — Sankarani river (Selingue — Mali) | W | ONnsa | 9 (4) | 3 | |
| —‘Internal Delta’ (Mopti — Mali) | W | ONnm | 17 (10) | 4 | |
| Volta (Kou river at Bama — Burkina Faso) | W | ONvk | 20 (2) | 5 | |
| Senegal (Djoudj — Senegal) | W | ONsg | 30 (5) | 6 | |
| ‘Bouake strain’ (Bouke Station — Ivory Coast) | E/W | ONbk | 30 (2) | 7 | |
| Oreochromis aureus | Nile (Lake Manzala — Egypt) | E | OAnil | 15 (2) | 1 |
| Niger —‘Internal Delta’ (Mopti — Mali) | W | OAnm | 19 (5) | 4 | |
| Senegal (Djoudj — Senegal) | W | OAsg | 31 (4) | 6 |
- E, East African populations (Nile basin); W, West African populations (Sudano-Sahelian area).
- * Number of sequenced samples is given in parentheses.
Enzyme electrophoresis
Electrophoresis procedures have been described previously in Rognon et al. (1996) and Rognon & Guyomard (1997). The following enzyme systems were examined in each population: Aspartate aminotransferase (AAT, 2.6.1.1), Alcohol dehydrogenase (ADH, 1.1.1.1), Adenylate kinase (AK, 2.7.4.3), Creatine kinase (CK, 2.7.3.2), Esterase (EST, 3.1.1.-), Fructose biphosphatase (FBP, 3.1.3.11), Fumarate hydratase (FH, 4.2.1.2), Glycerol-3-phosphate dehydrogenase (G3PDH, 1.1.1.8), Glucose-6-phosphate isomearse (GPI, 5.3.1.9), l-Iditol dehydrogenase (1.1.1.14), Isocitrate dehydrogenase (NADP+) (IDHP, 1.1.1.42), l-Lactate dehydrogenase (LDH, 1.1.1.27), Malate dehydrogenase (MDH, 1.1.1.37), Malic enzyme (NADP+) (MEP, 1.1.1.40), Mannose-6-phosphate isomerase (MPI, 5.3.1.8), Phosphogluconate dehydrogenase (PGDH, 1.1.1.44), Phosphoglucomutase (PGM, 5.4.2.2) and Superoxide dismutase (SOD, 1.15.1.1). The nomenclature of the enzymes, loci and alleles followed the recommendations proposed by Shaklee et al. (1990).
Mitochondrial DNA sequencing
Mitochondrial DNA was purified from frozen muscles or livers according to Bernatchez et al. (1988). Amplification via polymerase chain reaction (PCR) and sequencing were performed following procedures described in Bernatchez et al. (1992). The cytochrome b fragment was amplified and sequenced with the L14724 (Meyer et al. 1990) and H15149 (Kocher et al. 1989) primers. The control region was amplified with L15926 (Kocher et al. 1989) and H16498 (Meyer et al. 1990) and sequenced with HNIL (5′-GACCTTCAAGAACCGTTAAC-3′). HNIL was designed from partial O. niloticus sequences (using H16498). A 326-base-pair (bp) segment at the 5′ end of the cytochrome b and a 262-bp segment near the 5′ end of the control region were sequenced in all individuals, except for those from Lake Turkana (and two Nile tilapia individuals from Mopti) where only the control region was studied.
Data analysis
The allele frequencies at enzyme loci were calculated by direct counting of alleles. Agreement of the observed genotype frequencies to the Hardy–Weinberg and genotypic linkage equilibrium expectations were checked by exact tests using genepop (Raymond & Rousset 1995). Unbiased estimates of gene diversity (HS) and standard genetic distances were calculated according to Nei (1987) using biosys-1 (Swofford & Selander 1989) and phylip (Felsenstein 1993). A phenogram was generated with the upgma cluster analysis (Sneath & Sokal 1973) using phylip. Bootstrap values were computed over 1000 replications.
Sequence data were subjected to distance analysis using phylip. The distance measure used was the estimate of nucleotide substitution calculated under the Kimura two-parameter model (Kimura 1980). Phenograms were generated with the upgma cluster analysis (1000 replications). Intra- and interpopulation genetic diversity was measured by the maximum-likelihood estimation of the average number of nucleotide substitutions per site within and between populations (Nei 1987). The resulting matrix of net interpopulation nucleotide divergence was used to build an upgma phenogram of the populations. In order to visualize the genetic relationship within haplotypes, sequences were subjected to a parsimony network analysis (Templeton et al. 1992) using tcs (Clement et al. 2000).
Results
Allozyme variation
Table 2 reports data obtained on Oreochromis aureus (this study) and on O. niloticus (Rognon et al. 1996). All samples were in agreement with the Hardy–Weinberg equilibrium and no significant linkage disequilibrium was found. Fourteen loci (out of 30 loci screened) were found to be polymorphic and three of them were diagnostic of the two species, namely AAT-3*, EST-2* and IDHP-1* (only one OAsg individual was heterozygote for the Nile and blue tilapia alleles at EST-2*). A fourth locus, MDH-3*, was fixed for allele *119 in all the Blue tilapia populations while in the Nile tilapia, this allele was essentially found in the Lake Turkana sample. Ten loci exhibited variation in O. niloticus populations and four loci were polymorphic among the O. aureus populations. In both species, the largest allele frequency differences were found between the eastern and western populations. Moreover, in the Blue tilapia, ADH* was found fixed for two alternative alleles in the Nile delta (*-50) and the Sudano-Sahelian area (*-100).
| Locus | Allele | ONnil | ONtur | ONnm | ONnsa | ONkr | ONsg | ONbk | OAni | OAnm | OAsg |
|---|---|---|---|---|---|---|---|---|---|---|---|
| AAT-2 * | * 55 | 0.133 | — | 0.591 | 0.286 | 0.700 | 0.533 | 0.400 | — | — | — |
| AAT-3 * | * 78 | — | — | — | — | — | — | — | 1 | 1 | 1 |
| ADH * | *–50 | — | — | — | — | — | — | — | 1 | — | — |
| EST-2 * | * 105 | — | — | — | — | — | — | — | 1 | 1 | 0.984 |
| FH * | * 120 | 0.833 | 0.950 | — | — | — | — | 0.500 | — | — | — |
| GPI-1 * | * 0 | — | 0.525 | — | — | — | — | — | — | — | — |
| –1100 | — | — | — | — | — | — | — | — | 0.024 | — | |
| IDDH * | * 167 | — | — | — | — | — | — | 0.100 | — | — | — |
| * 20 | — | — | 0.437 | 0.278 | 0.316 | 0.367 | 0.150 | — | — | — | |
| IDHP-1 * | * 108 | — | — | — | — | — | — | — | 1 | 1 | 1 |
| LDH-2 * | * 52 | — | — | — | — | 0.200 | — | 0.050 | — | — | — |
| MDH-3 * | * 119 | — | 0.500 | — | — | — | 0.017 | 0.017 | 1 | 1 | 1 |
| MEP-1 * | * 125 | 0.100 | — | 0.200 | 0.056 | 0.200 | — | 0.050 | — | — | — |
| MEP-2 * | * 120 | 0.733 | — | — | 0.222 | — | — | 0.183 | — | — | — |
| * 92 | — | — | — | — | — | — | — | — | 0.095 | — | |
| MPI * | * 107 | — | — | — | — | — | — | 0.100 | — | — | — |
| SOD * | * 177 | — | — | — | — | — | 0.133 | — | — | 0.071 | 0.016 |
| H% | 3.7 | 3.7 | 4.5 | 4.5 | 5.1 | 4.1 | 7.1 | 0 | 1.2 | 0.2 | |
| P% | 13.3 | 10 | 10 | 13.3 | 13.3 | 10 | 23.3 | 0 | 6.7 | 0 |
- P%, percentage of polymorphic enzyme loci; H%, percentage of expected average heterozygosity at enzyme loci.
- Population codes are given in Table 1.
Oreochromis aureus exhibited lower variation than wild populations of O. niloticus (0–6.7% vs. 10–13% for the percentage of polymorphic loci and 0–1.2% vs. 3.7–5.1% for HS). The domesticated sample, ONbk, was the most variable (23.3% or the percentage of polymorphic loci and 7.1% for HS).
Genetic relationships between populations are presented in the upgma phenogram (Fig. 2a) derived from standard genetic distances (Table 3). Mean genetic distance was 0.185 ± 0.082 (standard error was computed following Nei (1987) — equation 9.44 for Î < 0.85 and ?< 0.02) between species — with a distribution range from 0.1535 to 0.2387. The intraspecific Nei genetic distances ranged from 0.0023 to 0.0759 among O. niloticus populations and from 0.0004 to 0.0346 among the O. aureus populations. These species form two distinct and strongly supported monophyletic groups (bootstrap value ≥ 92%). In each species, Nile basin and Sudano-Sahelian populations were clearly separated.
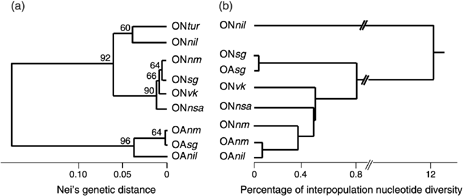
Phylogenetic relationships among Oreochromis niloticus and O. aureus. Population codes are given in Table 1. (a) upgma tree derived from standard Nei's genetic distances based on allele frequencies at 30 loci. Bootstrap values (1000 replications) higher than 50% are given. (b) upgma tree based on the maximum likelihood estimation of the average number of nucleotide substitutions per site among populations (using both cytochrome b and control region).
| ONtur | ONnil | ONnsa | ONnm | ONvk | ONsg | OAnil | OAnm | OAsg | |
|---|---|---|---|---|---|---|---|---|---|
| ONnil | 0.0389 | — | 12.43 | 12.19 | 11.72 | 11.52 | 12.32 | 12.40 | 11.57 |
| ONnsa | 0.0586 | 0.0374 | — | 0.545 | 0.492 | 1.115 | 0.402 | 0.473 | 1.119 |
| ONnm | 0.0723 | 0.0587 | 0.0066 | — | 0.600 | 0.632 | 0.360 | 0.366 | 0.641 |
| ONvk | 0.0759 | 0.0618 | 0.0103 | 0.0037 | — | 1.144 | 0.435 | 0.505 | 1.149 |
| ONsg | 0.0662 | 0.0554 | 0.0049 | 0.0023 | 0.0045 | — | 0.707 | 0.605 | 0.038 |
| OAnil | 0.2035 | 0.2387 | 0.1951 | 0.2106 | 0.2151 | 0.2029 | — | 0.068 | 0.711 |
| OAnm | 0.1640 | 0.1956 | 0.1554 | 0.1712 | 0.1755 | 0.1631 | 0.0346 | — | 0.609 |
| OAsg | 0.1617 | 0.1954 | 0.1535 | 0.1684 | 0.1725 | 0.1609 | 0.0340 | 0.0004 | — |
- Population codes are given in Table 1.
Mitochondrial DNA variation analysis
Thirty-five variable nucleotide positions (Fig. 3 and Table 4) were found in the cytochrome b segment, involving 36 mutational events. These numbers were significantly higher in the control region (50 variable sites and 55 mutational events; P values < 0.005). Sequence variations were predominantly due to transitions: 31 vs. 5 transversions in cytochrome b and 25 vs. 14 transversions in the control region. Variation in the cytochrome b gene resulted from nucleotide substitutions only, while 12 deletion/insertion events, including one involving five base-pairs, were found in the control region (Fig. 3). Only one substitution in the cytochrome b region resulted in an amino acid replacement (Fig. 3).
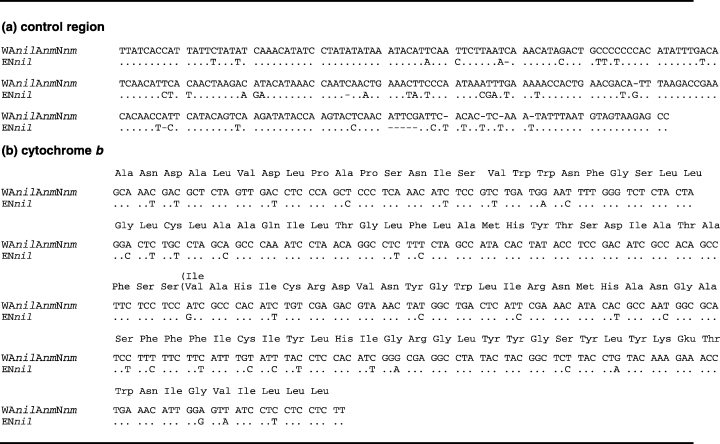
Mitochondrial DNA sequences (L strand) of (a) a 262-bp segment of the control region and (b) a 326-bp segment of the cytochrome b gene from Oreochromis aureus (type ‘WaAnilAnmNnm’) and O. niloticus (type ‘Ennil’). Nucleotides are given for ‘Ennil’ when different from ‘WanilAnmNnm’, while identity is indicated by dots. Dashes indicate deletion/insertion events. For the cytochrome b gene, the inferred amino acid sequence is indicated. The Sequences presented in this paper have been entered in GenBank under the accession numbers AF550009 to AF550047).
| Genotypes | Control region | Cytochrome b | Populations where this genotype was found (no. of individuals) |
|---|---|---|---|
| 15111111111122 59012344566633 105759416936 | 688122 347047 869 | ||
| WAnilAnmNnm | CCCCCCAGAACTCT | GAACCT | OAnil (2), OAnm (2), ONnm (4) |
| WAnm1 | ·············· | A····· | OAnm (1) |
| WAnm2 | ···········C·· | ·C···· | OAnm (1) |
| WAnm3 | ·····T········ | ······ | OAnm (1) |
| WAnm1 | ·T··T··–G·T·T· | ····T· | ONnm (1) |
| WAnm2 | ····T······C·· | A····· | ONnm (1) |
| WAnm3 | ···TT······C·· | A····· | ONnm (1) |
| WAnm4 | ·T·····–····T· | A····C | ONnm (3) |
| WAnsa1 | ·T·····–G····· | ······ | ONnsa (2) |
| WAnsa2 | ·T·····–GG···· | ······ | ONnsa (2) |
| WAsgNsg | T···T······C·· | A····· | OAsg (3), ONsg (4) |
| WNsg | T···T······C·· | A·T··· | ONsg (1) |
| WAsg | T···T······C·C | A····· | OAsg (1) |
| WNvk1 | ·T····–·····T· | ···T·· | ONvk (1) |
| WNvk2 | ·TT···–·····T· | ······ | ONvk (1), ONbk (1) |
- Nucleotide at each position is given for genotype WAnilAnmNnm. For other genotypes, nucleotides are given when different from this, while identity is indicated by dots. Dashes indicate deletion/insertion events. Numbers refer to sequence position in Fig. 3.
Eighteen mitochondrial genotypes were identified among O. niloticus and O. aureus populations and they could be classified into two highly divergent lineages. These two lineages differed by a total number of 77–81 mutational events (Table 4, 3, 4) resulting in very high percentage divergence estimates (from 10.09 to 11.13% for the cytochrome b gene and from 12.96 to 15.87% for the control region). Each group was supported by 100% bootstrap proportions for both the control region (Fig. 5) and the cytochrome b gene (not shown).
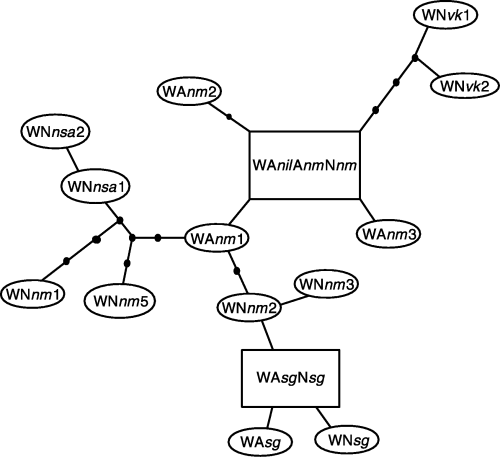
Parsimony network of the 15 mtDNA haplotypes found in the Oreochromis aureus populations and West African O. niloticus ones. Rectangular boxes indicate haplotypes present in both species. Size of boxes indicates the frequency of haplotypes. Each node is one mutational steps away of the next node. Black dots indicate hypothetical intermediate haplotypes.
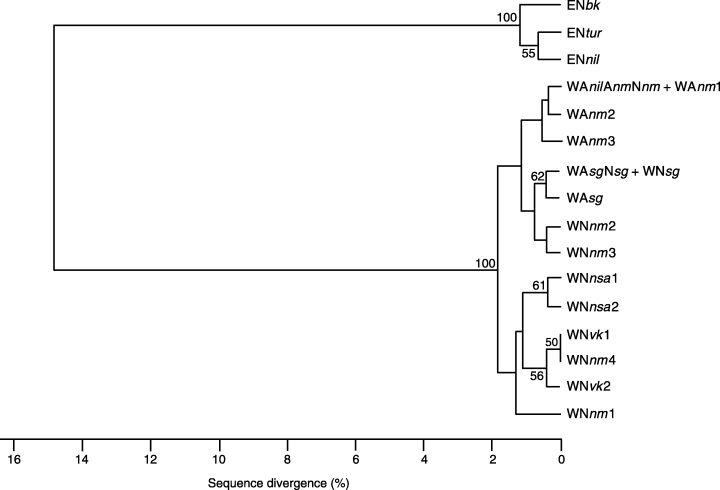
upgma tree among individuals representing 18 mtDNA variants resolved by control region segment sequence data. Topology is based on pairwise percentage estimates of sequence divergence. Bootstrap values (1000 replications) higher than 50% are given (see text and Table 4 for genotype codes).
One lineage, called West lineage, involved all the Blue tilapia populations, the West African Nile tilapia populations and one individual (out of two) for the Bouaké strain. This lineage included 15 different clones (Table 4 and Fig. 4) with a range of pairwise sequence divergence estimates from 0.17 to 1.56%, implying 1–10 mutational steps between each pair. In the second sampling locality, individuals from both species shared the same genotype. In Senegal samples, the ‘WasgNsg’ genotype was present in all but one O. niloticus and one O. aureus. At Mopti (Niger), the ‘WanilAnmNnm’ genotype was shared by four O. niloticus and two O. aureus. This genotype was also found in the Blue tilapia samples from the Nile delta. In agreement with the geographical distribution, haplotypes occurring in Volta and Senegal samples took peripheral positions in the parsimony network (Fig. 4).
The second lineage (East lineage) was found in East African O. niloticus populations and the second individual of the Bouake strain sample. The sequence divergence estimate between haplotype from the Lake Manzala population (‘Ennil’) and the Bouake strain one (‘Enbk’) was 0.9% (cytochrome b and control region), implying five mutational steps. Two clones (control region only) were found in the Lake Turkana population, the Lake Manzala clones (‘Ennil’) and another one (‘Entur’) differing by two transition events.
The occurrence of western (‘WNvk2’) and eastern (‘Enbk’) mitochondrial DNA (mtDNA) clones in the Bouaké strain [also supported by PCR-random fragment length polymorphism (RFLP) analysis from 11 individuals — unpublished data] reflected the double origin of this strain which resulted from a 1971–72 mixing of the station's Volta and Nile stocks (Lazard & Rognon 1997).
Population genetic diversity analyses among the two species (Table 3 and Fig. 2) clearly illustrate the discrepancies between allozyme and mitochondrial data. Phylogenetic relationships between species provided by allozymes were consistent with the morphological predictions (Trewavas 1983) and both O. niloticus and O. aureus were clearly distinguished (Fig. 2a). In contrast, mtDNA data did not reflect the species designation (Fig. 2b) and two noteworthy findings appeared: (i) a null or very small mitochondrial genome divergence, between the two species in the Sudano-Sahelian zone, and (ii) a strong mtDNA divergence within O. niloticus between East African populations and the others.
Discussion
Ancestral polymorphism vs. differential mtDNA introgression
The mtDNA sequence divergence usually reported between fish species (Phyllips & Oakley 1997; Machordon & Doadrio 2001), including other tilapia species (Seyoum 1989; Rognon 1993; Nagl et al. 2001), greatly exceed those observed between Oreochromis niloticus and O. aureus in the Niger or Senegal rivers. Our results fit with intraspecific variation levels found in fish (Carr & Marshal 1991; Nesbøet al. 1999; Bernatchez 2001; Kontula & Väinölä 2001; Kotlík & Berrebi 2001; Near et al. 2001). Two alternative hypotheses could explain the high similarity of mtDNA genomes observed among the West African Nile and Blue tilapia populations and their large divergence with the East African O. niloticus populations: retention of ancestral polymorphism or secondary introgressive hybridization (Avise 1994).
On the basis of PCR-RFLP analysis, the ancestral polymorphism hypothesis has been proposed by Agnèse et al. (1997) to interpret the paraphyletic relationships of O. niloticus with regard to O. aureus in mtDNA phylogeny. Two possible scenarios of speciation can be considered under this hypothesis. First, O. aureus is the result of a recent speciation event from the western Nile tilapia group. This scenario is in agreement with coalescent times estimated from mtDNA data. Recent estimations of substitution rates reported for the mtDNA control region in fish range from 3.6% per million years (Donaldson & Wilson 1999) to 5.6% per million years (Nagl et al. 2001). and would give coalescence times comprised between 200 000 and 300 000 years between the two species within the Sudano-Sahelian area. However, these values do not fit with those obtained from the proteins data (McAndrew & Majumdar 1984; Sodsuck & McAndrew 1991; this study) and those based on fossil records, morphological and biogeographical considerations (Trewavas 1983). Trewavas (1983) argues against a recent event of speciation and states that speciation had taken place during the Upper Pliocene (3.5–1.8 million years ago). This is in agreement with coalescent time estimations derived from our allozyme data assuming the molecular clock hypothesis and using the substitution rate obtained by Gorman et al. (1976) for similar protein data. This substitution rate seems the most appropriate for our data (McAndrew & Majumdar 1984; Rognon et al. 1996) since it has been obtained for fish species which have diverged over the same period as that deduced from Tilapiine fossil records (Roberts 1975). When applied to our data, this substitution rate gave a divergence time of 3.3 ± 1.5 million years since speciation between O. niloticus and O. aureus.
In the second scenario, we assume that speciation occurred during the Pliocene, in agreement with the protein data, fossil records and biogeographical considerations. However, the divergence value between Western O. niloticus and O. aureus mtDNA is too low with respect to this period length and is incompatible with the occurrence of O. niloticus and O. aureus individuals sharing identical mtDNA sequences. For a coalescent time of 3.5 million years ago (beginning of Upper Pliocene), instead of an average divergence percentage of 1% (using control region data) found between Sudano-Sahelian O aureus and O. niloticus populations, we would expect a value of 13–20%. Note that the observed divergence percentages between the West and East tilapia clones falls within this range (see Results section).
Therefore, a more likely alternative explanation is the complete replacement of mtDNA of one species by that of the other. Such a differential introgression has been reported in many organisms (Ferris et al. 1983; Spolsky & Uzzell 1984; Solignac & Monnerot 1986; Dowling & DeMarais 1993; Bernatchez et al. 1995; Andersson 1999; Lu et al. 2001; Martinsen et al. 2001), leading frequently to discrepancies between mtDNA and the nuclear genome or species designation. Therefore, under this hypothesis, the East and West lineages would be the O. niloticus- and O. aureus-specific lineages, respectively, and the occurrence of the west lineage in the western Nile tilapia populations would result from an introgression of Blue tilapia mtDNA into the Nile tilapia nuclear background. Accordingly, the divergence rate observed for proteins between Nile and Blue tilapias and between East and West mtDNA should reflect the same time since speciation, as effectively observed.
Period of mtDNA transfer and patterns of colonization
According to Trewavas (1983), the ancestors of the current O. aureus species inhabited in the Jordan Valley and the Nile delta. In this latter area, O. aureus met O. niloticus originating from the Nile basin (Trewavas 1983; Lowe-McConnell 1988; Agnèse et al. 1997). The westward spread of both species from Nile to Sudano-Sahelian rivers happened probably in Pleistocene times (Philippart & Ruvet 1982; Trewavas 1983) and subsequent to their meeting. During the Pleistocene, Africa was subjected to strong climatic fluctuations, with dry and wet phases, which have profoundly acted on the hydrographical systems (Grove 1985) and, consequently, on the geographical distribution of fish species (Roberts 1975). In the Sudano-Sahelian area, aquatic habitats were dramatically reduced during the dry period and restricted to rare refuge zones, such as Upper Benoue (Roberts 1975). Since such major changes are believed to profoundly disturb reproductive barriers between fish species (Campton 1987; Dowling & DeMarais 1993), Nile tilapia and blue tilapia could have repeatedly met favourable conditions for hybridization during Pleistocene and Holocene.
Since the West lineage is present in all West African samples, including Volta River where O. aureus is not recorded, introgression could have started at any time before the establishment of the current hydrographical and populating patterns which is recent (Holocene). The absence of clear differentiation between the mtDNA of the two species and the existence of similar sequences between individuals belonging to both species, in the Senegal or Niger rivers, rather suggest that introgression occurred recently and could still be proceeding, even at a low rate; in this case, nuclear DNA introgression could be prevented by selection (see Mode of mtDNA transfer).
The large number of clones exhibited by the Niger samples, the topology of the haplotype network (Fig. 4) and the fact that Upper Benoue belongs to this basin, argue in favour of the Upper Benoue as refuge (Roberts 1975) and the Niger basin as a centre of dispersion throughout the Sudano-Sahelian region during pluvials (Roberts 1975). Populations from the Senegal River exhibited a lower enzyme polymorphism than the others. The three Senegalese mtDNA haplotypes appeared as the most divergent within the West lineage, and one of them was largely shared by the two species. These results could be explained by a founder effect in the new colonizing population at the margin of the distribution. Such a scenario is plausible because Roberts (1975) and Grove (1985) claimed that the Senegal River was greatly reduced, or even ceased to flow, during the last interpluvial (from 40 000 to 12 000 years before present) and its present Nilo-Sudanian ichthyofauna is due to a re-colonization from the Niger. The geographical distribution of the West mtDNA lineage probably encompassed also the Chad basin since Agnèse et al. (1997) found the same PCR-RFLP haplotype (as well as close allozymes frequencies) in Lake Chad as in the Volta and Niger basins.
In the Nile delta, the current mtDNA pattern could simply reflect the initial situation or a secondary contact, between O. aureus issuing from Sudano-Sahelian rivers and O. niloticus issuing from Blue Nile refuge zone (Roberts 1975).
Mode of mtDNA transfer
Fixation of the west mtDNA lineage into the western populations of O. niloticus could be due to fixation by genetic drift, bottleneck, selection favouring West lineage, interactions between nuclear and mitochondrial genes, long-term unidirectional hybridization, sex-ratio of hybrid progenies, or combinations of these factors (Asmussen et al. 1987; Asmussen et al. 1989; Barton & Hewitt 1989; Wirtz 1999).
Although an effect of random drift cannot be excluded here, selection models have been preferentially invoked to explain similar situations in other species. Such models can assume (i) mitochondrial neutrality and selection against the foreign nuclear genes (Takahata & Slatkin 1984; Dowling & Hoeh 1991; Martinsen et al. 2001) or (ii) direct selection on mtDNA (Bernatchez et al. 1995; Duvernell & Aspinwall 1995; Glémet et al. 1998). MacRae & Anderson (1988) and Aubert & Solignac (1990) have observed strong differential introgression involving nuclear–cytoplasm interactions in experimental tests.
Long-term unidirectional hybridization could be favoured by mating behaviour and deviation of sex ratio. In the Sudano-Sahelian region, O. niloticus outnumber O. aureus (Trewavas 1983; Lowe-McConnell 2000) and unidirectional introgression could also result from such demographic disequilibrium, where female parents are from the rare species (Hubbs 1955; Avise 1994; Wirtz 1999). Finally, cross-breeding between O. niloticus males and O. aureus females, generally gives more females in the progeny than the reciprocal cross (Wohlfarth & Hulata 1983) and provides an additional argument for a unidirectional introgression of mtDNA from O. aureus to O niloticus.
In conclusion, unidirectional and complete introgression of mtDNA from O. aureus to O. niloticus is the most consistent hypothesis with the pattern of nuclear and cytoplasmic variation observed within and between the two species in the Sudano-Sahelian region. Although this introgression could be ancient, its occurrence or persistence in recent times is supported by the lack of differentiation between mtDNA sequences of the two species. The role of selection during introgression remains questionable and action of random drift only cannot be excluded. Finally, our results provide a new example which stresses the need to combine different molecular approaches in phylogenetic reconstruction and gene flow studies and the risk of misinterpretation when only one class of markers is used (Smith 1992; Moore 1995; Andersson 1999; Lu et al. 2001).
Acknowledgements
We would like to thank the Office des Parcs Nationaux du Sénégal, the staff of the ORSTOM Centre at Bamako (Mali), G. Horstgen-Schwark (Institut für Tierzucht und Haustiergenetik, University of Göttingen, Germany), B. McAndrew (Institut of Aquaculture, University of Stirling, UK), B. Chevassus (Laboratoire de Génétique des Poissons, INRA, France), A. Togueiny (Laboratoire de Physiologie des Poissons, INRA, France) and T. Niaré (Projet Delta Central, Mali) for their co-operation in obtaining samples. This study was supported by a grant from the CIRAD.
References
Xavier Rognon and René Guyomard belong to institutes (INA P-G and INRA) where research projects are devoted to organisms of economic value. Their scientific activities aim to describe genetic diversity within fish and farm animal species and to understand its significance with respect to conservation and selective breeding purposes. This study was mainly conducted during the PhD thesis of X. Rognon on the genetic diversity and phylogenetic relationships in Tilapias.


