Relationships between bone mineral density, serum vitamin D metabolites and calcium:phosphorus intake in healthy perimenopausal women
Abstract
Abstract. Brot C, Jørgensen N, Madsen OR, Jensen LB, Sørensen OH (Copenhagen Municipal Hospital, Copenhagen, Denmark). Relationships between bone mineral density, serum vitamin D metabolites and calcium:phosphorus intake in healthy perimenopausal women. J Intern Med 1999; 245: 509–516.
Objectives. To determine the relationships between serum vitamin D metabolites, bone mass, and dietary calcium and phosphorus in a cohort of 510 healthy Danish perimenopausal women.
Design. A population-based cross-sectional study.
Subjects. A total of 510 healthy women aged 45–58 years, with amenorrhoea for 3–24 months. None of the women was using hormone replacement therapy.
Measurements. Measurements of total bone mineral content and regional bone mineral density were performed by dual-energy X-ray absorptiometry. Analyses of serum levels of 25-OHD and 1,25-(OH)2D, intact PTH, ionized calcium and phosphate, as well as biochemical markers of bone turnover in blood and urine. Assessment of calcium and phosphorus intake using dietary records.
Results. A consistent inverse relationship between serum 1,25-(OH)2D and bone mineral content/density was found in whole-body mineral content (P = 0.001), spine (P = 0.005) and femoral neck (P < 0.05). There was a positive relationship between levels of 1,25-(OH)2D and biochemical bone markers, indicating that high levels of 1,25-(OH)2D are accompanied by increased bone turnover. The dietary calcium:phosphorus ratio was inversely related to serum 1,25-(OH)2D (P = 0.04) and positively related to bone mineral density (P < 0.0005). No relationships could be detected between levels of PTH, serum ionized calcium and phosphate, and serum vitamin D metabolites.
Conclusion. Within normal physiological range, elevated levels of 1,25-(OH)2D were associated with decreased bone mineral density and content, reduced calcium:phosphorus ratio in the diet and increased bone turnover.
Introduction
Vitamin D metabolites participate in the regulation of calcium homeostasis and bone metabolism [1, 2]. Their role in determining bone mass, however, is still not clear. It is well known that severe and prolonged vitamin D deficiency causes osteomalacia. Subclinical vitamin D deficiency is common in the elderly [3] and may lead to development of secondary hyperparathyroidism and bone loss, for which reason it has been implicated in the pathogenesis of senile osteoporosis [4]. Whilst there is good evidence that extreme old age is associated with a decline in serum vitamin D metabolites [5, 6], this seems not to be the case earlier in life. Kinyamu et al. [6] found no differences in serum 1,25-dihydroxyvitamin D (1,25-(OH)2D) between free-living elderly women with a mean age of 71 and a group of 30-year-old women, whereas a group of elderly women with a mean age of 84 living in nursing homes had a significantly lower serum 1,25-(OH)2D. Natural menopause has not been shown, in either cross-sectional or prospective studies, to alter vitamin D levels [7–9].
The relationship between vitamin D status and bone mass within the normal physiological range is still unsettled.
Dietary intake of calcium and phosphorus has been shown to affect both bone mass and vitamin D metabolism [10, 11]. Calcium intake in Scandinavia is generally high. The aim of our study was therefore to examine the relation between bone mass, vitamin D metabolites, and dietary calcium and phosphate in a cohort of normal Danish perimenopausal women.
Materials and methods
Subjects
The present group was part of an ongoing community-based study, the Danish Osteoporosis Prevention Study (DOPS), a prospective multicentre trial on hormone replacement therapy. Perimenopausal women from the general community were recruited by mailing all women aged 45–58 living in the catchment area of the four hospitals involved. The inclusion criteria were amenorrhea between 3 and 24 months and Caucasian race. Hysterectomized women were accepted as perimenopausal if they were younger than 53 and had FSH levels above the upper limit for premenopausal women. None was currently using oestrogen or other steroids, and none was suffering from any endocrinological disease affecting calcium metabolism. Women with major heart, liver or kidney diseases or malignancies were excluded. The biochemical screening prior to inclusion ensured that all participants had serum levels of calcium, phosphate and alkaline phosphatase within the normal range. The recruitment and screening procedures have been described in detail previously [12]. This study deals with the 510 women participating in Copenhagen, Denmark (latitude 55°N).
Dietary assessments
Calcium and phosphorus intakes were assessed by using 4- or 7-day dietary records in 488 participants. They recorded all foods and beverages that were consumed daily, estimating quantities in household measures. They received oral and written instructions, and the importance of keeping accurate records was explained. A trained dietician reviewed the records of 50% of the participants so as to obtain additional information to improve the estimation of household measures. All food records were analysed for nutrients intake using Dankost Software (version 1.3b), a program based on the official Danish food tables [13].
Biochemical measurements
All blood samples were obtained from the subjects under fasting conditions between 08.00 and 11.00 h. Serum was stored at –80 °C until analysis and had a single thaw at the time of analysis. Serum levels of 25-hydroxyvitamin D (25-OHD) and 1,25-(OH)2D were measured by radioimmunoassay. This method involves specific extraction procedures with ether, preliminary chromatography and a competitive binding assay using rat kidneys (for 25-OHD) and calf thymus (for 1,25-(OH)2D) [14, 15]. The limits of detection were 5 ng mL–1 and 5 pg mL–1, respectively. The intra- and interassay precisions are, respectively, 8.3 and 10.2% for 25-OHD, and 8.4 and 12.9% for 1,25-(OH)2D. Vitamin D2 and D3 metabolites were measured together by these methods.
Serum alkaline phosphatase, phosphate and ionized calcium values were determined using standard methods (Cobas Mira, Roche and Radiometer ICA-1). Serum osteocalcin (s-OC) was measured with a DAKO osteocalcin ELISA kit, and plasma follicle-stimulating hormone (FSH) with a DPC RIA kit.
Intact PTH (PTH) was measured with an Immulite intact PTH immunoassay kit. The intra-and interassay precisions were 5.4–7.0 and 5.0–5.5%, respectively.
Urine pyridinium cross-links, i.e. pyridinoline (u-Pyr) and deoxypyridinoline (u-Dpyr), were measured by high-performance liquid chromatography and fluorescence detection after hydrolysis of the urine, as previously described [16].
Bone mass measurements
Bone mineral content (BMC) of the whole body was measured using a Hologic QDR-1000 W DXA scanner (Hologic Inc., Waltham, MA, USA) for the first 294 scans and a Hologic QDR-2000 W scanner for the rest. Pencil beam measurements were used for all whole-body scans, as well as the regional scans performed on the QDR-1000 W. The spine and hip scans on the QDR-2000 were performed with a fan beam. The densitometers were cross-calibrated at the clinic and the calibration factors on the QDR-2000 were set to obtain phantom results identical to those obtained on the QDR-1000 W, as described earlier [17]. The precision error for BMD assessments in vivo, as determined by the coefficient of variation, was 1.4% for the lumbar spine, and 0.8% for the hip and whole body.
Statistical analysis
Analysis included standard descriptive statistics. Two-sample t-tests were performed to compare subgroups. The relationships between levels of 1,25-(OH)2D and bone markers were assessed by calculating Pearson correlations. Stepwise multiple regression analysis (backward elimination method) was used to assess the influence of endogenous vitamin D level and dietary habits on bone mass. The standardized coefficients were calculated by multiplying the regression coefficients with the ratio of standard deviations Sx/Sy. The P-values in the text and tables were two-tailed. The significance limit was P≤ 0.05.
The analyses were performed with the Fastat Statistics Package for Macintosh.
The study was approved by the Ethics Committee of Copenhagen, and written informed consent was obtained from all subjects.
Results
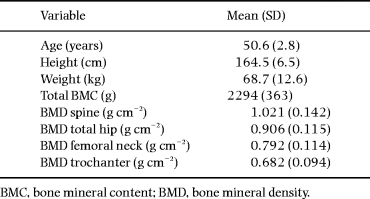
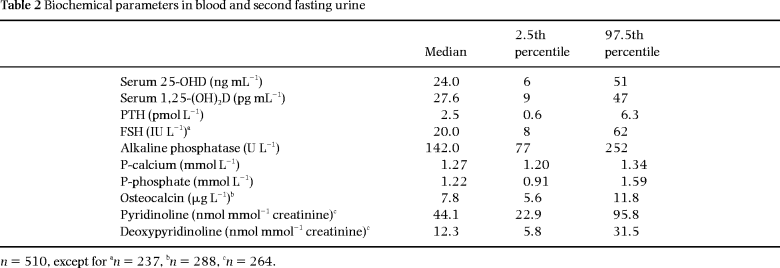
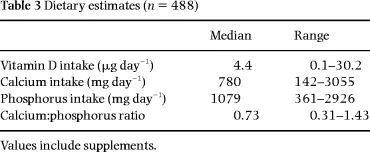
Mean values of anthropometric, densitometric and biochemical variables are shown in Tables 1 and 2. Dietary data are shown in Table 3.
There was no significant correlation (P = 0.09) between values for 25-OHD and 1,25-(OH)2D. Ten per cent of the women (n = 50) had serum 25-OHD levels below 12 ng mL–1. This subgroup also had significantly lower serum 1,25-(OH)2D (24.9 vs. 27.9 pg mL–1, P < 0.05), but they did not differ from the rest with regard to PTH and P-calcium levels.
Relationship between bone mineral density and endogenous vitamin D levels
We found, in both univariate and multiple regression analyses, a consistent negative relationship between the serum level of 1,25-(OH)2D and bone mass in all regions, i.e. whole-body BMC, spine bone mineral density (BMD) and femoral neck BMD ( Tables 4 and 5).

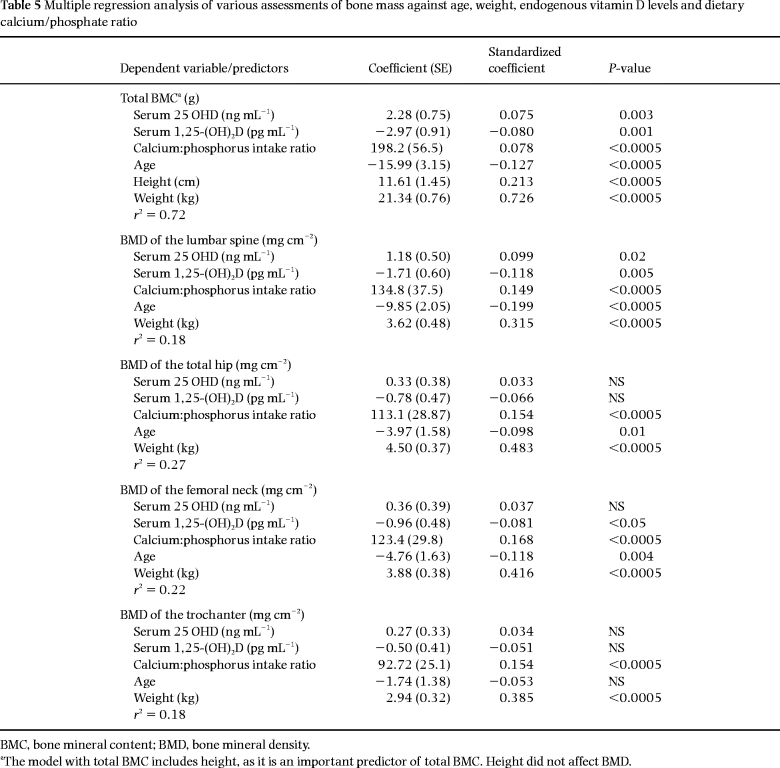
The serum level of 25-OHD was not related to bone mass in univariate analysis, but after including age, height and weight in a multivariate model, a positive significant relationship was found for the spine and whole body, but not the hip. These relationships between bone assessments and both serum 25-OHD and serum 1,25-(OH)2D remained unchanged even after excluding the above-mentioned subgroup with hypovitaminosis D. The results of the multiple regression analysis are shown in Table 5. The regression coefficient corresponding to a specific covariate estimates the effect on the response of a one unit increase in this covariate (all other covariates held fixed). For example, the coefficient corresponding to serum 1,25-(OH)2D in the analysis of total bone mass is estimated to be –2.97, which means that an increase of 1 pg mL–1 in serum 1,25-(OH)2D corresponds to a decrease of 2.97 g in total bone mass. The standardized coefficient is 0.078, which means that two individuals with a difference of one standard deviation in serum 1,25-(OH)2D (and with all other covariates identical) will, on average, differ by 7.8% of a standard deviation in total bone mass.
Calcium and phosphorus intake
There was a trend towards an inverse relationship between the serum level of 1,25-(OH)2D and the estimates of dietary calcium intake (P = 0.06). Fourteen per cent of the women (n = 70) had low calcium intake, i.e. less than 500 mg day–1. This group differed from the rest (n = 418) by having higher levels of 1,25-(OH)2D (P < 0.01). The group with the lowest estimated calcium intake did not differ from the rest in respect of serum calcium, PTH and bone markers. However, the group with very high calcium intakes (i.e. > 1500 mg day–1) (n = 14) had significantly lower PTH than the rest (2.0 vs. 2.8 pmol L–1, P = 0.001).
As expected, there was a high correlation between calcium and phosphorus intake (r = 0.866, P < 0.0005). However, dietary phosphorus was not related to serum 25-OHD, serum 1,25-(OH)2D or PTH. In univariate and multivariate analyses, there was a trend towards a slightly positive association between phosphorus intake and bone measurements, which only reached significance at the trochanter (P = 0.03).
The calculated ratio between calcium and phosphorus in the diet (Ca:P ratio) was negatively related to levels of 1,25-(OH)2D (P = 0.04). This ratio did not relate to levels of PTH, P-calcium, P-phosphate or bone markers.
In BMC and regional scans, the influence of calcium intake and Ca:P ratio was investigated by performing multiple regression analyses considering the variables age, height, weight, serum 25-OHD, serum 1,25-(OH)2D, calcium intake and Ca:P ratio. The Ca:P ratio proved to be a significant independent predictor of BMC and BMD in all regions (P < 0.0005) ( Table 5). When the Ca:P ratio was eliminated in the model, calcium intake also had a positive association with all bone measurements, but of less significance (P < 0.01).
PTH, FSH, S-calcium, S-phosphate and bone markers
We found no relationship between PTH and 1,25-(OH)2D, nor could we demonstrate a relationship between PTH and serum calcium or serum phosphate. Serum 1,25-(OH)2D and levels of serum calcium and phosphate were not related. Moreover, there was no relation between serum 1,25-(OH)2D and FSH.
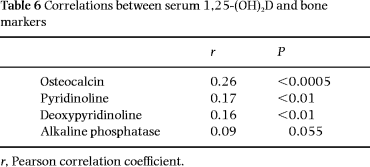
Positive but weak correlations between 1,25-(OH)2D and bone markers were found ( Table 6).
Discussion
This cross-sectional study deals with a homogenous group of women with respect to age and menopausal status, as they are included 3–24 months after their last menstrual bleed. Furthermore, they were screened for diseases known to influence bone metabolism. Such a group therefore seems suitable for studies into relationships between bone mass, dietary factors, and biochemical parameters that exist within the normal physiological range.
To our knowledge, we have, for the first time, demonstrated a significant, but weak, inverse relationship between endogenous 1,25-(OH)2D level and total bone mass, as well as bone mineral density of the lumbar spine and the femoral neck. Furthermore, we found a positive relationship between serum 25-OHD and total BMC and BMD of the spine.
A limited number of studies have addressed the relationship between endogenous vitamin D levels and bone mass, assessed as BMC or BMD. However, although some studies have failed to demonstrate a relationship, those who do find one are unanimous. A positive relationship between the circulating levels of 25-OHD and bone density in healthy individuals of both gender and with a broad age span has been demonstrated by some groups [18–27], whilst others were unable to find such a relationship [28–35]. The literature on the relation between bone mineral density and serum levels of 1,25-(OH)2D is much more sparse. A negative association between serum 1,25-(OH)2D and BMD of the forearm [22, 28] and the ankle [36] has been described in healthy women, as well as the forearm [29] and Ward’s triangle [34] in elderly men. Others were unable to demonstrate any relationship [27, 30].
The increased 1,25-(OH)2D levels in women with lower bone mass was accompanied by significantly higher levels of most of the bone markers, indicating an increased bone turnover.
Whether the negative relationship between serum 1,25-(OH)2D and bone density is causal, remains to be clarified. A direct effect of 1,25-(OH)2D on bone resorption has been shown in animals and in vitro studies [1, 2]. Intervention studies with calcitriol or alphacalcidol in normal postmenopausal women have not demonstrated a positive effect on bone density or even suggested a deleterious one, although the dose given might have been too low [37, 38]. A number of studies on 1,25-(OH)2D treatment in established postmenopausal osteoporosis [39–42], but not all [43, 44], show a beneficial effect on bone mass and/or fracture rate. It seems that the best results are obtained in women whose habitual diet is low in calcium, as in the Japanese population or in vitamin D-deficient subjects. However, it is likely that the increased level of 1,25-(OH)2D in women with reduced total BMC and regional BMD should be regarded as a compensatory mechanism for an underlying cause, rather than a direct effect of the vitamin D hormone on bone. One possible cause is low calcium intake. We found a trend towards a negative relation between calcium intake and serum 1,25-(OH)2D. Nordin and Morris [45] have pointed out that a reduced calcium absorption, whenever due to an insufficient calcium intake or impaired intestinal absorption, might play a preponderant role in the pathogenesis of osteoporosis. A recent meta-analysis of calcium intake and bone mass in normal women supports our finding that calcium had a modest positive impact on bone mass [10]. Interestingly, in our study the dietary calcium:phosphorus ratio was much more closely related to both bone density and serum 1,25-(OH)2D than the calcium intake per se (positively with the former and negatively with the latter). A low ratio of calcium:phosphorus intake has been reported to affect bone density in humans [11]. Test diets with low calcium and high phosphorus in young adults resulted in increased 1,25-(OH)2D, PTH and urinary hydroxyproline [46]. In contrast to others [11, 46], we did not find that PTH was related to those variables. A feedback loop between serum 1,25-(OH)2D and PTH exists and serves to diminish the secretion of PTH under circumstances where levels of 1,25-(OH)2D are elevated [47]. If our study population has followed the same dietary pattern for years, and this contributes to some of the variation in bone mass, the lack of a relationship with PTH might reflect that a different set point of PTH-vitamin D exists according to different dietary habits. It might also be due to minute changes and daily fluctuations, which would not be identified by the methods used. In the present study, we have used an assay measuring PTH 1–84, which has a lifetime of a few minutes. A lacking relationship between intact PTH and serum 1,25-(OH)2D has been described earlier [48, 49]. Quesada et al.[48] found a negative correlation between the C-terminal PTH and serum 1,25-(OH)2D, whereas there was no relationship between intact PTH and serum 1,25-(OH)2D [49].
We found no association between FSH and levels of vitamin D. Oestrogen levels were not examined, but although studies of treatment with oestrogen suggest a stimulatory effect of oestrogen on calcitriol level, there is general agreement that natural menopause does not cause any change in circulating levels of PTH or 1,25-(OH)2D [7–9]. The significant correlations between calcium and phosphorus intake, serum calcidiol and calcitriol on the one hand and bone mineral density on the other suggest that sex hormone levels are not completely dominating the scene during the perimenopausal period.
In conclusion, we have found bone mass to be inversely related to serum 1,25-(OH)2D in healthy perimenopausal women. We have also demonstrated a weak positive relation between bone mass and serum 25-OHD. The calcium intake, and especially the calcium:phosphorus ratio, was found to be associated positively with bone mass and negatively with serum 1,25-(OH)2D. Low intake of calcium and low dietary calcium:phosphorus ratio might result in loss of bone and in a compensatory increased level of 1,25-(OH)2D.
Acknowledgements
The authors thank Lene Theil Skovgaard, Associate Professor, Department of Biostatistics, University of Copenhagen, for statistical assistance. The study was supported by the Karen Elise Jensens Foundation.
References
Received 25 March 1998; accepted 2 October 1998.


