Plasma leptin levels are associated with abnormal fibrinolysis in men and postmenopausal women
Abstract
Abstract. Söderberg S, Olsson T, Eliasson M, Johnson O, Ahrén B (Umeå University Hospital, Luleå County Hospital and Lund University, Malmö, Sweden). Plasma leptin levels are associated with abnormal fibrinolysis in men and postmenopausal women. J Intern Med 1999; 245: 533–543.
Background. Leptin is a crucial mediator of satiety signals and energy balance, and its circulating levels are increased in obesity. It has recently been shown that plasma leptin levels in humans correlate with circulating insulin and to insulin secretion. This indicates that leptin may be an important link in metabolic consequences of the insulin resistance syndrome. Whether this includes abnormalities in fibrinolysis has not been studied.
Methods and results. Healthy subjects (n = 165; 85 men and 80 women) from the Northern Sweden MONICA population were investigated. Anthropometric measurements, oral glucose tolerance tests and sampling for plasma leptin, lipids, fibrinogen and fibrinolytic variables were made. Leptin levels were 342% higher in women than in men and were in both sexes strongly correlated to body mass index (BMI). After adjustments for age and BMI, leptin levels correlated significantly to pre/post glucoseload insulin levels in both sexes. After further adjustment for baseline insulin levels, leptin levels were in males significantly associated with increased waist circumference (P < 0.001), low HDL cholesterol (P < 0.05), low tPA activity (P < 0.01) and high PAI-1 activity (P < 0.001). In postmenopausal females, a significant association between leptin and low tPA activity/high PAI-1 activity was seen after adjustment for age and BMI (P < 0.05).
Conclusions. Circulating levels of leptin are associated with components of the insulin resistance syndrome, including defective fibrinolysis, in men and postmenopausal women. This suggests that leptin may be involved in the mediation of consequences of insulin resistance.
Introduction
The recently cloned ob gene is expressed exclusively in adipocytes [1], and it has been demonstrated that the protein product of the ob gene, leptin, reduces food intake and increases energy expenditure when administered to mice [2, 3]. In ob/ob mice, lacking production of normal leptin, insulin resistance and hyperinsulinaemia accompanied by noninsulin dependent diabetes mellitus (type 2) develops in conjunction with hyperphagia, infertility and cold intolerance [4]. After leptin supply these abnormalities are corrected [3].
In humans, the term insulin resistance syndrome [5] has been used to define a cluster of risk factors for cardiovascular diseases. A marker for this syndrome is hyperinsulinaemia; since increased circulating insulin levels evolves in response to insulin resistance [6, 7]. It has been shown that plasma leptin levels correlate significantly to circulating insulin levels and to insulin secretion [8, 9], a correlation which is persistent also after correction for body mass in females [10]. These findings, in conjunction with studies suggesting expression of leptin receptors in insulin producing cells [11], indicate that leptin may be a mediator not only of satiety signals but also of other metabolic consequences in the insulin resistance syndrome profile.
In the present study we explored this possibility by examining the relation between leptin and fibrinolysis. The role of impaired fibrinolysis in the development of atherothrombotic disease has recently been reviewed [12, 13] and it has been shown that impaired fibrinolysis increases the risk of myocardial infarction [14]. The main regulator of fibrinolytic activity is plasminogen activator inhibitor-1 (PAI-1). High plasma PAI-1 activity has been shown to predict reinfarction and death in patients with myocardial infarction at an early age [15], whilst high mass concentrations of tissue plasminogen activator (tPA ‘antigen’) predicted mortality in patients with coronary artery disease in a study from our catchment area [16]. Furthermore, a relationship between PAI-1 antigen concentrations, obesity and hepatic insulin resistance has been reported [17].
Whether leptin is associated also with these components of the insulin resistance syndrome is not known. We therefore studied possible associations between leptin and specific features of this syndrome, with special emphasis on fibrinolytic abnormalities, in a population-based sample of healthy individuals. We studied both males and pre/postmenopausal females, since there may be profound age- and gender-related differences in these associations. Leptin levels have thus been reported to be substantially higher in females than in males, and this difference persists into the postmenopausal stage [18, 19].
Methods
Subjects
The study was performed within the framework of the Northern Sweden MONICA Project which, in turn, is a part of the WHO MONICA (Monitoring of Trends and Determinants in Cardiovascular Disease) Project [20]. In 1994, a population was screened for cardiovascular risk factors. A total of 2500 individuals in the 25–74 years range were invited by mail (from a total population of 367 000 in this age range). Within each age group (25–34, 35–44, 45–54, 55–64, 65–74 years) 250 men and 250 women were randomly selected from continuously updated population registers in Norbotten and Västerbotten, the two northernmost provinces of Sweden. In total 1921 subjects participated in the study (76.8%). In this paper, subjects were included who were sampled between 07.00 and 09.00 h in order to minimize the influence of diurnal rhythm of fibrinolysis and leptin [21, 22]. Subjects who were pregnant, using oestrogen replacement therapy, oral contraceptives, and antihypertensive agents, or had a history of diabetes, prior myocardial infarction or stroke were excluded. This group was approximately one year younger and had a BMI that was 0.5 kg m–2 lower than the whole population sample. After an overnight fast, a 75 g oral glucose tolerance test was performed. Three subjects were found to have previously unknown diabetes and were excluded from further analysis. Six subjects with impaired glucose tolerance were included. After these exclusions, 85 men and 80 women remained and thus form the basis of this study. Five female subjects with irregular menstruations were, however, excluded in the analysis of pre- and postmenopausal women. The study was approved by the Research Ethics Committee of Umeå University.
Sampling
Participants were instructed not to use tobacco and to avoid strenuous physical activity during the hour preceding the examination which took place between 07.00 and 09.00 h. Immediately before the glucose tolerance test, venous samples for determination of blood lipids, plasma glucose, insulin, leptin, plasma fibrinogen and fibrinolytic variables were obtained. A second sample for glucose and insulin was taken after 2 h. Sampling was performed in the sitting position with no special rest and with minimal occlusion. Samples for the determination of glucose, insulin, leptin, fibrinogen and fibrinolytic variables were stored at – 70 C. For fibrinogen and fibrinolysis, blood was drawn into Stabilyte vacuum tubes (Biopool AB, Umeå, Sweden). Tubes were centrifuged at 2000 × g for 20 min and frozen within an hour.
Anthropometric and biochemical analyses
Body mass index (BMI) was calculated as total bodyweight (kg)/height (m2) and waist hip ratio (WHR) as the ratio of the circumference of the narrowest part of the waist divided by the broadest part of the hip. Upper arm circumference was measured on the right arm midway between the tip of acromion and the olecranon process. Triceps and suprailiac skinfold measurements were performed with a Harpenden calliper and the results were based on the median of three measurements at each position. For triceps, a double fold of skin plus subcutaneous tissue was measured midway between the tip of acromion and the olecranon process in the midline of the posterior surface of the right upper arm with the arm extended alongside the trunk. Suprailiac skinfold was measured just above the right anterior superior iliac spine with the fold parallel to the natural cleavage line of the skin. All measurements were taken with the subject standing upright and breathing lightly.
Blood pressure was measured with the subjects in the sitting position after 5 min of rest using the random zero method.
Plasma glucose was analysed by the hexokinase method (Boehringer Mannheim, Germany) on a Hitachi 717 analyser (Tokyo, Japan). Insulin was measured by microparticle enzyme immunoassay (MEIA) (Abbott Laboratories, IL, USA). The detection limit was 1.0 mU L–1, and the interassay coefficient of variation (CV) was 6.7% at the level of 7.9 mU L–1. Cross reactivity with C-peptide/glucagon was nondetectable and 0.005% with proinsulin according to the manufacturer.
The analysis of leptin was performed with a double-antibody radioimmunoassay using rabbit antihuman leptin antibodies, 125I-labelled human leptin as tracer and human leptin as standard (Linco Res., St Louis, Mo, USA).
Plasma fibrinogen determinations were performed by a functional kinetic method (Fibrinogen Kinetic, Boehringer Mannheim, Mannheim, Germany) using a Hitachi 717 analyser. Between assay CV was 3.7%. A freeze-dried Fibrinogen Standard from the National Institute for Biological Standards and Control with an assigned value of 2.4 g L–1 was analysed eight times with a mean value of 2.36 g L–1.
The tPA and PAI-1 activity were determined by chromogenic assays, Spectrolyse/fibrin and Spectrolyse/pl kit, respectively (Biopool AB, Umeå, Sweden). A freeze-dried control, Fibrinolysis Reference Plasma (Biopool AB, Umeå, Sweden) was analysed in duplicate. The interassay CV for tPA activity was 16% and for PAI-1 activity 11%. Details regarding assay imprecision and analytical sensitivity have been published earlier [21]. Serum triglyceride, cholesterol and HDL cholesterol were determined by enzymatic methods (Boehringer Mannheim GmbH, Mannheim, Germany).
Statistical analysis
Means and 95% confidence intervals (95% CI) are presented. All the main study variables were positively skewed. After logarithmic transformation, normal plots of insulin, leptin, fibrinogen, tPA activity and PAI-1 activity showed an approximate normal distribution and improved skewness and kurtosis. Therefore (ln) transformed values were used to calculate geometric means, 95% confidence intervals (CI), Pearson and partial correlation coefficients and regression equations. Multiple linear regression analysis was performed with a stepwise method. Residual plots were used to check for violations against the assumptions. Two-tailed tests were used and a P-value < 0.05 was considered as significant. All calculations were made with the statistical program SPSS (Chicago, IL, USA) version 6.1 on a Macintosh computer.
Results
Baseline characteristics of the population
Baseline characteristics and main study variables of the study population are shown in Table 1. Men had higher WHR, diastolic blood pressure, triglycerides and (fasting) blood glucose, in combination with lower HDL cholesterol and leptin than women. The difference between sexes in WHR was explained by a higher waist circumference amongst males. Furthermore, triceps skinfold was increased in men. Plasma levels of fibrinogen, t-PA and PAI-1 activity did not differ between genders. Postmenopausal women had higher BMI, diastolic and systolic blood pressure, cholesterol, triglycerides and fibrinogen levels than premenopausal women.
Correlations between leptin and anthropometric measures
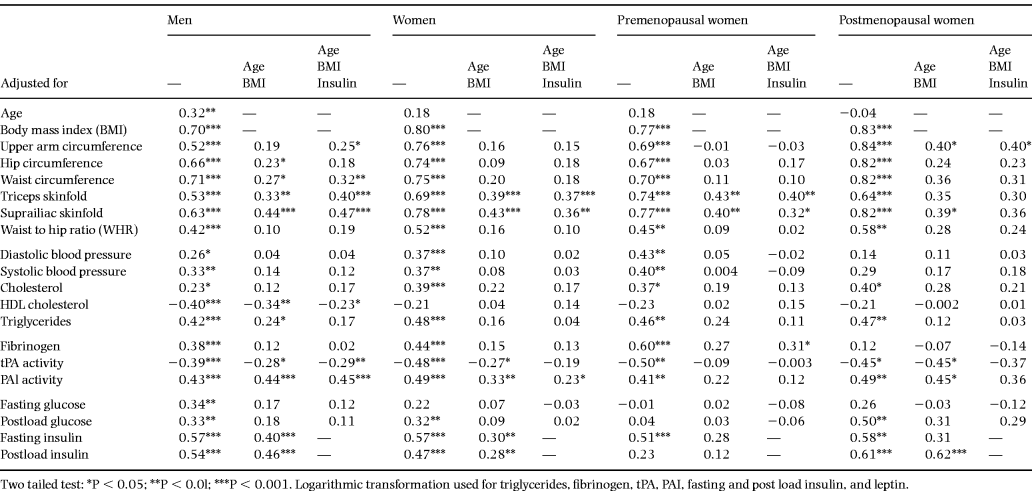
Table 2 shows the bivariate and partial correlations between leptin levels and specific variables. In these analyses, successive adjustments were made for age, BMI and (fasting) insulin levels in separate analyses, after stratification for gender and menstrual status. (Data after adjustment for age not shown as the results did not differ significantly from the results in the bivariate analysis.)
Overall, leptin levels correlated significantly with BMI with a stronger correlation amongst females. Furthermore, triceps/suprailiac skinfolds and waist/upper arm circumference (the latter only amongst males) remained significantly associated with leptin after adjustments for age, BMI and insulin levels. Leptin correlated strongly with BMI in both pre- and postmenopausal women. Furthermore, leptin levels correlated significantly (after adjustment for age and BMI) with triceps and suprailiac skinfolds in premenopausal women and with upper arm circumference and suprailiac skinfolds in postmenopausal women. A nonsignificant correlation between leptin and waist circumference was seen amongst postmenopausal women (P = 0.06 after adjustment for age and BMI), a tendency not seen amongst premenopausal women.
Levels of leptin were 342% (95% CI: 282–417%) higher in women than in men after adjustment for age and effects of adiposity and body composition (as determined by BMI; waist, hips and arm circumference; and triceps/suprailiac skinfolds).
Leptin; lipids, insulin and fibrinolytic variables
A significantly negative correlation remained between HDL cholesterol and leptin levels amongst males after adjustment for possible confounding factors; other significant associations between leptin and blood pressure levels/serum lipids disappeared after these adjustments. Leptin correlated strongly with both pre- and post load levels of insulin, adjusted for age and BMI in the male group. These correlations were also significant amongst females, although weaker. Plasma glucose levels pre- and post load did not correlate with leptin levels once adjusted for BMI.
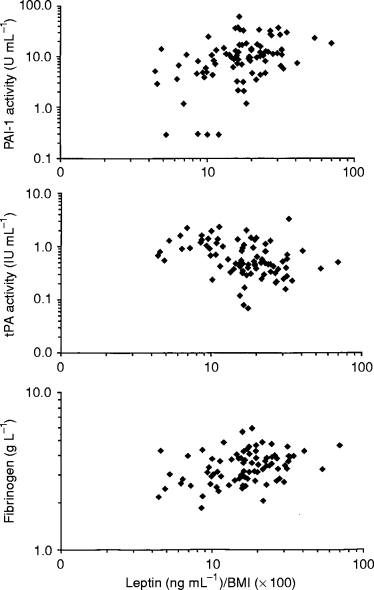
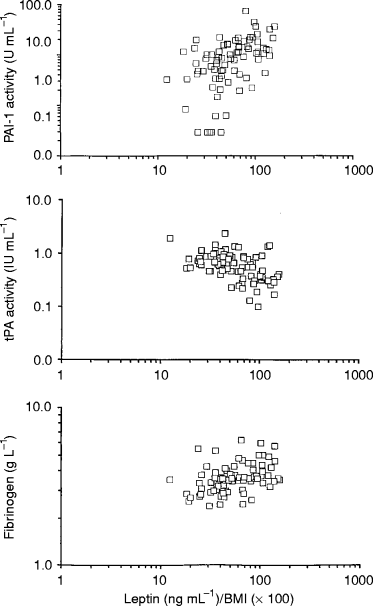
Plasma levels of fibrinogen, t-PA activity and PAI-1 activity correlated significantly with leptin in both sexes ( 1, 2). After adjustments ( Table 2), strong associations between high leptin levels on one hand and high PAI-1 activity and low t-PA activity on the other remained amongst males, whilst only a weak association between leptin and PAI-1 activity levels remained amongst women.

The relation between serum leptin (adjusted for BMI) and fibrinolytic variables in males (u). Scatterplots showing leptin/BMI ratio versus PAI activity (upper), tPA activity (middle) and fibrinogen (lower). Note the logarithmic scales.

The relation between serum leptin (adjusted for BMI) and fibrinolytic variables in females (□). Scatterplots showing leptin/BMI ratio versus PAI activity (upper), tPA activity (middle) and fibrinogen (lower). Note the logarithmic scales.
However, a major effect of the transition of a pre- to a postmenopausal stage was seen on these associations. Thus, the association between leptin levels on one hand and t-PA activity and PAI-1 activity on the other remained significant in postmenopausal women after adjustments for age and BMI, and a similar association between leptin and postload levels of insulin was seen in postmenopausal women after adjustments. In contrast, tPA, PAI-1 and postload insulin levels did not correlate to leptin levels amongst premenopausal women after adjustments. Furthermore, adjustment for waist circumference in addition to age and BMI did not change the results significantly (data not shown).
Stepwise multiple regression
Table 3 shows the results of a stepwise multiple linear regression analysis with leptin concentration as the dependent variable. In summary, factors which have been shown to correlate with leptin in this and other studies were introduced in the model. The following factors remained significant predictors after stratification for sex: In males, waist circumference; suprailiac skinfold; age and (fasting) insulin. In females, skinfolds (both triceps and suprailiac), together with waist circumference. These models explained 68 and 74% of the variation in leptin levels for males and females, respectively. Suprailiac skinfold and BMI were significant predictors for leptin levels in premenopausal women, explaining 64% of the variation in leptin levels; and skinfolds (both triceps and suprailiac) together with waist circumference explaining 81% in postmenopausal women.
Discussion
The data reported in this study are derived from a population-based study in which the studied individuals are representative of the entire healthy population [23]. Our results confirm earlier data on the strong association between BMI and circulating leptin levels, as well as the higher leptin levels in women [9, 18, 19]. Furthermore, we find that high circulating levels of leptin are closely related to abnormal fibrinolytic activity, i.e. high PAI-1 and low tPA activity amongst males and postmenopausal women, and that this association is independent of BMI. Since high PAI-1 and low tPA activity in combination with intra-abdominal obesity (to which leptin is associated in males) is associated with cardiovascular diseases afflicting the insulin resistance syndrome [12, 13], we suggest that circulating leptin may be an important link between the components of this syndrome, possibly by modulating the activity in the sympathetic nervous system.
Leptin emanates predominantly from fat cells in humans [1]. This fits with our data on a close relationship between leptin levels and various anthropometric measures.
PAI-1 mRNA expression increases in visceral fat tissues when obesity develops in rats with ventromedial hypothalamic lesions, and PAI-1 levels are closely correlated with visceral fat area in humans [24]. In males, high PAI-1 activity is specifically related to increased amounts of intra-abdominal fat mass [25] and in women, omental adipocytes produce more PAI-1 antigen than adipocytes from subcutaneous territories [26]. Upper distribution of body fat/major visceral depots are associated with an increased risk of cardiovascular diseases [27, 28]. Furthermore, prospective studies (mainly confined to males) have documented an increased risk of cardiovascular disease as well as risk of recurrence of disease related to abnormal fibrinolytic activity [12, 13, 16, 29]. Whether leptin (in conjunction with insulin) has any direct effects on PAI-1 secretion from the adipocyte remains to be studied in vitro.
Another possibility is that both leptin and PAI-1 expression in the adipocyte are regulated by cytokines in an autocrine fashion. A close correlation between expression of leptin and TNF-α in fat cells amongst rodents [30] and humans [31] is thus established. Furthermore, adipocytes from obese women have higher TNF-α gene expression than controls [32], and administration of TNF-α induces PAI-1 mRNA in adipocytes [33].
Finally, leptin effects on the fibrinolytic system may be mediated through increased sympathetic activity. Chronic stimulation of the sympathetic nervous system is seen in relation to the insulin resistance syndrome [34]. Recent data suggest that elevated levels of leptin modulate the sympathetic activity. In experimental studies, leptin increases renal sympathetic nerve activity and also sympathetic nerve activity to brown adipose tissue in the hindlimb and adrenal gland, which may stimulate sodium reabsorption and vascular smooth muscle growth [35]. Furthermore, both intravenous and intracerebroventricular administration of leptin causes sustained increase of arterial blood pressure and heart rate in normal rats [36, 37]. Consequently, leptin may be an important mediator in the development of hypertension and thus contribute to impaired fibrinolysis due to vascular damage.
High leptin levels correlate to low HDL cholesterol levels in men even after adjustments for age, BMI and insulin, which is in accordance with the findings of others [38]. Low levels of HDL cholesterol and high levels of triglycerides are characteristic features of the dyslipidaemia associated with insulin resistance [39]. If this relates to leptin-induced stimulation of the sympathetic system as earlier postulated for insulin [34] remains to be investigated.
In two earlier published population-based studies (in subjects from Western Samoa and in Mexican Americans), strong positive associations between leptin and BMI/waist circumference have been reported [40, 41]. We confirm this association also in male and postmenopausal Caucasians. We show, however, that this association is not seen in premenopausal women. Thus, a gender difference exists not only with regard to absolute levels of circulating leptin, but also with respect to associations between leptin and risk factors in the insulin resistance syndrome. The cause for this gender difference is not clear, but the persistent higher levels amongst women after adjustment for various measures of adiposity and body composition suggests that other factors than overall fat mass are regulating leptin levels in females [10, 18, 19].
Accumulating evidence suggests that this difference is due to gonadal hormone influence, mainly androgens, as testosterone replacement reduces leptin levels in hypogonadal men [42], and that leptin correlates inversely to testosterone levels in healthy nonobese men and women [43].
Furthermore, in males the localization rather than the size of fat depots seems to be a major determinant for circulating leptin. This is supported by a recent study showing an association between visceral fat area and leptin levels amongst males, but not females [44]. Furthermore, it may be a difference in leptin mRNA expression between males and females; females having higher subcutaneous-to-omental ratios [45]. In line with this, leptin levels in our study correlated to waist circumference in men; waist circumference is considered to be the best anthropometric index of abdominal fat accumulation [46]. In fact, in our linear regression model waist circumference was the strongest predictor for leptin levels in the male group and waist circumference was also a significant predictor for leptin levels amongst postmenopausal women. However, this was not the case in premenopausal women. Thus, a significant association was seen between leptin and indices of general adiposity in premenopausal women, whereas in addition, a significant association was seen between leptin and measures of adiposity distribution in postmenopausal women.
These data are of interest mainly in relation to the association between visceral fat accumulation and insulin resistance [27, 28, 47], and to the fact that visceral rather than peripheral fat is the main tissue for short-term storage of energy [28]. A correlation exists between circulating leptin and insulin levels, and this is independent of BMI [48]. Since we have previously shown that plasma leptin correlates significantly also with insulin secretion (studied by the glucose-dependent arginine stimulation test) independently of percentage body fat [10], and since leptin receptors are present in pancreatic islets cells [11], it is possible that leptin may influence insulin levels by a direct action on the islet β cells. This is at present unclear, however, since both inhibition [11, 49], stimulation [50] and no effect [51] on insulin secretion has been reported from leptin administration. On the other hand, it is also possible that the association is due to a stimulating effect of insulin on leptin production and secretion, since insulin administration induces expression of leptin mRNA in adipocytes [52, 53], although supraphysiological infusions of insulin for at least 4 h are required to increase circulating leptin levels in humans [54].
The increased sympathetic activity seen in relation to the insulin resistance syndrome is due to effects of insulin in the ventromedial hypothalamus, according to Reaven et al.[34]. Recent data suggest, however, that leptin modulates the sympathetic activity. Thus, insulin and leptin are probably both important mediators in the insulin resistance syndrome, and possible sites for joint action are the hypothalamus, pancreas and the adipocyte.
In conclusion, we describe an association between leptin and the components of the insulin resistance syndrome, including defective fibrinolysis, amongst males and postmenopausal females in a population-based study from Northern Sweden. This suggests that leptin may be involved in the mediation of consequences of insulin resistance.
Acknowledgements
We are indebted to the Northern Swedish MONICA Project and the grants supporting it. Furthermore to Dr Per-Eric Evrin, Dept of Clinical Chemistry, Boden Hospital for analysis of fibrinogen and fibrinolytic variables.
This study was partly supported by grants from the Swedish Medical Research Council (grants no. 19X-12237 to TO and No14X-6834 to BA), the Swedish Public Institute of Health, Ernhold Lundström, Albert Påhlsson, Crafoord and Novo Nordic Foundations, Swedish Diabetes Association, and the Faculties of Medicine, Umeå and Lund Universities.
References
Received 18 May 1998; accepted 5 October 1998.


