Temperature and salinity tolerances of yellowfin sea bream, Acanthopagrus latus, at different salinity and temperature levels
Abstract
Abstract Yellowfin sea bream Acanthopagrus latus (Houttuyn) (0.98 ± 0.27 g) were examined for temperature and salinity tolerances at nine different environmental regimes (0.3, 15 and 33 ppt combined with 10, 25 and 32 °C), in which the fish were subjected to gradual and sudden changes in temperature and salinity respectively. The 50% CTMax (critical thermal maximum) and the UILT (upper incipient lethal temperature) were in the range of 34.8–38.2 °C and 32.8–36.4 °C respectively. The 50% CTMin (critical thermal minimum) and the LILT (lower incipient lethal temperature) were in the ranges of 4.9–9.4 °C and 7.1–17.6 °C respectively. The 50% CSMax (critical salinity maximum) and the UILS (upper incipient lethal salinity) were in the ranges of 54–69‰ and 9–44‰, respectively. The fish at lower temperature (10 °C) and salinity of 33‰ tolerated temperature as low as 6 °C when the temperature was decreased gradually. The fish at 33 and 15‰ and lower temperature (10 °C) tolerated salinity as high as 66–67‰, whereas those at freshwater salinity level (0.3‰) and 32 °C tolerated salinity to 50‰ when salinity was increased gradually. The relationships among UILT, LILT, 50% CTMax, 50% CTMin, UILS, 50% CSMax, salinity and temperature are given.
Introduction
Twelve species of porgies, a member of the family Sparidae, inhabit waters around the Pacific east coast. Black porgy Acanthopagrus schlegeli (Bleeker), red sea bream Pagrus major (Temminck and Schlegel), gold lined sea bream Sparus sarba (Forsskål), and yellowfin sea bream Acanthopagrus latus (Houttuyn) are the most popular sparids currently being cultured in Taiwan (Chen 1990).
Lethal temperature and temperature tolerance of marine fish have been studied by several scientists (Menasveta 1981; Elliott 1991; Procarione & King 1993; Heath 1996; Kita, Tsuchida & Setoguma 1996). Salinity tolerance of marine fish has also been reported by several scientists (Pfeiler 1981; Nordlie 1987; Nelson & Flickinger 1992). Sparids like sea bream, Chrysophrys major (Temminck and Schlegel), and gold-lined sea bream (Forsskål), Rhabdosarga sarba, that inhabit waters of south-east China Sea have survived without showing abnormal behavior at salinity levels of 10–35‰ (Wu & Woo 1983). However, little is known on the temperature and salinity tolerances of marine fish maintained at different salinity and temperature levels (Hodson, Fechhelm & Monroe 1981).
Temperature and salinity are the most important environmental variables because they directly affect metabolisms, oxygen consumption, growth and survival of marine organisms. The natural range of A. latus extends into marine water and brackish water where rainfall and evaporation can expose this species to wide variations in salinity and temperature. Therefore, it is necessary to investigate the interaction between the effects of temperature and salinity on survival and growth of fish when they are subjected to change in salinity and temperature. The aim of the present study was to investigate the 50% CTMax (critical thermal maximum), 50% CTMin (critical thermal minimum), 50% CSMax (critical salinity maximum), and their 95% confidence limits for A. latus, when temperature was increased or decreased gradually, and when salinity was increased or decreased gradually (Cowles & Bogert 1944; Lowe & Vance 1955; Lutterschmidt & Hutchison 1997a). The present study was also to investigate the median lethal temperature and median lethal salinity when the fish maintained at nine environmental regimes were transferred suddenly to a series of higher temperature levels, a series of lower temperature levels, a series of higher salinity levels and a series of lower salinity levels (Fry 1967; Pfeiler 1981; Lutterschmidt & Hutchison 1997b).
Materials and methods
Test animals
About eight thousand A. latus juveniles from a farm in Tainan, Taiwan were shipped to our university, and kept in two tanks (5.3 m3) with running seawater of 33‰ at room temperature (25 °C) for two weeks. They were then divided into nine groups, and released in nine tanks, installed with gravel and sand on the bottom and aerated with an air-lift. Fish which had been acclimated to nine environmental regimes (salinity at 0.3, 15 and 33‰ combined temperature at 10, 25 and 32 °C) were used for the studied. The average wet weight of fish used was 0.98 ± 0.27 g. Four studies were conducted. They were gradual change in temperature, sudden change in temperature, gradual change in salinity and sudden change in salinity.
Gradual change in temperature
The temperature of water in which A. latus juveniles had been maintained in each of nine environmental regimes was increased or decreased at a rate of 1 °C h−1 (Becker & Genowa 1979; Wedemeyer & McLeay 1981; Trevors & Lusty 1985). The fish was considered to have reached the end point after the operculum stopped beating for 2 min. The temperature at which half the population reached the end point was reported as the 50% CTMax (critical thermal maximum) or 50% CTMin (critical thermal minimum) when water temperature was increased or decreased respectively. The highest or lowest temperature at which all fish survived was recorded as STMax (survival thermal maximum) or STMin (survival thermal minimum), respectively, when temperature was increased or decreased.
Sudden change in temperature
The fish maintained in nine environmental regimes were transferred suddenly to a series of higher temperature or lower temperature levels, and the number of fish killed was measured 24 h after transfer (Elliott 1981). The UILT (upper incipient lethal temperature) and LILT (lower incipient lethal temperature) were taken as the temperature (upper or lower) at which 50% of the test fish survived for 24 h. The UILT and LILT and their 95% confidence limits were determined using a computer program (Trevors & Lusty 1985).
Gradual change in salinity
The salinity of water in which A. latus juveniles had been maintained in each of nine environmental regimes was increased or decreased at a rate of 2 ‰ h−1 (Wedemeyer, Barton & McLeay 1990). The fish was considered to have reached the end point after the operculum stopped beating for 2 min. The salinity at which half the population reached the end point was recorded as the 50% CSMax (critical salinity maximum) or 50% CSMin (critical salinity minimum) when salinity was increased or decreased respectively. The highest or lowest salinity at which all fish survived was recorded as the SSMax (survival salinity maximum) or SSMin (survival salinity minimum) respectively, when salinity was increased or decreased.
Sudden change in salinity
The fish maintained in nine environmental regimes were transferred suddenly to a series of higher salinity or lower salinity levels, and the number of fish killed was measured 96-h after transfer (Nelson & Flickinger 1992; Pfeiler 1981). The UILS (upper incipient lethal salinity) and LILS (lower incipient lethal salinity) were taken as the salinity (upper or lower) at which 50% of the test fish survived for 96 h (Pfeiler 1981). The UILS and LILS and their 95% confidence limits were determined using a computer program (Trevors & Lusty 1985).
Statistical analysis
All data were subjected to one-way and two-way analyses of variance (Steel & Torrie 1980). If significant differences were indicated at the 0.05 level, then Duncan's Multiple Range test was used to identify significant difference between treatments (Duncan 1955). The linear relationships among 50% CTMax, 50% CTMin, UILT, LILT, 50% CSMax, UILS, LILS, salinity and temperature were tested using the General Linear Model Procedure and Regression Procedure, version 6.03 SAS (Statistical Analysis System) computer software. All statistical significant tests were at the P < 0.05 level.
Results
Gradual change in temperature
In 32 °C, all fish maintained at 33, 15 and 0.3‰ survived at 34, 37 and 37 °C respectively when the temperature was raised, and survived at 9, 10 and 10 °C respectively when the temperature was decreased. At 25 °C, all fish maintained at 33, 15 and 0.3‰ survived at 36, 37 and 37 °C respectively when the temperature was raised, and survived at 7, 8 and 8 °C respectively when the temperature was decreased. In 10 °C, all fish maintained at 33, 15 and 0.3‰ survived at 34, 36 and 36 °C respectively when the temperature was raised, and survived at 6, 7 and 7 °C respectively when the temperature was decreased. At 25 and 32 °C, the 50% CTMax of juveniles maintained at 15‰ was significantly higher (P < 0.05) than that at 33‰. In 10, 25 and 32 °C, the 50% CTMin of juveniles at 0.3‰ was significantly higher (P < 0.05) than that at 33‰(Fig. 1).
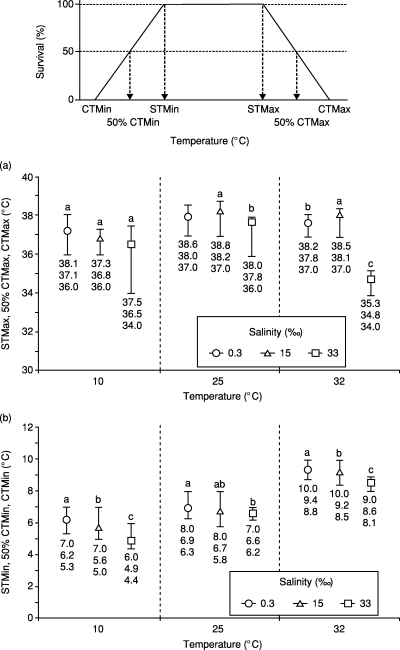
The CTMax, 50% CTMax and STMax (a), and the CTMin, 50% CTMin and STMin (b) of Acanthopagrus latus juveniles maintained at different salinity and temperature levels. Data in the same temperature levels having different letters are significantly different (P < 0.05) among different salinity levels. In (a), the symbols represent 50% CTMax, and the upper and lower bars represent CTMax and STMax at each of the salinities. In (b), the symbols represent 50% CTMin, and the upper and lower bars represent STMin and CTMin at each of the salinities.
Statistical analysis indicated that there was a significant effect of salinity and temperature on 50% CTMax and 50% CTMin (P < 0.05). There was also a significant interaction between the effects of salinity and temperature on 50% CTMax and 50% CTMin (P < 0.05). The relationships among 50% CTMax, 50% CTMin, salinity (S), temperature (T) and the interaction between salinity and temperature (ST) are given as follows:


Sudden change in temperature
The number of A. latus that had been maintained in nine environmental regimes and survived when transferred suddenly to a series of higher temperature levels and a series of lower temperature is given in Fig. 2. The UILT and its 95% confidence limit for juveniles maintained at different environmental regimes, and then transferred to a series of higher temperature after 24 h, are given in Fig. 3a. At 10 °C and 25 °C, the UILT of juveniles maintained at 0.3‰ was significantly higher (P < 0.05) than that at 33‰.
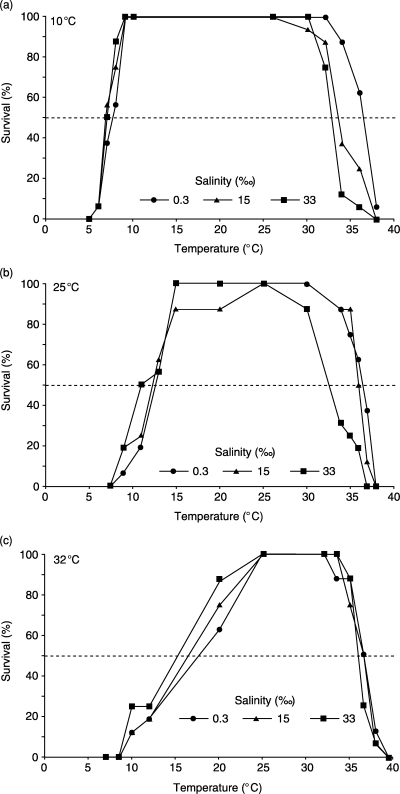
Percentage survival of Acanthopagrus latus juveniles when the animals were transferred suddenly into a series of higher temperature, and a series of lower temperature levels from different salinity levels (33, 15 and 0.3‰) and at 10 °C (a), 25 °C (b) and 32 °C (c).
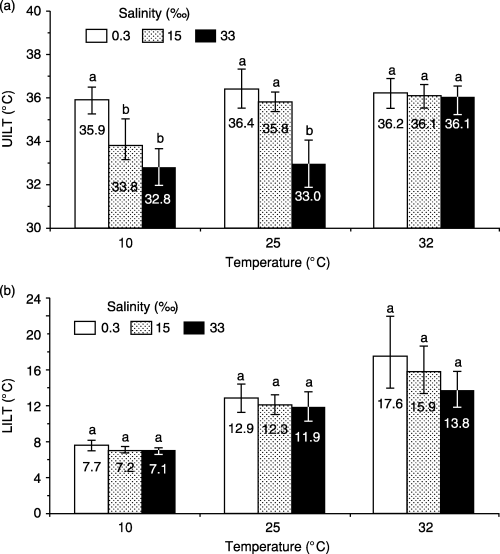
The UILT (a) and LILT (b) and their 95% confidence limits of Acanthopagrus latus juveniles maintained at nine salinity and temperature levels. See Figure 1 for statistical information.
The LILT and its 95% confidence limit for juveniles maintained at nine environmental regimes, and then transferred to a series of lower temperature after 24 h, are given in Fig. 3b. At 32 °C, the LILT was 13.8, 15.9 and 17.6 °C, for the fish maintained at 33, 15 and 0.3‰ respectively, whereas in 10 °C, the LILT was 7.1, 7.2 and 7.7 °C respectively.
Statistical analysis indicated that there was a significant effect of salinity and temperature on UILT (P < 0.05), and a significant interaction between the effects of salinity and temperature on UILT (P < 0.05). There was a significant effect of temperature on LILT (P < 0.05). The relationships among UILT, LILT, S, T and ST are given as follows:


Gradual change in salinity
In 33‰, all fish maintained at 32, 25 and 10 °C survived at 61, 64 and 66‰ respectively when the salinity was raised. In fresh water (0.3‰), all fish maintained at 32, 25 and 10 °C survived at 50, 63 and 65‰ respectively when salinity was raised (Fig. 4). All fish maintained at every environment regimes survived when salinity was decreased. Therefore, there was no CSMin and 50% CSMin.
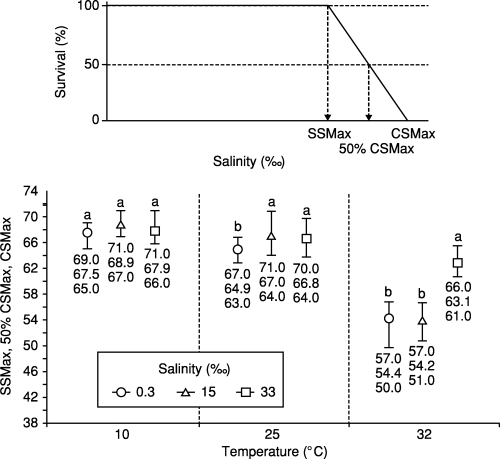
The CSMax, 50% CSMax and SSMax of Acanthopagrus latus juveniles maintained at different salinity and temperature levels. The symbols represent 50% CSMax, and the upper and lower bars represent CSMax and SSMax at each of the salinities. See Figure 1 for statistical information.
In fresh water (0.3‰), the 50% CSMax was 54.4, 64.9 and 67.5‰ for the fish maintained at 32, 25 and 10 °C respectively, whereas in 33‰ the 50% CSMax was 63.1, 66.8 and 67.9‰ for the fish maintained in 32, 25 and 10 °C respectively. In 32 °C, the 50% CSMax of fish maintained at 33‰ was significantly higher (P < 0.05) than that at 15‰ and 0.3‰. At 25 °C, the 50% CSMax of juvenile maintained at 33‰ and 15‰ was significantly higher (P < 0.05) than that at 0.3‰ (Fig. 4).
Statistical analysis indicated that there was a significant effect of salinity and temperature on 50% CSMax (P < 0.05), and there was a significant interaction between the effects of salinity and temperature on 50% CSMax (P < 0.05). The relationship among 50% CSMax, S, T and ST is as follows:

Sudden change in salinity
The number of fish maintained in nine environmental regimes which had survived when transferred suddenly to a series of higher salinity levels and a series of lower salinity levels after 96 h is given in Fig. 5. The UILS and its 95% confidence limit of juveniles maintained at nine environmental regimes and then transferred to a series of higher salinity after 96 h are given in Fig. 6a. At 10, 25 and 32 °C, the UILS of juveniles maintained at 33‰ was significantly higher (P < 0.05) than that at 0.3‰.
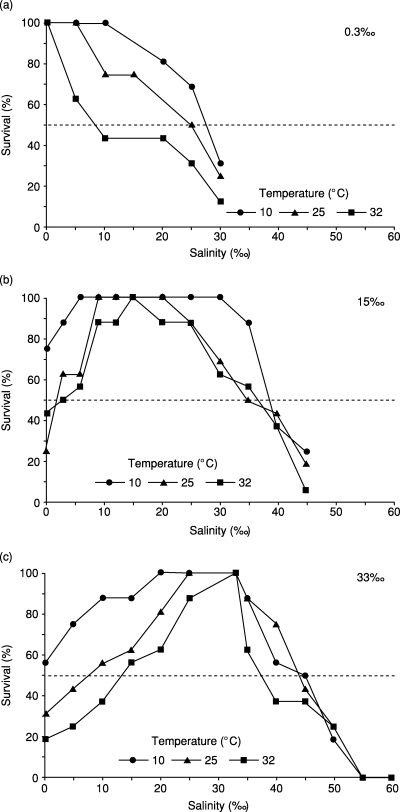
Percentage survival of Acanthopagrus latus juveniles when the animals were transferred suddenly into a series of higher salinity, and a series of lower salinity levels from different temperature levels (32, 15 and 10 °C) and at 0.3‰ (a), 15‰ (b) and 33‰ (c).
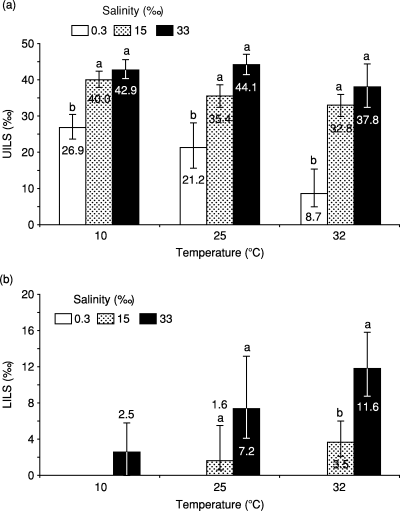
The UILS (a) and LILS (b) and their 95% confidence limits of Acanthopagrus latus juveniles maintained at nine salinity and temperature levels. See Figure 1 for statistical information.
All fish maintained in 33‰ and 10 °C survived when transferred suddenly to 20‰ after 96 h. All fish maintained in 15‰ and 10 °C survived a sudden transfer to 6‰ salinity after 96 h (Fig. 5). The LILS and its 95% confidence limit of juveniles maintained at nine environmental regimes and then transferred to a series of lower salinity after 96 h are given in Fig. 6b. At 32 °C, the LILS of fish maintained in 33‰ and 15‰ was 11.6‰ and 3.5‰ respectively. However, at 25 °C, the LILS of fish maintained in 33‰ and 15‰ was 7.2‰ and 1.6‰, respectively.
Statistical analysis indicated a significant effect of salinity and temperature on UILS, and a significant effect of salinity on LILS (P < 0.05). The relationships among UILS, LILS, S and T are as follows:


Discussion
Increased acclimation temperature resulted in increases of CTMax and UILT of several marine species of the Gulf of Thailand (Menasveta 1981), and resulted in an increase in CTMax of sheepshead minnow, Cyprinodon variegates (Bennett & Bettinger 1997). In marbled rockfish, Sebastiscus marmoratus (Cuvier in Cuvier and Valenciennes), Kita et al. (1996) reported that CTMax and CTMin increased directly with acclimation temperature. Reported levels of CTMax, UILTm, CTMin and LILT are summarized in Table 1.
| Species | Reported levels | Acclimation condition | Reference |
|---|---|---|---|
| Sheepshead minnow | |||
| Cyprinodon variegatus | CTMax 34.6 °C | 5 °C freshwater | Bennett & Bettinger (1997) |
| CTMax 44.2 °C | 30 °C freshwater | ||
| CTMin 0.6 °C | 5 °C freshwater | ||
| CTMin 11.3 °C | 30 °C freshwater | ||
| Thymallus arcticus | CTMax 26.4 °C | 8.4 °C freshwater | Lohr et al. (1996) |
| CTMax 28.5 °C | 16 °C freshwater | ||
| CTMax 29.3 °C | 20 °C freshwater | ||
| Mulet Mugil dussumieri | UILT 37.5 °C | 29.5 °C seawater | Menasveta (1981) |
| Cardinal fish | |||
| Apogon aureus | UILT 32 °C | 23 °C seawater | Menasveta (1981) |
| Texas pinfish | |||
| Logodon rhomboides | CTMin 3.4 °C | 24 °C seawater | Bennett & Judd (1992) |
| LILT 7.9 °C | 24 °C seawater | ||
| Yellowfin sea bream | |||
| Acanthopagrus latus | UILT 36.1 °C | 32 °C and 330 ‰ | Present study |
| CTMax 35.3 °C | 32 °C and 330 ‰ | ||
| UILT 33.0 °C | 25 °C and 330 ‰ | ||
| CTMax 38.0 °C | 25 °C and 330 ‰ | ||
| UILT 32.8 °C | 10 °C and 330 ‰ | ||
| CTMax 37.5 °C | 10 °C and 330 ‰ | ||
| LILT 13.8 °C | 32 °C and 330 ‰ | ||
| CTMin 8.1 °C | 32 °C and 330 ‰ | ||
| LILT 11.9 °C | 25 °C and 330 ‰ | ||
| CTMin 6.2 °C | 25 °C and 330 ‰ | ||
| LILT 7.1 °C | 10 °C and 330 ‰ | ||
| CTMin 4.4 °C | 10 °C and 330 ‰ | ||
| Marbled rockfish | |||
| Sebastiscus marmoratus | |||
| CTMax 29.7 °C | 15 °C seawater | Kita et al. (1996) | |
| CTMin 4.9 °C | 15 °C seawater | ||
| CTMax 31.6 °C | 20 °C seawater | ||
| CTMin 6.2 °C | 20 °C seawater | ||
| CTMax 32.8 °C | 25 °C seawater | ||
| CTMin 8.0 °C | 25 °C seawater | ||
The UILT and CTMax of 24 marine fish species in the Gulf of Thailand were 32.0–37.5 °C and 33.7–42.3 °C respectively, and the UILT were approximately 8–14 °C above the acclimation temperature (Menasveta 1981). In the present study, the CTMin was 5.7–9.8 °C, 5.7–6.6 °C and 2.2– 2.7 °C lower than the LILT of A. latus maintained at 32, 25 and 10 °C respectively.
Reported levels of UILS and LILS are summarized in Table 2. Wu & Woo (1983) reported that adult marine fish: rabbit fish, Siganus oramin (Bloch and Schneider), red grouper, Epinephelus akaara (Temminck and Schlegel), yellow grouper, Epinephelus awoara (Temminck and Schlegel), three-stripped tiger fish, Therapon jarbua (Klonzinger), fingermark bream, Lutjanus russelli (Bleeker) and sea bream, Mylio macrocephalus (Basilewsky) survived for two weeks after being transferred suddenly from 33‰ to 10‰. Our research indicated that the tolerable salinity level of fish depends on the acclimation salinity and temperature.
| Species | Reported levels | Acclimation condition | Reference |
|---|---|---|---|
| Bonefish Albula sp. | UILS 520 ‰ | 20.5 °C and 8‰ | Pfeiler (1981) |
| UILS 590 ‰ | 20.5 °C and 35‰ | ||
| UILS 630 ‰ | 20.5 °C and 50‰ | ||
| LILS 2.90 ‰ | 20.5 °C and 8‰ | ||
| LILS 3.30 ‰ | 20.5 °C and 35‰ | ||
| LILS 5.20 ‰ | 20.5 °C and 500 ‰ | ||
| Colorado squaufish Ptychocheilus lucius | UILS 13.10 ‰ | Freshwater 22 °C | Nelson & Flickinger (1992) |
| Yellowfin sea bream Acanthopagrus latus | UILS 37.80 ‰ | 32 °C and 330 ‰ | Present study |
| CSMax 660 ‰ | 32 °C and 330 ‰ | ||
| UILS 44.10 ‰ | 25 °C and 330 ‰ | ||
| CSMax 700 ‰ | 25 °C and 330 ‰ | ||
| UILS 42.90 ‰ | 10 °C and 330 ‰ | ||
| CSMax 710 ‰ | 10 °C and 330 ‰ | ||
| LILS 11.60 ‰ | 32 °C and 330 ‰ | ||
| LILS 7.20 ‰ | 25 °C and 330 ‰ | ||
| LILS 2.50 ‰ | 10 °C and 330 ‰ |
Salinity tolerance is directly related to plasma osmotic regulatory capacity (Nordlie 1987). No mortality occurred when the American plaice, Hippoglossoides platessoides (Bigelow and Schroeder), maintained at 28‰, were transferred suddenly to 7‰ after 96 h. It has been known that the fish maintained at 7‰ decreased plasma Na+ and K+ by 28% and 13% respectively (Munro, Audet, Besner & Dutil 1994). Further research is needed to study the changes in plasma ionic concentration of fish maintained at different salinity and temperature conditions, and transferred to different salinity and temperature levels.
In conclusion, the 50% CTMin of A. latus are negatively related to salinity at three temperatures. A. latus maintained in water with salinity of 33‰ and lower temperature (10 °C) survive temperature as low as 6 °C, and those maintained in salinity of 0.3 and 15‰ and higher temperature (32 °C) survive at a temperature of 10 °C when temperature was decreased. The UILS of fish increases directly with salinity at three temperatures. The fish maintained at 33‰ and low temperature (10 °C) could tolerate much higher salinity levels of 66‰ when salinity was increased gradually. The fish maintained at freshwater (0.3‰) at higher temperature (32 °C) could tolerate salinity levels of 50‰ when salinity was increased gradually. Appropriate management of temperature and salinity levels in pond waters is suggested during the farming of yellowfish sea bream.
Acknowledgments
This research was supported by the Council of Agriculture, Republic of China (Grant No. 86-Ke-Chi-1–12-Yu-07-2-4). We thank Mr S P Yea for kindly supplying the test animals.


