Overexpression of the myristoylated alanine-rich C kinase substrate decreases uptake and K+-evoked release of noradrenaline in the human neuroblastoma SH-SY5Y
Abstract
The aim of this study was to investigate a possible role of the myristoylated alanine-rich C kinase substrate (MARCKS) in the mechanism of noradrenaline uptake and release in the human neuroblastoma cell line SH-SY5Y. A stable cell line showing a twofold overexpression of MARCKS was prepared by transfecting SH-SY5Y with pCEP4 containing MARCKS cDNA in the sense orientation. This cell line showed no changes in the expression of neurofilaments or markers of noradrenergic large dense-cored vesicles compared with both untransfected SH-SY5Y and SH-SY5Y transfected with pCEP4 only (mock transfected). Similarly, no differences in the rate of cell growth could be detected between these three cell lines. In contrast, specific uptake and depolarization-evoked (100 mm K+) release of noradrenaline from the cell line overexpressing MARCKS was inhibited by approximately 50% compared with mock-transfected SH-SY5Y. K+-evoked noradrenaline release enhanced by pretreatment with 12-O-tetradecanoylphorbol 13-acetate (100 nm) was also inhibited by 50%. In contrast, carbachol-evoked noradrenaline release was unaffected. Thus, in SH-SY5Y cells, overexpression of MARCKS leads to a decrease in the K+-evoked noradrenaline release possibly by increased actin cross-linking preventing the movement of noradrenaline containing large dense-cored vesicles to the plasma membrane in response to depolarization.
Introduction
The myristoylated alanine-rich C-kinase substrate (MARCKS) is a widely distributed protein kinase C (PKC) substrate that binds calcium/calmodulin and actin, and has been implicated in cell motility, phagocytosis, membrane trafficking and mitogenesis (Aderem, 1992; Blackshear, 1993; Aderem, 1995). MARCKS is highly concentrated in presynaptic junctions, suggesting a role in secretion and membrane cycling, probably effected by mediating changes in the actin cytoskeleton. The human MARCKS gene (MACS) has been identified and a human MARCKS cDNA cloned (Harlan et al., 1991). Studies in mice in which the gene encoding MARCKS has been disrupted showed that MARCKS was essential for the normal development of the central nervous system and postnatal survival (Stumpo et al., 1995). Stable overexpression of MARCKS has been shown to lead to increased phorbol ester-stimulated phosphatidylcholine synthesis in human neuroblastoma cells (Roséet al., 1996). Previously, MARCKS has been stably overexpressed from pcDNA3 in the human neuroblastoma SK-N-MC and has been shown to enhance the activation of phospholipase D by PKC (Morash et al., 1998). The effect on neurotransmitter release was not investigated. Transfection of the murine B16 melanoma cell line with a plasmid containing the MARCKS cDNA in the sense orientation has been shown to suppress cell growth (Brooks et al., 1996). Thus, overexpression of MARCKS is able to affect cytoskeleton-mediated cell processes.
The human neuroblastoma SH-SY5Y expresses noradrenaline (NA) and neuropeptide Y (NPY) which are costored in large dense-cored vesicles (LDCVs; Murphy et al., 1991; Goodall et al., 1997a; Ou et al., 1998; Danks et al., 1999). Release of NA is evoked by depolarization and receptor activation, and is enhanced by activation of protein kinase C in response to an 8-min pretreatment with 12-O-tetradecanoylphorbol 13-acetate (TPA; 100 nm) (Murphy et al., 1992; Turner et al., 1994, 1996; Vaughan et al., 1995, 1998). Our previous studies have implicated MARCKS in the regulation of NA release from SH-SY5Y cells (Goodall et al., 1997b; Vaughan et al., 1998). In the present work a stable cell line overexpressing human MARCKS was prepared by transfecting SH-SY5Y cells with the mammalian episomal expression vector pCEP4 containing human MARCKS cDNA in the sense orientation (pCEP4/MARCKS). Our data show that this cell line has decreased specific uptake of NA and releases less NA in response to depolarization than cells transfected with vector only. No effect on growth rate was detected.
Materials and methods
Materials
The SH-SY5Y cell line was kindly provided by Dr J. L. Biedler (Sloan Kettering Institute for Cancer Research, NY, USA). Tissue culture flasks and plates were purchased from Costar (High Wycombe, UK). Ham's F12 nutrient mixture, Eagle's minimal essential medium, nonessential amino acids, gentomycin and phosphate-buffered saline (PBS) without Ca2+ and Mg2+, were purchased from Gibco (Paisley, UK). Fetal calf serum was from Harlan (Sussex, UK). Immobilon-P polyvinylidene difluoride membranes were purchased from Millipore (Hertfordshire, UK). The monoclonal antibody raised against MARCKS was obtained from TCS Biologicals (Buckinghamshire, UK). [3H]NA (40 Ci/mmol), sheep antimouse IgG peroxidase conjugate, enhanced chemiluminescence immunoblotting kit and Hyperfilm-ECL were from Amersham International (Buckinghamshire, UK). All reagents used for sodium dodecyl sulphate-polyacrylamide gel electrophoresis (SDS-PAGE) were obtained from Bio-Rad (Hertfordshire, UK), except for the acrylamide/bis-acrylamide solution which was from Anachem (Bedfordshire, UK). All reagents used for immunocytochemistry were from Sigma Chemical (Poole, UK). Hygromycin B was purchased from Calbiochem-Novabiochem (Nottinghamshire, UK). pBluescriptIISK containing human MARCKS was a kind gift from Dr Thomas Herget (University of Mainz, Mainz, Germany). pCEP4 was obtained from Invitrogen (CA, USA). Enzymes for the successful cloning of MARCKS cDNA into pCEP4 were obtained from New England Biolabs (Hertfordshire, UK). All other reagents, unless stated in the text, were obtained from either Sigma Chemical or BDH Laboratory Supplies (Dorset, UK).
Cell culture
SH-SY5Y cells were cultured as described in Murphy et al. (1991). Briefly, cells were grown in a 1 : 1 mixture of Ham's F-12 nutrient mixture and Eagle's minimal essential medium supplemented with 10% (v/v) fetal calf serum, nonessential amino acids and containing 50 µg/mL gentamycin in an air/CO2 (49 : 1) humidified incubator at 37 °C.
Subcloning of MARCKS cDNA into pCEP4 expression vector and cell transfections
MARCKS cDNA fragment cloned into pBluescriptIISK was subcloned into pCEP4 in the sense orientation between the BamHI and KpnI restriction sites. Orientation and position of the MARCKS gene in this construct was confirmed by both sequence analysis (ABI PRISM Dye Terminator Cycle Sequencing Ready Reaction Kit; Perkin Elmer, Cheshire, UK) and restriction enzyme digestion. SH-SY5Y cells were seeded in 75 cm2 flasks at a density of 1 × 10⁵ cells/mL of medium and left to adhere to the flask for 24 h resulting in a 60% confluent layer. Cells were transfected with pCEP4 containing human MARCKS cDNA inserted in the sense orientation (pCEP4/MARCKS) and with pCEP4 only (mock transfected) using 37.5 µL of ExGen500 (TCS Biologicals) and 12.5 µg of DNA per flask (giving a 3 : 1 ratio of Exgen500 to DNA) for 4 h. Cells were refed after 24 h and supplemented with 300 µg/mL hygromycin B after 72 h. pCEP4 contains a gene for hygromycin B resistance and thus cells transfected with pCEP4 can be selected on the basis of their resistance to hygromycin B. The concentration of hygromycin B used had been previously optimized in our group to give the most efficient cell kill for untransfected SH-SY5Y and to select and maintain SH-SY5Y cell lines transfected with pCEP4 containing cDNA for the ATIA angiotensin II receptor (McDonald et al., 1997). Untransfected cell controls were included to ensure that this concentration of hygromycin B was killing all untransfected cells during the selection procedure. These cell lines were then grown in the presence of 300 µg/mL hygromycin B to maintain selection of stable transfectants. The expression of MARCKS was measured by immunoblotting of crude cell extracts of confluent cell layers as follows. The confluent cell layer was rinsed twice with PBS without Ca2+ and Mg2+ and removed by scraping in SDS-PAGE sample buffer (Laemmli, 1970) without 2-mercaptoethanol or bromophenol blue (1 mL per 75 cm2 flask). The cell lysate was transferred to an Eppendorf microcentrifuge tube and heated in a boiling water bath for 10 min. A sample (100 µL) was taken for protein assay and replaced with 100 µL of 2-mercaptoethanol and 10 µL of a saturated solution of bromophenol blue. The cell extract was boiled for a further 10 min and equal protein amounts (5 µg) were analysed by SDS-PAGE (Laemmli, 1970) to allow direct comparison between the cell lines. Proteins were transferred to polyvinylidene difluoride membrane at a constant voltage of 30 V overnight and immunoblotted with MARCKS antibody (diluted 1 : 10 000). After thorough washing of membranes, immunolabelled proteins were detected using enhanced chemiluminescence, according to the manufacturer's instructions. The level of MARCKS expression was presented as a percentage of that found in the untransfected cells by densitometric analysis using the MagiScan system and the Gemini computer program (Applied Imaging, Tyne and Wear, UK).
Immunocytochemistry for light microscopy
Cells were grown on glass coverslips for 4–5 days. The cells were washed twice with PBS containing 1 mm CaCl2 and then fixed for 5 min with 10% formalin and permeabilized with 0.5% Triton-X 100 in PBS for 15 min. Permeabilized cells were refixed with formalin (5 mins), washed three times with PBS and incubated in PBS containing 1 mm sodium azide and 5% normal goat serum for 3 h to block nonspecific binding. Incubation with diluted primary antibodies, neuropeptide Y (NPY; Sigma Chemical) 1 : 300, neurofilament cocktail (Affinity Research Products, Devon, UK), 1 : 500, dopamine β hydroxylase (DβH; Affinity Research Products) 1 : 100 and vesicular monoamine transporter II (VMAT-II; Chemicon International, Harrow, UK) 1 : 100, was carried out overnight. The primary antibodies were diluted in PBS containing 1 mm sodium azide and 5% normal goat serum. After thorough washing with PBS, the cells were incubated with secondary antibody conjugated with fluorescein isothiocyanate (Sigma Chemical), 1 : 100, for 3 h. All incubations were conducted at room temperature. For controls, cells were processed in the same way, except that the primary antibodies were omitted from the initial incubation.
Measurement of cell growth
Untransfected SH-SY5Y and SH-SY5Y cells stably transfected with pCEP4 and pCEP4/MARCKS were seeded at a density of 1 × 10⁴ cells/mL in six-well culture dishes. The number of adherent cells per well was counted every 24 h as follows. The medium was removed from the wells and the cell layers were washed in PBS and then in PBS containing 0.1% EDTA. The cells were then harvested in 1 mL PBS, without Ca2+ or Mg2+, containing 10% trypsin. After trypsinization, 250 µL of fetal calf serum was added to neutralize the trypsin and the cell suspension was triturated three times. The cells were pelleted by centrifugation (1000 g, 5 min, 37 °C), the supernatant removed and the pellet resuspended by triturating in approximately 100 µL of complete medium. A 9-µL aliquot was counted with a Neubauer haemocytometer and the value used to calculate the number of cells/well. Triplicate wells were counted each day for each of the three cell lines.
Measurement of [3H]NA uptake
The uptake of [3H]NA by SH-SY5Y was measured essentially as described previously (O'Neill et al., 1994). Cells were grown in 24-well plates and assayed for NA uptake after 4 days. Briefly, culture medium was removed and the confluent monolayer washed twice with 0.4 mL HEPES-buffered saline (HBS: 135 mm NaCl, 5 mm KCl, 10 mm HEPES, 6 mm glucose, 2.5 mm CaCl2·2H2O, 0.6 mm MgSO4·7H2O, 20 µg/mL pargyline, 20 µg/mL ascorbic acid) before replacing it with HBS containing 50 nm[3H]NA (to measure total uptake) and HBS containing 50 nm[3H]NA and 1 µm desipramine hydrochloride (to measure nonspecific uptake). After incubation at 37 °C for 10 min or 1 h, uptake was stopped by washing six times in 0.4 mL HBS to remove excess [3H]NA. The [3H]NA taken up by the cell monolayer was extracted with two 0.4 mL aliquots of 0.4 m HClO4. The cell layer was taken up in 0.5 mL of solubilization buffer (0.1 m NaOH and 2% [w/v] SDS) and assayed for protein by the bicinchoninic acid method. All assays were carried out in triplicate.
Measurement of [3H]NA release
The release of [3H]NA from SH-SY5Y was measured essentially as described previously (Murphy et al., 1991). Cells were grown in 24-well plates and assayed for NA release after 4 days. Briefly, culture medium was removed and the monolayer washed twice with HBS before replacing it with 0.4 mL HBS containing 50 nm[3H]NA. After incubation at 37 °C for 1 h, excess [3H]NA was removed by washing the cell monolayer with 4 × 0.4 mL HBS at 10-min intervals. For measuring [3H]NA release, the monolayer was washed twice with 0.4 mL HBS at 4 min intervals, followed by a 4-min incubation with 0.4 mL HBS (to measure basal release), elevated K+ (HBS containing 40 mm NaCl/100 mm KCl) or 1 mm carbachol. For measurement of TPA-enhanced release, cells were rinsed twice with 0.4 mL 100 nm TPA in HBS at 4 min intervals before addition of secretagogues. Unreleased [3H]NA in the cell monolayer was extracted with two 0.4-mL aliquots of 0.4 m HClO4. The amount of [3H]NA release was expressed as a percentage of the total amount of radioactivity present in the cell layer at the beginning of the experiment. All assays were carried out in duplicate.
Scintillation counting
Pre-wash, stimulation and HClO4 incubations (0.4 mL) were collected in scintillation vials to which 3 mL Goldstar multipurpose liquid scintillation cocktail (Meridian, Surrey, UK) was added. Vials were counted in a Packard 2100TR liquid scintillation analyser. The amount of [3H]NA uptake was expressed as the total amount of radioactivity present in the cell layer per microgram of protein. The amount of [3H]NA release was expressed as a percentage of the total amount of radioactivity present in the cell layer before addition of secretagogues.
Protein determination
Protein concentrations were determined using the bicinchoninic acid protein assay based on the method of Lowry et al. (1951). The assay was carried out using bicinchoninic acid assay reagents (Sigma Chemical) according to the manufacturer's instructions.
Statistical analysis
All experiments were repeated at least three times. Results reported from one experiment were representative of a series that gave similar results. Statistical significance was assumed at P < 0.05 using anova followed by a Bonferroni-corrected Student's t-test. Data are presented as mean ± SEM.
Results
Changes in MARCKS expression in transfected SH-SY5Y
Cell lines of SH-SY5Y transfected with pCEP4/MARCKS expressed more than twice the amount of MARCKS found in untransfected or mock-transfected cells (209 ± 34.7% increase from untransfected cells [n = 4]; Fig. 1). This difference was shown to be statistically significant (P < 0.05). This level of overexpression of MARCKS was maintained for at least 5 months (data not shown) showing that these cells were stable transfectants. Western blots of SH-SY5Y transfected stably with pCEP4 only showed no statistically significant change in MARCKS expression compared with untransfected cells.
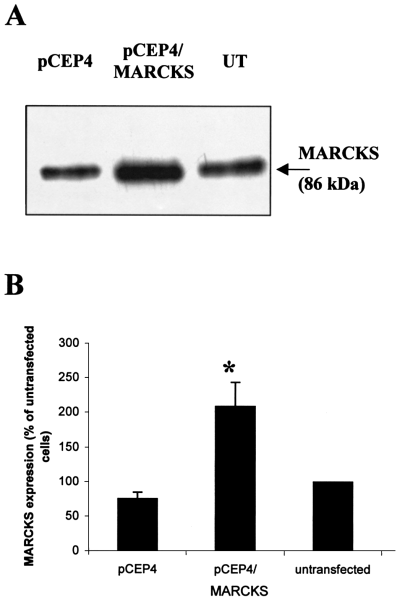
Expression of MARCKS in SH-SY5Y cell lines stably transfected with pCEP4 and pCEP4 containing MARCKS cDNA in the sense orientation by Western blot. Equal protein amounts (5 µg) of untransfected (UT) SH-SY5Y and SH-SY5Y cell lines stably transfected with pCEP4 or pCEP4/MARCKS were separated by SDS-PAGE. Western blotting was carried out with a monoclonal antibody against MARCKS. A representative immunoblot is shown from four separate experiments (A). The amount of MARCKS in each cell line was quantified by densitometry and expressed as a percentage of that found in untransfected SH-SY5Y. Data are mean ± SEM from four separate experiments (B). *P < 0.05 for the effect of human MARCKS cDNA expression from pCEP4 in the sense orientation on the expression of MARCKS compared with untransfected and mock-transfected SH-SY5Y (using anova with subsequent Bonferroni-corrected Student's t-test).
Characterization of SH-SY5Y cell lines stably transfected with pCEP4 and pCEP4/MARCKS
Immunocytochemistry
The staining pattern of untransfected SH-SY5Y for NPY, neurofilaments and DβH is shown in Fig. 2a, c and e). Although some variation in the amount of staining is observed between cells, comparison with the bright-field images of the same fields of view (Fig. 2b, d and f) shows that all the cells in the field express these proteins and can therefore be classified as having a neuronal and adrenergic phenotype. Omitting the primary antibody leads to a complete absence of fluorescent staining (Fig. 2g). A similar staining pattern was observed in the transfected cell lines for NPY and neurofilaments (Fig. 3), and also for DβH and VMAT-II (Fig. 4). Again all of the cells stained for these markers (albeit with variable levels of staining) and thus expressed a neuronal and adrenergic phenotype. In addition, no difference in staining pattern could be observed between the cells transfected with pCEP4 only and those transfected with pCEP4 containing MARCKS cDNA (3, 4).
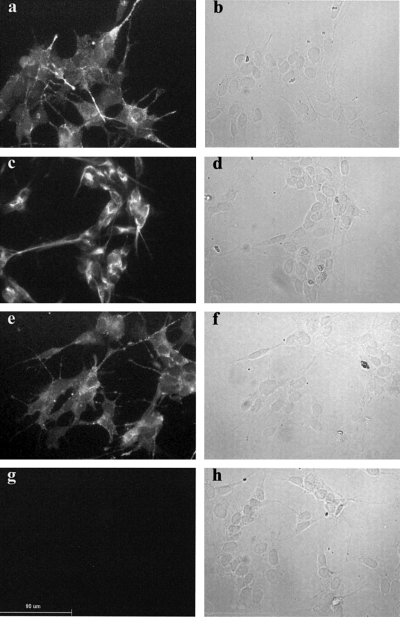
The expression of neurofilaments and markers of LDCVs in untransfected SH-SY5Y by immunocytochemistry. Immunocytochemistry was performed on untransfected SH-SY5Y using antibodies against neuropeptide Y (a), neurofilaments (c) and dopamine β hydroxylase (e) as described in Materials and methods. Corresponding bright-field images of the same fields of view are also shown (b, d and f). A fluorescence micrograph (g) and a bright-field micrograph (h) are shown for control cells treated with secondary antibody only. Scale bar, 90 µm. The figure shows representative images from three separate experiments.
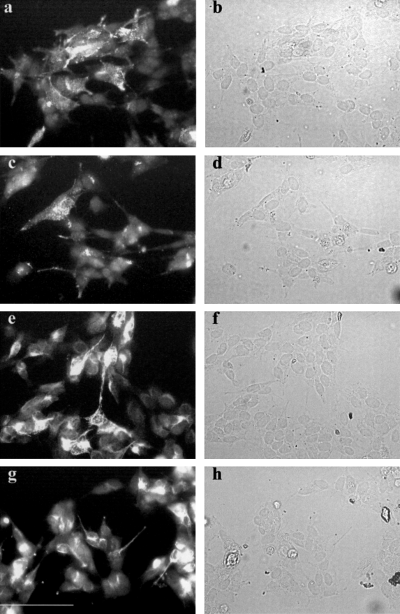
The expression of neuropeptide Y (NPY) and neurofilaments in SH-SY5Y stably transfected with pCEP4 and pCEP4/MARCKS by immunocytochemistry. Immunocytochemistry was performed on SH-SY5Y cell lines stably transfected with pCEP4 (a, b, e and f) and pCEP4/MARCKS (c, d, g and h) using antibodies against NPY (a–d) and neurofilaments (e–h) as described in Materials and methods. The fluorescence micrographs (a, c, e and g) and the corresponding bright-field micrographs (b, d, f and h) are shown. Scale bar, 90 µm. The figure shows representative images from three separate experiments.
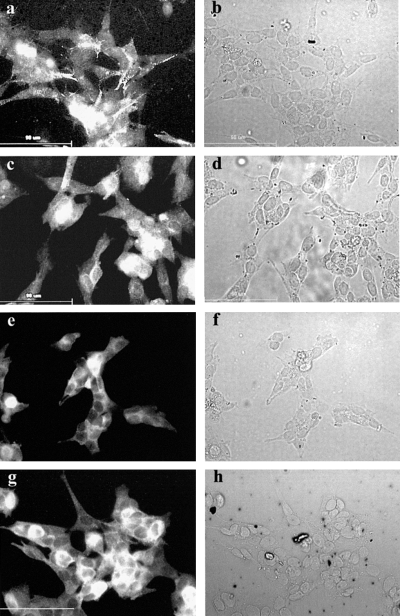
The expression of dopamine β hydroxylase (DβH) and vesicular monoamine transporter-II (VMAT-II) in SH-SY5Y stably transfected with pCEP4 and pCEP4/MARCKS by immunocytochemistry. Immunocytochemistry was performed on SH-SY5Y cell lines stably transfected with pCEP4 (a, b, e and f) and pCEP4/MARCKS (c, d, g and h) using antibodies against DβH (a–d) and VMAT-II (e–h) as described in Materials and methods. The fluorescence micrographs (a, c, e and g) and the corresponding bright-field micrographs (b, d, f and h) are shown. Scale bar, 90 µm. The figure shows representative images from three separate experiments.
Growth
No significant differences were observed between the growth rates of untransfected SH-SY5Y cells and the stable cell lines transfected with pCEP4 and pCEP4/MARCKS (Fig. 5).
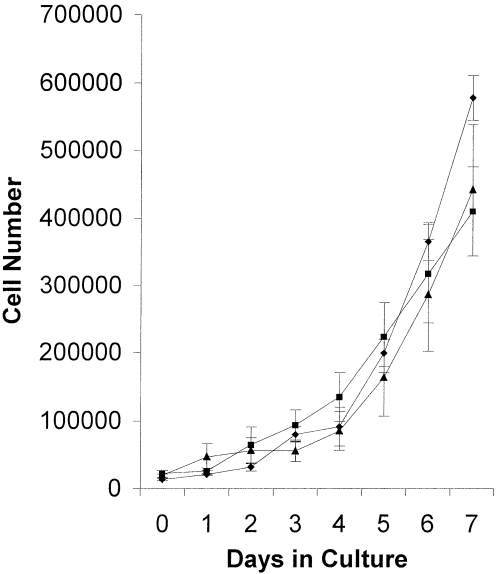
Growth rate of SH-SY5Y cell lines stably transfected with pCEP4/MARCKS. Untransfected SH-SY5Y (diamonds) and SH-SY5Y cell lines stably transfected with pCEP4 (squares) or pCEP4/MARCKS (triangles) were seeded at density of 4 × 10⁴ cells/mL in six-well plates. Cells were left to adhere to the plastic flask for 24 h and the number of attached cells counted (day 0) using a Neubauer haemocytometer. The number of cells was then counted every 24 h. Data points are mean ± SEM for three separate experiments each performed in triplicate. Differences in cell number between the three cell lines were shown to be nonsignificant (using anova with subsequent Bonferroni-corrected Student's t-test).
Effect of MARCKS overexpression on [3H]NA uptake
Non-specific uptake was less than 10% of total uptake and did not differ significantly for the three cell lines (data not shown). Non-specific uptake was subtracted from the total uptake to give specific uptake (Fig. 6). The specific uptake of [3H]NA over an initial 10-min period was measured (Fig. 6A). In untransfected SH-SY5Y, this initial uptake was 857 ± 31.4 cpm/µg of protein. Both of the transfected cell lines (including the line transfected with pCEP4 only) showed initial NA uptake that was significantly less than that of the untransfected SH-SY5Y. In addition, initial NA uptake by SH-SY5Y overexpressing MARCKS was decreased by 55% (from 391 ± 37.8 cpm/µg of protein to 173 ± 10.9 cpm/µg of protein [n = 3]) compared with that by mock-transfected SH-SY5Y. This decrease was shown to be statistically significant (P < 0.01).
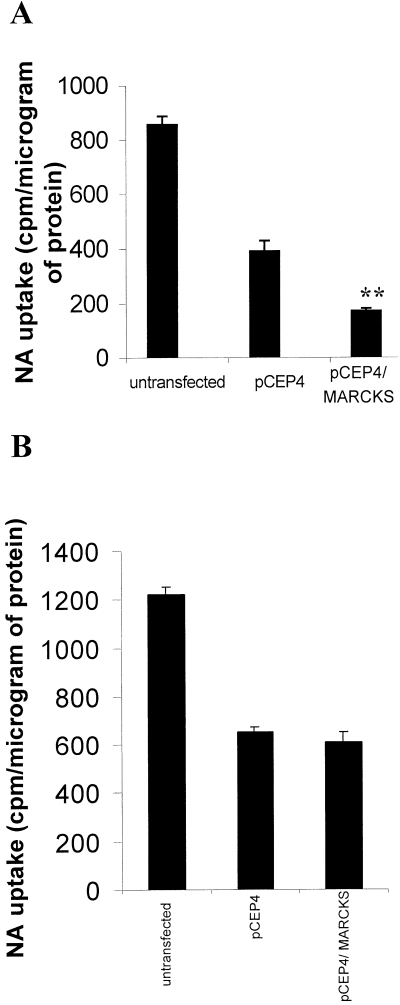
Effect of human MARCKS overexpression on noradrenaline (NA) uptake. [3H]NA uptake was measured in 24-well plates over 10 min (A) or 1 h (B) as described in Materials and methods in untransfected SH-SY5Y and SH-SY5Y stably transfected with pCEP4 or pCEP4/MARCKS. Data are the mean of total uptake over the whole time-course of either 10 min (A) or 60 min (B) expressed as counts per minute (cpm) per microgram of protein ± SEM (bars) values for three separate experiments each performed in triplicate. Specific uptake by both transfected cell lines was significantly less than that by untransfected cells over both time-courses (using anova with subsequent Bonferroni-corrected Student's t-test; P < 0.001). **P < 0.01 for the effect of MARCKS overexpression on the initial specific-NA uptake compared with mock-transfected (pCEP4) SH-SY5Y (using anova with subsequent Bonferroni-corrected Student's t-test).
When [3H]NA uptake was measured after 1 h (Fig. 6B), the specific uptake into the transfected cell lines was again approximately 50% of that for untransfected SH-SY5Y (1220 ± 34.6 cpm/µg of protein for untransfected SH-SY5Y). However, after 1 h no significant difference was observed between the specific uptake of [3H]NA by the mock-transfected and the MARCKS-overexpressing cell lines (653 ± 20 cpm/µg of protein and 611 ± 42.4 cpm/µg of protein [n = 3], respectively).
Effect of MARCKS overexpression on [3H]NA release
In the untransfected cells, basal release (i.e. release in the presence of HBS only) was 4.3 ± 0.3% (n = 4) of [3H]NA taken up and 4.3 ± 0.2% (n = 4) following pretreatment with TPA (Fig. 7). In these untransfected cells, 100 mm K+ evoked release of 14.4 ± 1.2% (n = 4) of [3H]NA taken up by the cells. This was enhanced by 37% (to 19.7 ± 0.6% [n = 4]) following pretreatment with TPA. Carbachol evoked release of 6.0 ± 0.4% (n = 4) of [3H]NA taken up and this was enhanced by 45% (to 8.7 ± 0.7% [n = 4]) following pretreatment with TPA.
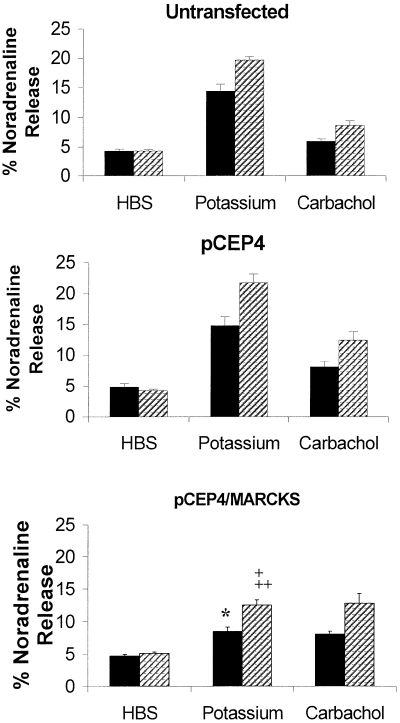
Effect of human MARCKS overexpression on NA release. Potassium- and carbachol-evoked [3H]NA release were measured as described in Materials and methods from untransfected SH-SY5Y and SH-SY5Y stably transfected with pCEP4 or pCEP4/MARCKS. Prior to evoking release cell layers were pretreated for 8 min in HBS in the presence (hatched columns) and absence (filled columns) of 100 nm TPA. Data are mean ± SEM (bars) values for four separate experiments each performed in duplicate. *P < 0.05 for the effect of MARCKS overexpression on the potassium-evoked release of NA from SH-SY5Y compared with untransfected and mock-transfected cells; †P < 0.05 for the effect of MARCKS overexpression on the TPA-enhanced, potassium-evoked release of NA from SH-SY5Y compared with untransfected cells, ††P < 0.01 for the effect of MARCKS overexpression on the TPA-enhanced, potassium-evoked release of NA from SH-SY5Y compared with mock-transfected cells (using anova with subsequent Bonferroni-corrected Student's t-test).
No significant differences were observed between the NA-releasing properties of the stable cell line transfected with pCEP4 alone and the untransfected SH-SY5Y. Basal release from this mock-transfected cell line was 4.8 ± 0.6% (n = 4) of [3H]NA taken up and 4.3 ± 0.2% (n = 4) following pretreatment with TPA. In these mock-transfected cells, 100 mm K+ evoked release of 14.8 ± 1.5% (n = 4) of [3H]NA taken up by the cells. This was enhanced by 47% (to 21.8 ± 1.4% [n = 4]) following pretreatment with TPA. Carbachol evoked release of 8.1 ± 0.9% (n = 4) of [3H]NA taken up and this was enhanced by 53% (to 12.4 ± 1.5% [n = 4]) following pretreatment with TPA.
In the cells stably transfected with pCEP4/MARCKS, basal release was 4.7 ± 0.3% (n = 4) of [3H]NA taken up which increased to 8.5 ± 0.6% (n = 4) of [3H]NA taken up following depolarization with 100 mm K+. This was significantly less than 100 mm K+-evoked release from both the untransfected and mock-transfected cell lines (P < 0.05 in both cases). Thus, overexpression of MARCKS resulted in a 41% decrease in K+-evoked NA release compared with untransfected cells and a 43% decrease compared with cells transfected with pCEP4 alone. In these MARCKS-overexpressing cells, 100 mm K+-evoked release was enhanced by 48% (to 12.6 ± 0.8% [n = 4]) following pretreatment with TPA, compared with basal release of 5.1 ± 0.29% (n = 4). Similarly, TPA-enhanced, 100 mm K+-evoked release was significantly less in these MARCKS-overexpressing cells compared with both the untransfected and mock-transfected cell lines (P < 0.05 and P < 0.01, respectively). Thus, overexpression of MARCKS resulted in a 36% decrease in TPA-enhanced, K+-evoked NA release compared with untransfected cells and a 42% decrease compared with cells transfected with pCEP4 alone. Carbachol evoked 8.1 ± 0.5% (n = 4) of [3H]NA taken up and this was enhanced by 58% (to 12.8 ± 1.5% [n = 4]) following pretreatment with TPA. Carbachol-evoked release (both in the presence and absence of TPA pretreatment) from this MARCKS-overexpressing cell line was not significantly different from neither the untransfected nor the mock-transfected cell lines.
Discussion
Our previous studies have shown that pretreatment of SH-SY5Y cells with TPA leads to the enhancement of NA release (Murphy et al., 1992; Turner et al., 1994, 1996). This is accompanied by translocation of PKCα from the cytosol to the plasma membrane, the incorporation of 32Pi into MARCKS and a relocation of approximately 50% of MARCKS from membrane to cytosolic fractions (Goodall et al., 1997b). In addition, TPA treatment leads to a partial disruption of the filamentous actin (F-actin) cytoskeleton and an increase in the number of noradrenaline-containing LDCVs adjacent to the plasma membrane (Danks et al., 1999). These studies imply that the phosphorylation and subsequent translocation of MARCKS from the plasma membrane to the cytosol are important steps in the enhancement of NA release by protein kinase C. Since phosphorylation of MARCKS interferes with its ability to cross-link F-actin (Hartwig et al., 1992), it is suggested that local rearrangement of the cytoskeleton occurs. Secretory vesicles, which are held back from the plasma membrane by the F-actin barrier, may now move to the plasma membrane preparatory to fusion in response to elevation of cytosolic Ca2+ (Murphy et al., 1991; Vaughan et al., 1998).
The present study sought to obtain further evidence for a role for MARCKS in NA release by examining the effect of overexpressing a full-length cDNA for human MARCKS (a kind gift from Dr T. Herget; Herget et al., 1992) on cell growth and NA uptake and release in SH-SY5Y. SH-SY5Y cells were transfected with pCEP4 and pCEP4/MARCKS and two hygromycin B-resistant stable cell lines were isolated. The expression level of MARCKS was not affected by the transfection process per se as cells mock transfected with pCEP4 alone showed no significant difference in MARCKS expression compared with untransfected SH-SY5Y. The cell line containing pCEP4/MARCKS was shown by Western blots and densitometric analysis to express more than twice the amount of MARCKS detected in both untransfected and mock-transfected control cells. The twofold increase in expression of MARCKS in SH-SY5Y is at the lower end of the increases in MARCKS observed following overexpression of this protein in human choroidal melanoma cells (between 1.8- and ninefold; Manenti et al., 1998). One possible reason for the relatively modest increase in MARCKS is a relatively high level of endogenous MARCKS expression in untransfected SH-SY5Y compared with melanoma cells. Indeed, reduced expression of MARCKS has been described in various cell lines after transformation. This is the case in human choroidal melanoma cells which show a downregulation of MARCKS to nearly nondetectable levels compared with normal choroidal melanocytes (Manenti et al., 1998). Immunoblotting of whole SH-SY5Y homogenates from untransfected or mock-transfected cells gives a strong MARCKS signal from only 5 µg of total protein (Fig. 1) and immunocytochemistry using the same antibody also showed strong fluorescent staining (data not shown). Immunocytochemistry showed that in SH-SY5Y MARCKS appears to be present in different intracellular pools. Appreciable amounts of MARCKS staining was associated with the plasma membrane, however, there was also considerable immunoreactivity associated with structures in the cytoplasm. Previous evidence for the association of MARCKS with cytoplasmic structures has come from studies on fibroblasts that showed that MARCKS is associated with both the plasma membrane and lysosomes (Allen & Aderem, 1995). No obvious differences in the distribution of fluorescent staining between the untransfected, mock-transfected and MARCKS-overexpressing cell lines were detected. The presence of MARCKS at intracellular locations, as well as at the plasma membrane, suggests that MARCKS may have a role in membrane trafficking or as a PKC-regulated calmodulin store.
The human sympathetic neuronal cell line SH-SY5Y can occur as a mixed population of cells with neuronal and non-neuronal (epithelial-like) phenotypes (Biedler et al., 1978). To preclude the possibility of selective transfection and selection of the non-neuronal phenotype, expression levels of neurofilaments, neuropeptide Y (NPY), dopamine β hydroxylase (DβH) and VMAT-II were measured by immunocytochemistry. These markers were chosen because neurofilaments are a major cytoskeletal element in nerve axons and dendrites, and NPY is a neuropeptide costored with NA in LDCVs. DβH and VMAT-II are enzymes associated with the LDCVs in sympathetic neurons where they are involved in the synthesis of NA and its packaging into vesicles, respectively. No differences in the staining patterns for the neuronal marker neurofilaments or for markers of LDCVs were observed between untransfected SH-SY5Y and the two transfected cell lines (2-4). Thus, the transfection and selection procedure has not altered the proportion of cells expressing these markers and hence no enrichment of the non-neuronal phenotype has occurred in these transfected cell lines during the selection procedure.
Alterations in MARCKS expression have been shown to affect the growth rate of cells. Transfection of a murine melanoma cell line with a plasmid containing MARCKS cDNA in the sense orientation produced clones displaying reduced proliferative capacity compared with control cells (Brooks et al., 1996). In contrast, transfection with an antisense construct plasmid produced colonies that displayed enhanced growth compared with control cells. Similarly, stable transfection of a human melanoma cell line with the cDNA coding for MARCKS in the sense orientation produced clones that showed a 35–40% reduction in cell growth compared with control cells (Manenti et al., 1998). In contrast to these findings, the present study in SH-SY5Y showed no significant effect on cell proliferation of overexpression of MARCKS (Fig. 5). This may be due to the lower level of MARCKS overexpression in this SH-SY5Y cell line (twofold) compared with that of the human melanoma clones (up to ninefold Manenti et al., 1998). The similar growth rates of the untransfected and mock-transfected cells provide further evidence that the transfection and treatment with hygromycin B has not led to the selective enrichment of different cell types.
Uptake of [3H]NA into SH-SY5Y using a subsaturating concentration of [3H]NA (O'Neill et al., 1994) for 10 min has been shown previously in our group to be on the linear part of the uptake curve. Under these conditions, uptake of [3H]NA by the transfected cell lines was found to be less than half of that of untransfected SH-SY5Y (Fig. 6A). The immunocytochemical studies on neurofilaments and markers for LDCVs (2-4) preclude the possibility of selective transfection and selection of the non-neuronal S phenotype sometimes found in populations of SH-SY5Y (Biedler et al., 1978). Therefore, this cannot be the reason for the reduced [3H]NA uptake into these transfected cell lines. A more likely explanation for the lower uptake of NA into the transfected cell lines is some nonspecific effect of the transfection or selection procedures. The effects of changes in MARCKS expression on NA uptake were therefore ascertained by comparing NA uptake in the cell lines containing pCEP4/MARCKS with those containing pCEP4 only (mock-transfected). Initial uptake of NA by the SH-SY5Y cell line that overexpresses MARCKS is approximately 50% of that observed in mock-transfected cells (Fig. 6A), and this difference was shown to be statistically significant. Thus, the low degree of initial NA uptake by this cell line is likely to be a result of the overexpression of MARCKS. In contrast, after 1 h no difference in [3H]NA uptake was observed between the mock-transfected cell line and the MARCKS-overexpressing cell line (Fig. 6B). Therefore, MARCKS overexpression causes a decrease in the initial rate of NA uptake with no effect on the [3H]NA uptake capacity. The intensity and distribution of VMAT-II staining (Fig. 4) shows little variation between the MARCKS-overexpressing line and the mock-transfected line. Therefore, a decrease in the expression level of VMAT-II or failure of this transporter to be trafficked to LDCVs can be discounted as having an effect on NA uptake downstream of the plasma membrane transporter (NET). Previous evidence for an effect of MARCKS on NA uptake showed that the phosphorylation and subsequent translocation of MARCKS from the plasma membrane was accompanied by an increase in [3H]NA uptake in synaptosomes with no effect on NET mRNA levels (Lu et al., 1998). The authors suggest that MARCKS has an inhibitory effect on the transport of NET to the plasma membrane and that redistribution of MARCKS releases this inhibition resulting in increased NET at the membrane and increased re-uptake of NA. Our data are in agreement with this study as it would be expected that an overexpression of MARCKS would lead to attenuation of NET transport to the plasma membrane resulting in the decreased rate of NA uptake shown in Fig. 6A.
Figure 7 shows [3H]NA release by these three cell lines. All three cell lines release noradrenaline in response to either depolarization or activation of M3-muscarinic receptors. Of particular interest is the observation that in the cells overexpressing MARCKS, depolarization-evoked NA release is decreased by approximately 40% (50% if basal release is subtracted) compared with that observed in control cells (Fig. 7). This reduction in K+-evoked release is observed both in the presence and absence of an 8-min pretreatment with 100 nm TPA shown previously to maximally enhance NA release from SH-SY5Y (Murphy et al., 1992). [3H]NA release is expressed as a percentage of the total [3H]NA taken up by the cell layer. The lack of any differences in the staining pattern of NPY, DβH and VMAT-II (3, 4), together with the similar levels of [3H]NA uptake after 1 h (Fig. 6B), suggest that the size of the vesicular pool for NA is unchanged between the cell lines. Also, the similar levels of [3H]NA uptake by these cell lines after 1 h suggest that the lower NA release evoked by K+ in the cell line overexpressing MARCKS is not a consequence of the decreased initial rate of NA uptake. Thus, percentage [3H]NA release is independent of [3H]NA uptake and the 50% reduction in depolarization-evoked [3H]NA release observed in the MARCKS-overexpressing cell line compared with the mock-transfected cell line is not causally related to the 50% reduction in the initial rate of [3H]NA uptake in this cell line. This reduced depolarization-evoked release is very similar to the relatively low release observed in cells treated with carbachol.
The carbachol-evoked release of [3H]NA from these cell lines is unaffected by the overexpression of MARCKS (Fig. 7). Carbachol-evoked release of NA from SH-SY5Y is completely inhibited by the muscarinic antagonist atropine (Murphy et al., 1991). This excludes the possibility of carbachol acting via the nicotinic receptor shown previously to be present in SH-SY5Y (Vaughan et al., 1993; Wade et al., 1998). The muscarinic receptor involved has been shown to be a M3 receptor subtype (Murphy et al., 1991). In this case, calcium is released from intracellular stores, probably due to increases in IP3 following activation of phospholipase C (Lambert & Nahorski, 1990).
Thus, cells that overexpress MARCKS show decreased uptake of NA and release less NA in response to depolarization. The decreased 100 mm K+-evoked release is also observed when NA release is enhanced by pretreatment with TPA. This pretreatment has also been shown to cause the translocation of PKCα from the soluble to the membrane fraction of SH-SY5Y, the phosphorylation of MARCKS and the translocation of MARCKS from the membrane to the soluble fraction (Goodall et al., 1997b). This 8-min TPA treatment also leads to a partial breakdown of the cortical F-actin barrier of SH-SY5Y and movement of LDCVs towards the plasma membrane (Danks et al., 1999). It may be that overexpression of MARCKS is having its effect on 100 mm K+-evoked NA release by preventing this movement of vesicles to the membrane, either by increased F-actin cross-linking or by tethering LDCVs to the cytoskeleton. If this was the case, it would be expected that in the MARCKS-overexpressing cells, TPA pretreatment would lead to a greater enhancement of K+-evoked NA release than in the mock-transfected cells. In fact the TPA-enhancement of K+-evoked NA release is very similar in both cell lines (≈ 47%). However, the failure of TPA pretreatment to reverse the inhibition of K+-evoked NA release can be explained by the fact that approximately 50% of MARCKS is unaffected by this TPA pretreatment and remains bound to the membrane (Goodall et al., 1997b) where it can continue to cross-link the cortical actin barrier. Thus, an increase in MARCKS expression with no concomitant rise in PKC expression is likely to increase the pool of MARCKS unaffected by TPA pretreatment leading to an inhibition of NA release even in the presence of TPA enhancement. Interestingly, movement of LDCVs towards the plasma membrane of SH-SY5Y has been reported in response to depolarization but not to carbachol (Danks et al., 1999). Carbachol-evoked release would therefore not be affected as this is not accompanied by a concomitant movement of LDCVs to the membrane (Danks et al., 1999). This is in agreement with the data presented in Fig. 7 which show that overexpression of MARCKS has no effect on carbachol-evoked release of NA.
The depolarization-evoked release of NA from SH-SY5Y has been shown to be largely PKC-independent (Turner et al., 1996). Thus, any role for MARCKS in depolarization-evoked release is likely to be due to the interaction of calmodulin and MARCKS that occurs in the presence of Ca2+ (Graff et al., 1989; McIlroy et al., 1991). This interaction inhibits the actin cross-linking ability of MARCKS (Hartwig et al., 1992) and may be a reason behind the localized disruption of the cortical actin network of SH-SY5Y seen in response to depolarization (Danks et al., 1999). Carbachol-evoked release of NA from SH-SY5Y is PKC-dependent (Turner et al., 1996). Any role for MARCKS in carbachol-evoked release is likely to be due to the phosphorylation of MARCKS following activation of PKC by the diacylglycerol (DAG) released due to activation of M3 muscarinic receptors. This phosphorylation also inhibits actin cross-linking (Hartwig et al., 1992) and is likely to lead to cortical actin disruption (Danks et al., 1999). Overexpression of MARCKS causes a reduction in depolarization-evoked NA release with no effect on carbachol-evoked release. It seems therefore that MARCKS overexpression inhibits the Ca2+ and calmodulin-mediated effects of MARCKS with no effect on the PKC-mediated effects. This also explains the absence of an effect of MARCKS overexpression on the TPA-enhanced, carbachol-evoked NA release (Fig. 7) despite the fact that TPA pretreatment would be expected to lead to a movement of vesicles to the plasma membrane (Danks et al., 1999).
In summary, overexpression of MARCKS causes a decrease in the potassium-evoked NA release to levels similar to those observed in response to carbachol. Carbachol-evoked release is unaffected. This is in agreement with a previous report that treatment of SH-SY5Y with potassium causes a movement of LDCVs towards the plasma membrane whereas carbachol treatment has no effect (Danks et al., 1999). Overexpression of MARCKS could lead to the formation of a more strongly cross-linked cortical actin barrier. This partially inhibits the cytoskeletal rearrangement and movement of LDCVs to the plasma membrane that occurs in response to depolarization. Thus, the LDCVs are prevented from reaching the sites of release resulting in reduced NA release in response to depolarization.
Acknowledgements
This work was supported by funding from the Biomed 2 Programme (Contract Number BMH4-CT96-1586), the British Heart Foundation and the Medical Research Council.
Abbreviations
-
- DAG
-
- diacylglycerol
-
- DβH
-
- dopamine β hydroxylase
-
- F-actin
-
- filamentous actin
-
- HBS
-
- HEPES-buffered saline
-
- LDCV
-
- large dense-cored vesicle
-
- MARCKS
-
- myristoylated alanine-rich C kinase substrate
-
- NA
-
- noradrenaline
-
- NET
-
- noradrenaline transporter
-
- NPY
-
- neuropeptide Y, PAGE, polyacrylamide gel electrophoresis
-
- PBS
-
- phosphate-buffered saline
-
- pCEP4/MARCKS
-
- pCEP4 with human MARCKS cDNA inserted in the sense orientation
-
- PKC
-
- protein kinase C
-
- SDS
-
- sodium dodecyl sulphate
-
- TPA
-
- 12-O-tetradecanoylphorbol 13-acetate
-
- UT
-
- untransfected
-
- VMAT-II
-
- vesicular monoamine transporter II.


