Effect of Dietary Monosodium Glutamate on HFCS-Induced Hepatic Steatosis: Expression Profiles in the Liver and Visceral Fat
Abstract
It has previously been shown that patients with nonalcoholic fatty liver disease (NAFLD) exhibit alterations in both hepatic and adipose tissue metabolism, and the dietary factors that contribute to the pathogenesis of NAFLD are likely to be multifactorial. Using C57BL/6J mice, we examined whether chronic exposure to low-dose dietary monosodium glutamate (MSG), high-fructose corn syrup (HFCS), or a combination of the two, vs. control would affect metabolism and hepatic and visceral fat gene expression in adult male progeny. A maternal diet containing 20% HFCS and/or dietary MSG (97.2 ± 6.3 mg/kg body weight (bw), provided in the drinking water) was offered ad libitum from 3 weeks before mating, and continued throughout gestation and weaning until the progeny reached 32 weeks of age. Liver and abdominal fat gene expression was compared with control animals fed isocaloric standard chow under identical conditions. HFCS induced hepatic steatosis and increased the expression of genes involved in carbohydrate and lipid metabolism. Conversely, dietary MSG elevated serum free fatty acids (FFAs), triglycerides (TGs), high-density lipoprotein-cholesterol (HDL-C), and insulin, together with the expression of hepatic genes involved in lipid metabolism and bile synthesis. The HFCS+MSG combination elevated hepatic TGs, serum FFAs, and TG levels. In visceral white adipose tissue, both MSG and HFCS diets increased the expression of transcription factor Srebf2 and decreased expression of Ppargc1a, while downregulating the expression of mitochondrial respiratory chain components. MSG increased the expression of several genes implicated in adipocytes differentiation. We hypothesize that HFCS may promote hepatic steatosis, whereas dietary MSG induces dyslipidemia and markers of insulin resistance.
Introduction
Nonalcoholic fatty liver disease (NAFLD) is the most common hepatic disorder of industrialized countries, affecting ∼20–30% of the general population (1). A proportion of patients develop nonalcoholic steatohepatitis, a more severe form of NAFLD, which is associated with obesity, insulin resistance (IR) (2), and mitochondrial dysfunction (3). IR is a common occurrence in obesity and type 2 diabetes, and can be induced experimentally by diets overrepresented by simple sugars (4). The increasing prevalence of NAFLD has previously been attributed in part to the growing trend toward the consumption of fructose (5). Free fructose ingestion (as a monosaccharide) increased by approximately fivefold from 1975 until the year 2000 (ref. 6) and the majority of this occurs in the form of high-fructose corn syrup (HFCS), a refined product of corn, which was introduced into the human diet from 1970 onward. HFCS and crystalline fructose consumption increases annually, and now accounts for a per capita average of 200 kcal/day (∼10% of total calorie intake) (7). We have previously demonstrated that dietary HFCS induces hepatic steatosis and mitochondrial disruption in vitro and in vivo (8); furthermore, HFCS consumption has also been shown to contribute to obesity and impaired insulin sensitivity in a rodent model of NAFLD induced by trans-fat feeding (9). In this clinically relevant model, the investigators established the validity of examining the contribution of several commonly consumed dietary risk factors toward the development of hepatic steatosis.
Obesity and IR can also be induced experimentally via ablation of the arcuate nucleus using neonatal administration of high dose(s) of the food flavor enhancer monosodium glutamate (MSG) (10,11,12). The mechanism for this is believed to involve glutamate-induced degeneration of those areas of the immature brain that are insufficiently protected by a mature blood–brain barrier, including regions that regulate feeding and satiety (11,12). Additionally, neonatal MSG administration has been shown to affect the metabolism of lipids, resulting in changes in fat distribution and thermogenesis in adulthood (13). In 1974, an acceptable daily intake for MSG was set at 0–120 mg/kg body weight (bw) (14), and in Europe, intake of this commonly consumed dietary ingredient is estimated as ∼30 mg/kg bw (15) although in some countries it could be as high as 143 mg/kg bw (16). In addition to promoting obesity and IR, recent data suggest that neonatal injections of MSG may cause hepatic microvesicular steatosis, inflammation, and dysplasia in adult mice (16). In this study, NAFLD-like pathology was apparent at 6 months of age, with indications that a more severe steatohepatitis, resembling human nonalcoholic steatohepatitis, was apparent at 12 months of age. Although the use of neonatal injections of MSG is an accepted approach to investigating the role of the arcuate nucleus in neuroendocrine regulation during postnatal development (17), fewer studies have addressed the effects of dietary MSG exposure in utero and during early development, despite its growing consumption as a common ingredient in many processed foods and fast-food meals. A previous study showed that prenatal exposure to dietary MSG via addition of 100 g MSG/kg (diet wt/wt) caused marked biochemical changes including hypercholesterolemia in the progeny of female rats fed the MSG diet for 3 weeks before mating and throughout the gestational and weaning period (18). Despite indications that neonatal exposure to dietary MSG might have deleterious effects on the progeny, no survivors from this study were retained in order to ascertain whether obesity occurred in the adulthood. Furthermore, in studies performed with neonatal MSG administration, few have addressed early changes in gene expression which might account for the adipose and hepatic tissue dysregulation in adulthood.
The aims of this study were to compare serum lipid and adipokine profile together with early changes in hepatic and visceral fat gene expression induced by HFCS with the same parameters in mice-fed standard chow plus low-dose dietary MSG. Third, we examined the effect of a combination of dietary HFCS and low-dose MSG, both commonly found in so-called fast-foods and processed foods. As it has previously been suggested that MSG excitotoxicity occurs only when the blood–brain barrier is vulnerable, for example neonatally (11,12), we studied C57BL/6J mice that had been bred and weaned from animals maintained on the respective diets for a 3-week run-in period before mating. To our knowledge, this is the first article to examine the effect of HFCS and MSG on hepatic and visceral adipose gene expression. Given the fact that HFCS and MSG are consumed in increasingly large amounts worldwide, it is hoped that our findings will provide insight into the mechanism of HFCS- and MSG-induced metabolic dysregulation.
Materials and Methods
Animals and diets
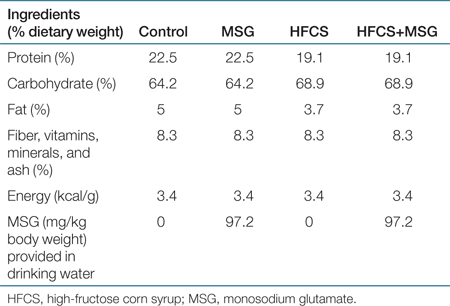
Female C57BL/6J mice were from The Jackson Laboratory (Bar Harbor, ME) and were housed/caged and fed a standard chow diet until 6 weeks of age immediately after which they were placed on one of four different dietary regimens for a period of 3 weeks before mating. Male breeder mice of similar age were fed a standard chow diet throughout, until being placed with the females for mating. Breeder males were removed from the cages upon first signs of pregnancy. The four isocaloric diets used in this study were: (i) ad lib standard chow (control diet) with ad lib drinking water; (ii) ad lib standard chow, with ad lib drinking water containing 0.64 g/l (97 mg/kg bw) MSG (MSG diet); (iii) ad lib Test Diet Purina 5001 with 20% HFCS (Diet 5B4K; Purina, Richmond, IN), and ad lib drinking water (HFCS diet); (iv) ad lib Diet 5B4K and ad lib drinking water containing 0.64 g/l (97 mg/kg bw) MSG (HFCS+MSG diet) (see Table 1 for diet composition). Following mating, the four groups of dams were maintained on their respective diets throughout the gestation and nursing period. Male offspring used in these experiments were weaned onto the same diets and maintained in this regimen until they reached either 16 or 32 weeks of age. Initial body weights were recorded at 6 weeks of age. Body weight and abdominal girth (measured by precision vernier caliper) was assessed at 6 and 32 weeks of age; average water intake and food consumption was assessed daily for 7 days at 6 weeks of age and again at 28–30 weeks of age, and food wastage was determined to be minimal. The breeding and care of the animals were in accordance with the protocols approved by the Animal Care and Use Committee of the King Faisal Specialist Hospital and Research Centre, and the “Principles of laboratory animal care” (NIH publication no. 85–23, revised 1985). 16- and 32-week old animals were killed by xylazine/ketamine intramuscular injection for blood and tissue collection. Harvested tissues were immediately snap-frozen and stored at −80 °C.
 |
Measurement of murine serum lipids, glucose, insulin, adiponectin, and leptin levels
Serum triglyceride (TG), total cholesterol, and high-density lipoprotein-cholesterol (HDL-C) concentrations were measured in overnight fasted 32-week-old mice 2 days before killing, (n = 20) using the Reflovert Plus instrument (Roche, Hoffmann-La Roche, Basel, Switzerland) according to the manufacturer's instructions. Similarly, overnight-fasting blood glucose was measured from tail-vein bleeding using the Ascensia Contour glucometer (Bayer HealthCare, Mishawaka, IN). Hormone measurements were taken at 32 weeks of age, using blood collected via cardiac puncture at the time of killing. Fasting serum insulin was measured using the ultrasensitive mouse insulin ELISA kit from Mercodia (Uppsala, Sweden), according to the manufacturer's instructions. Fasting serum leptin and adiponectin/Acrp30 were measured by enzyme-linked immunosorbent assay using commercial assay kits (MRP300 mouse Adiponectin/Acrp30, MOB00 mouse leptin; R&D Systems, Minneapolis, MN). Fasting serum retinol-binding protein-4 was measured using the Dual mouse/rat RBP4 ELISA kit (RB0642EK; AdipoGen, Seoul, Korea). Free fatty acids (FFAs) were measured in mouse serum using the Half Micro Test (Roche Diagnostics, Mannheim, Germany). Homeostasis model assessment of insulin resistance values, a measure of insulin resistance, were calculated according to the established formula: (fasting serum insulin, µIU/ml) × (fasting serum glucose, mmol/l)/22.5 (ref. 19).
Liver and adipose tissue histology
Formalin-fixed, paraffin-embedded liver and visceral fat tissue taken from retroperitoneal and inguinal deposits from four 32-week-old mice were processed and 4-µm thick serial sections were cut and stained with hematoxylin and eosin (HE) as described previously (20). For measurement of adipocyte cell areas, HE-stained micrograph images were converted to .TIFF files for analysis using the Discovery Series, Quantity One, 1-D Analysis software (Bio-Rad Laboratories, Hercules, CA).
Hepatic TG quantitation
Levels of mouse liver TG were quantified at 32 weeks of age from snap-frozen tissue using the Triglyceride Determination Kit TRO100 with appropriate TG standards (Sigma Aldrich, St Louis, MO) as described previously (8). Briefly, liver samples were first powdered under liquid nitrogen and the lipids extracted with chloroform:methanol (2:1, vol/vol). Results were expressed as mean TG (mg/g tissue) ± s.e.m., n = 6 per diet group.
RNA isolation
In order to detect early changes in gene expression, total RNA was prepared from the liver and visceral fat taken from four 16-week-old mice in the four different diet groups using Qiagen Rneasy Kit (Qiagen, Valencia, CA) according to the manufacturer's instructions, and stored at −80 °C. RNA quality was verified using a 2100 Bioanalyzer instrument and an RNA 6000 Nano LabChip assay (Agilent Technologies, Palo Alto, CA). RNA concentrations were determined by absorption at 260-nm wavelength with an ND-1000 spectrometer (Nanodrop Technologies, Wilmington, DE). Liver/adipose samples from four individual mice were pooled into two samples per diet group, giving a total of n = 4 applied onto two microarray chips.
Microarray hybridization
Gene expression in these samples was analyzed using GeneChipI Mouse Gene 1.0 ST array. We used a high-density oligonucleotide microarray (Affymetrix, Santa Clara, CA) representing 28,853 genes, with ∼27 probes spread across the full length of each transcript. Targets were prepared and microarrays were processed as described previously (20). Arrays were scanned using the Affymetrix 3000 7G scanner and GeneChip Operating software, version 1.4 to produce .CEL intensity files. This software also provided summary reports by which array QA metrics were evaluated including average background, average signal, and 3′/5′ expression ratios for spike-in controls, β-actin, and glyceraldehyde 3-phosphate dehydrogenase.
The complete data set of this study has been deposited at the European Bioinformatics Institute ArrayExpress repository (accession no. E-MEXP-1909).
Real-time RT-PCR
Confirmation of microarray results was performed using quantitative real-time reverse transcriptase-PCR (qRT-PCR) of genes randomly selected from the microarray list, on independently derived mRNAs from the livers of a different set of four 16-week old mice per diet group as described previously (20). Gene-specific primers corresponding to the PCR targets were designed using the primer 3 program. The following oligonucleotides were selected (F, forward; R, reverse): Cyp7a1 NM_007824: F 5′-ACACCATTCCTGCAACCTTC-3′, R 5′-GCTGTCCGGATATTCAAGGA-3′. Pdk4 NM_013743: F 5′-GCCTTGGGAGAAATGTGTGT-3′, R 5′-GAAGGCACTGGCTTTTTGAG-3′. Pdia4 NM_009787: F 5′-ATCGCCAAGATGGATGCTAC-3′, R 5′-CTTGGTCCTGCTCCTCTTTG-3′. Idh2 NM_173011: F 5′-GCCCGTGTGGAAGAGTTCAA-3′, R 5′-CGAAGCCCGAAATGGAC-3′. Ndufs4 NM_010887: F 5′-CGCAATAACATGCAGTCTGG-3′, R 5′-TTGCATCTTCTTTGGCACTG-3′. Preliminary real-time RT-PCR experiments were performed with each primer pair to determine the annealing temperature that yielded the greatest amount of specific product with melting temperature (Tm) separable from primer-dimer Tm. Standard curves were prepared for each run using known quantities of complementary DNA as described previously (20). Relative quantitation measurements were performed using external standard curves for both target and β-actin housekeeping gene. The second derivative maximum method was used for Ct calculation from amplification curves. The respective concentration for any given sample was calculated using crossing-cycle analysis provided by the LightCycler software (Roche).
Statistics
Data analysis and statistics for gene expression profiling were performed with the Partek genomic suite software suite 6.3 (Partek, St Louis, MO). Probe set data were summarized, background adjusted, and quantile normalized using Robust Multichip Average methodology described in Irizarry et al. (21), as described previously (20). A false discovery rate correction was applied to post hoc pairwise group comparisons of Pearson's correlation coefficients obtained by ANOVA. P ≤ 0.05 was considered significant, with an arbitrary threshold of 1.2-fold difference between the four diet groups analyzed simultaneously. As the mRNA expression in four animals from each of the four diet groups was separately analyzed, four comparisons were possible when comparing the effects of HFCS-diet animals with respect to controls receiving standard chow, and the effect of the addition of MSG to both diets. Genes fulfilling the Affymetrix quality criteria for significant expression were considered to be differentially expressed between the four diet groups when the expression levels were concordantly increased or decreased in all four comparisons. Real-time RT-PCR values for each target gene were calculated as a ratio of target gene expression level to the β-actin expression level in the same specimen. For concordance comparisons with the microarray data these values were then expressed as mean percentage ± s.e.m. of real-time RT-PCR levels in the control diet group. P values of <0.05 were considered statistically significant. Pearson correlation coefficients between the microarray data and the qRT-PCR were calculated. A value of 1 is indicative of a perfect correlation.
One-way ANOVA with Tukey's post hoc test was used for all analysis of serum lipids and adipokines, together with anthropological measurements and food/water intake.
Results
Serum hormone and lipid profile
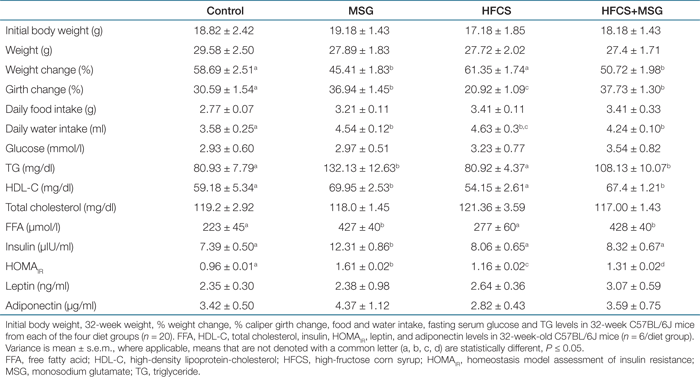
Averaged daily MSG intake in the MSG and HFCS+MSG groups was 97.2 ± 6.3 mg/kg bw. Abdominal girth, a marker of visceral adiposity, was modestly increased in both MSG and HFCS+MSG groups (Table 2, P ≤ 0.001, n = 20), with a maximum girth increase of 37.7 ± 1.3 % obtained in the HFCS+MSG diet group, compared to 30.59 ± 1.54% in controls. Dietary MSG, in the absence of any significant additional caloric intake, resulted in the highest levels of serum TG, insulin, and homeostasis model assessment of insulin resistance values (Table 2, P ≤ 0.05). FFA levels were elevated in both the MSG-containing diets (P ≤ 0.05). A combination of HFCS+MSG led to elevated TG, FFA, and homeostasis model assessment of insulin resistance levels compared to control (P ≤ 0.05). Serum leptin and adiponectin levels were not affected by either diet.
 |
Liver histology and TG content
HE staining of liver sections taken from 32-week-old animals showed increased content of hepatic microvesicular structures in both MSG and HFCS-treated mice compared to control (1). Quantitation of intrahepatic TG levels (1) indicated that HFCS induced a twofold increase in hepatic lipid content (P ≤ 0.01, n = 6), whereas the TG levels in the HFCS+MSG group mice increased by 1.6 ± 0.1-fold above control.
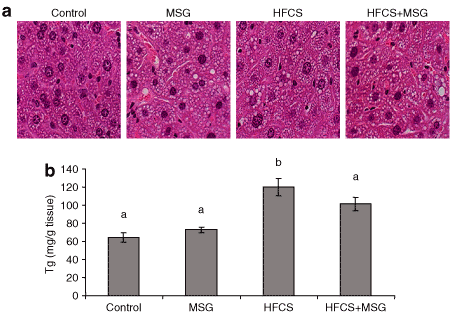
Liver histology and TG quantitation. (a) Microvesicular steatosis in hematoxylin and eosin (HE)–stained liver sections from mice on the MSG, HFCS, and HFCS+MSG diets at 32 weeks, compared to control. Scale is ×760 (n = 4/diet group). (b) Quantitation of hepatic TG levels. Results are average TG/mg tissue ± s.e.m. (n = 6/diet group; means that are not denoted with a common letter (a, b) are statistically different, P ≤ 0.01). HFCS, high-fructose corn syrup; MSG, monosodium glutamate; TG, triglyceride.
Hepatic gene expression
In order to detect early changes in gene expression that may account for the dyslipidemia and hepatic steatosis seen at 32 weeks, total RNA samples were isolated from liver tissue obtained from four individual 16-week-old mice per diet group and pooled for applying onto two individual Affymetrix Mouse Genome 1.0 ST Array Expression Set GeneChips. 2 shows the heat map and gene ontology clustering of genes differentially expressed within the four diet groups (P ≤ 0.05). The greatest effect on hepatic gene expression was seen in mice from the HFCS-diet groups, where the expression of genes involved in carbohydrate and lipid metabolism, including a number of oxidoreductase genes were upregulated (Table 3, P ≤ 0.05). Expression of mitochondrial pyruvate dehydrogenase complex component X was increased 2.2-fold, together with a twofold increase in fructose-metabolizing aldehyde dehydrogenase and a 1.3-fold increase in fructose 2,6-bisphosphatase, a regulator of gluconeogenesis and glycolysis. Steroid- and fatty acid–metabolizing enzymes from the cyp450 family were upregulated by HFCS, including the oxidoreductases Cyp2b9 and Cyp2b10 (18.3- and 13.6-fold, respectively). Levels of other oxidoreductases arachidonate lipoxygenase-3 (Alox3) and arachidonate 8-lipoxygenase (Alox8), involved in inflammatory lipid metabolism, were increased by HFCS (1.54- and 1.47-fold, respectively). Additionally, the HFCS diet induced the expression of a number of inflammatory mediators including tumor necrosis factor and interleukin-1 (Il1f5: 1.98- and 1.58-fold, respectively). Endoplasmic reticulum stress-associated protein disulfide isomerase (Pdia4) was increased 1.6-fold. Levels of genes involved in the apoptotic pathway including G0s2, the G0/G1 switch gene (3.13-fold), and Tnfrsf10b (Death Receptor 5; 1.3-fold) were also found to be upregulated in the HFCS-diet group.
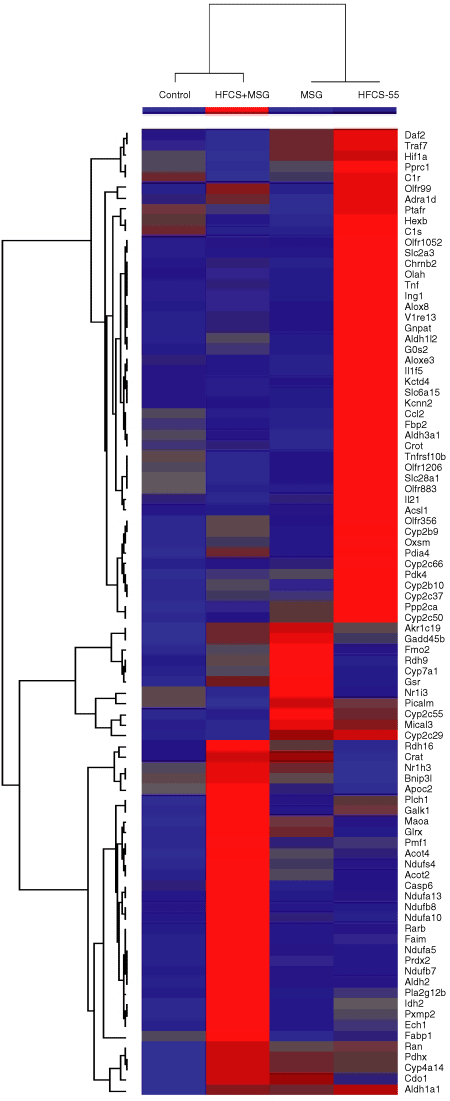
Liver expression heat map and gene ontology clustering of genes with significant differences in expression within the four diet groups (P ≤ 0.05). Red pseudocolor represents upregulation and blue is downregulation, with an arbitrary cutoff point of 1.2-fold.
 |
In addition to elevated serum FFA, TG, and HDL-C induced by MSG, we found complimentary differences in the ontology of hepatic genes upregulated by the MSG diet; including genes involved in hepatic cholesterol metabolism and the reverse cholesterol transport pathway. MSG induced a 2.53-fold increase in hepatic bile acid regulatory protein cholesterol 7 α-hydroxylase (cyp7a1), a 1.91-fold decrease in the cholesterol-responsive transporter molecule ABCA8a, and a 1.23-fold increase in the nuclear hormone receptor constitutive androstane receptor (CAR; Table 3, P < 0.05).Expression of the DNA damage marker GADD45b (growth arrest and DNA damage 45b) was increased by 2.74-fold in the livers of MSG-treated mice.
Combined MSG and HFCS treatment had converse effects on the expression of a number of genes including those involved in carbohydrate metabolism and several oxidoreductases such as arachidonate lipoxygenases, Cyp2b and Cyp2c members (2, Table 3). The expression of hepatic genes with mitochondrial respiratory chain function were synergistically enhanced by the diet combination of HFCS and MSG, including Ndufa5, Ndufa8, Ndufa13, and Ndufs4. In composite, these results suggest that whereas HFCS diets induce the expression of genes involved in carbohydrate and lipid metabolism, MSG diets upregulated the expression of genes involved in lipid metabolism and cholesterol excretion via bile acid synthesis.
Confirmation of Affymetrix microarray by qRT-PCR
A set of five genes were randomly selected for validation using real-time qRT-PCR with mRNA independently derived from mice different from those used for the microarray study (n = 4/diet group). 3 shows qRT-PCR of cytochrome P450, family 7, subfamily a, polypeptide 1 (cyp7a1, NM_007824), pyruvate dehydrogenase kinase, isoenzyme 4 (pdk4, NM_013743), protein disulfide isomerase–associated 4 (pdia4, NM_009787); isocitrate dehydrogenase 2 (NADP+), mitochondrial (Idh2, NM_173011), NADH dehydrogenase (ubiquinone) Fe–S protein 4 (Ndufs4, NM_010887) levels relative to housekeeping β-actin levels in mice from the four different diet groups (n = 4, P < 0.05). 3 shows representative ethidium bromide stained RT-PCR products electrophoresed on 2% agarose gels. 3 shows concordance of qRT-PCR results vs. microarray results expressed as signal intensity (% control diet ± 1SD). Pearson correlation coefficients are indicated on each graph. Individual values for r were Cyp7a1: r = 0.97; PDK: r = 0.96; Pdia4: r = 0.89; IDH2: r = 0.99; and Ndusf4: r = 0.6.
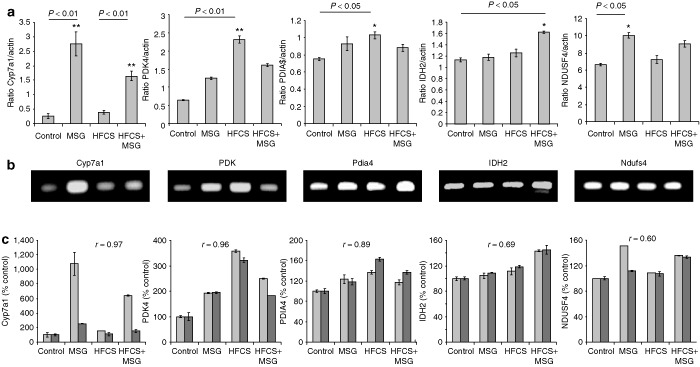
Validation of Affymetrix microarray analysis of gene expression using quantitative real-time PCR (qRT-PCR). (a) qRT-PCR of Cyp7a1, PDK4, PDIA4, IDH2, and Ndufs4 ratios compared to β-actin levels, from 16-week-old mouse liver mRNA from the four different diet groups (Control, MSG, HFCS, and HFCS+MSG). (b) PCR products run on 2% agarose gel and stained with ethidium bromide. (c) Concordance of qRT-PCR (light bars) vs. microarray data (dark bars) for Cyp7a1, PDK4, PDIA4, IDH2, and Ndufs4 (signal intensity expressed as a percentage of control ± 1SD, n = 3/diet group). Pearson correlation coefficients are indicated for each bar chart. Results are representative of a minimum of two separate qRT-PCR experiments performed in triplicate. MSG, monosodium glutamate; HFCS, high-fructose corn syrup.
Altered visceral fat gene expression induced by MSG and HFCS
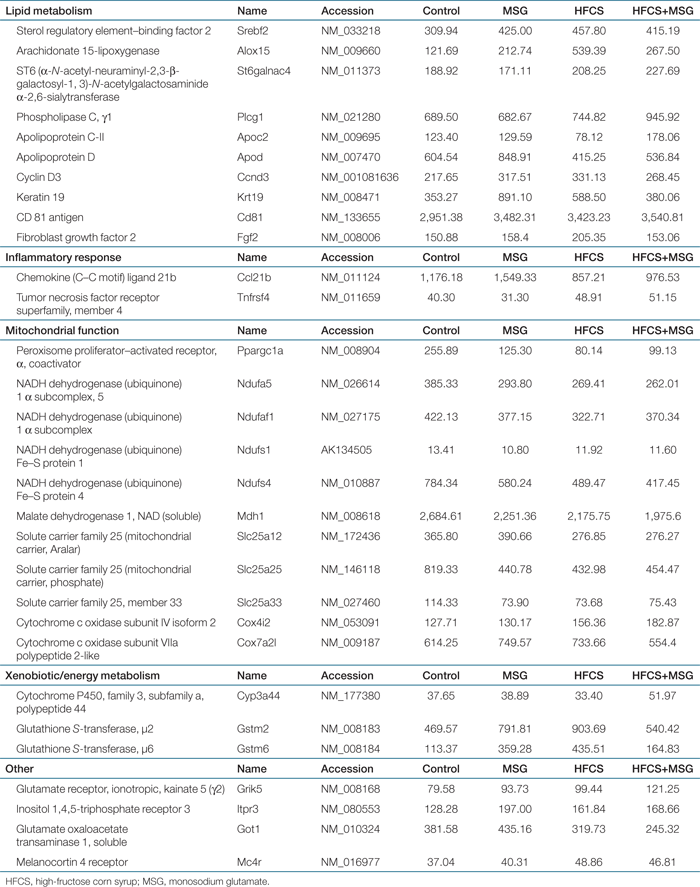
As dietary MSG induced dyspipidemia in our animal model, we next investigated visceral fat distribution, histology and gene expression in response to the four diets. 4 shows abdominal adiposity in 32-week-old mice. Changes in abdominal girth at 32 weeks compared to 6 weeks in MSG, HFCS, and HFCS+MSG diet groups compared to control is shown in 4, and 4 shows micrographs of retroperitoneal and inguinal fat tissue stained with HE, in order to demonstrate increase in adipocyte size in visceral fat from MSG, HFCS, and HFCS+MSG diet groups compared to control. 4 indicates quantitation of averaged adipocyte area. The mean adipocyte area was higher in visceral fat from animals in all three diet groups compared to control, with the MSG diets increased adipocyte volume by up to 160% (P ≤ 0.001). Affymetrix Microarray analysis of visceral fat genes with expression levels that were significantly different within the four diet groups is shown in Table 4 (P < 0.05). Levels of sterol regulatory element–binding factor 2 (Srebp2), a transcription factor controlling lipid, and cholesterol homeostasis (22) was significantly increased in visceral fat from all three diet groups compared to control. The transcription coactivator Ppargc1a was decreased by up to threefold in visceral fat from HFCS-treated mice and twofold in MSG-treated animals. Expression of inflammatory arachidonate lipoxygenase-15 was increased by both MSG, HFCS, and MSG+HFCS diets (1.8-, 4.5-, and 2.2-fold, respectively). Keratin-19, a marker of visceral mesothelial cells, was upregulated 2.5-fold by MSG, and cyclin D3 expression was elevated (Table 4), suggesting an increase in visceral adipocyte differentiation. Expression of cytoprotective glutathione S-transferases Gstm2 and Gstm6 were also increased by both MSG- and HFCS-containing diets.
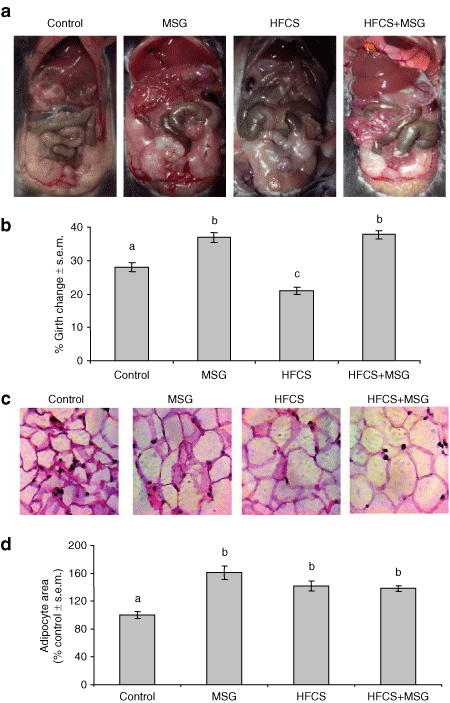
Diet-induced changes in visceral flat accumulation. (a) Visceral fat deposition in control, MSG, HFCS, and HFCS+MSG treated mice at 32 weeks. (b) changes in abdominal girth measurement (6–32 weeks; mean ± s.e.m., n = 20). Different letters (a, b, c) denote significant differences in mean adipocytes area between the four diet groups, P ≤ 0.001. (c) Histological examination of 32-week visceral adipose tissues (combined retroperitoneal and ingual depots) using HE staining. Results are representative of four separate experiments. (d) Quantitation of changes in adipocyte area. The data are expressed as the means ± s.e.m. of at least 70 cells quantified in duplicate from four animals per diet group. Different letters (a, b) denote significant differences in mean adipocytes area between the four diet groups, P ≤ 0.001. HE, hematoxylin and eosin; HFCS, high-fructose corn syrup; MSG, monosodium glutamate.
 |
Discussion
Patients with NAFLD and diabetes exhibit changes in both hepatic and lipid metabolism (23); however, the contribution of visceral fat to hepatic steatosis remains to be fully evaluated. Abdominal obesity is a risk factor for NAFLD (1,2,3), and although surgical weight-loss strategies have been reported to improve liver function (24), hepatic steatosis can also exist in the nonobese (25,26). NAFLD appears to be the result of an imbalance between the uptake, synthesis, export, and oxidation of fatty acids (23). Although the development of hepatic insulin resistance can be viewed in part as a metabolic consequence of deregulation between liver and adipose tissue (27), changes in adipokine levels are likely to contribute. In this article, we have employed an animal model in which dietary fructose in the form of HFCS was used to increase the hepatic TG content without increasing abdominal adiposity or serum lipids. We looked at early changes in hepatic and visceral fat gene expression, which might account for the increased hepatic steatosis, and compared these with gene expression induced by dietary MSG, which in our model induced dyslipidemia together with markers of insulin resistance. Lastly, we examined the effects of a combination of MSG and HFCS, which enhanced visceral adiposity and increased serum and hepatic lipids. Several studies have shown that extreme amounts of dietary fructose may cause hepatic steatosis (28,29); however, in this study, we have compared the effects of a standard chow diet with an isocaloric diet in which only 20% of the carbohydrate is in the form of HFCS, as it is known from a recent survey of Americans aged ≥2 years, that adolescents averaged 20% of energy intake from added sweeteners (30). Similarly, although it has been known since the 1970s that in rodents, neonatal injections of MSG leads to obesity (10,11,12) and liver damage (16) in adulthood, very few studies have been performed using low-dose dietary MSG similar to today's consumption levels. The oral dosage of MSG used throughout this study is unusual in that it is 30–40 times lower than the injected dose that were used to induce obesity in other rodent models (10,11,12). To our knowledge, this is the first article to report on the effects of HFCS and/or dietary MSG on hepatic and visceral fat gene expression.
Under these conditions, the HFCS diet caused a doubling of the hepatic TG content, whereas serum lipid levels and abdominal girth were not increased during the time-course of the experiment. Hepatic microarray analysis indicated that the expression of genes relating to fructose and glucose metabolism, including aldehyde dehydrogenase and fructose bisphosphatase-2 (Fbp2), a key enzyme contributing to the increased rate of glycolysis in insulin-resistant Zucker fa/fa rats (31), were significantly increased in HFCS-treated animals compared to control. Aldehyde dehydrogenase is an enzyme involved in the conversion of fructose into pyruvate, providing acetyl CoA molecules that serve as substrates for the Krebs cycle. Pyruvate can also be a substrate for hepatic lipogenesis (32), which may account for the increase in hepatic TG seen in our HFCS-treated animals. HFCS also upregulated the expression of several oxidoreductase Cyp450 genes, together with genes involved in arachidonic acid metabolism and the inflammatory response. Cyp450s are heme-containing membrane-bound enzymes that metabolize steroids and fatty acids, in addition to detoxifying foreign compounds including a number of drugs and environmental chemicals (33). Increased hepatic Cyp2b mRNA levels have been shown to be elevated in diabetes and high-fat feeding (34), and in mice treated with the peroxisome proliferator-activated receptor-α agonist Wy-14,643 (ref. 35).
Lipids enter the liver by a combination of facilitated uptake and passive diffusion, immediately after which they either undergo oxidation and esterification into TG (36) or excretion in bile acids. The movement of cholesterol from HDLs into bile for excretion is facilitated by Cyp7a1, a key protein in the classical pathway of bile acid synthesis (37). In this study, MSG elevated serum FFA, TG, and HDL-C levels, whereas the expression of hepatic Cyp7a1 was more than double that of control, suggesting that in the absence of other contributory factors such as increased dietary intake, MSG might activate the reverse cholesterol transport pathway in response to increased serum cholesterol. Fasting serum insulin levels were raised in MSG-treated mice, but leptin and adiponectin levels were unaffected by diet, in contrast to studies where neonatal injections of MSG result in marked hyperinsulinemia and hyperleptinemia as a result of hypothalamic damage (12). In the liver, MSG also upregulated the expression of CAR, a nuclear receptor originally characterized as a transcription factor regulating hepatic xenobiotic metabolism, but now known to play a critical role in modulating hepatic bile acids and cholesterol (38). Despite the fact that the livers from MSG-treated mice contained only slightly elevated TG levels compared to HFCS-treated mice, histological examination of HE-stained sections from both MSG- and HFCS-treated mice showed increased microvesicular structures previously associated with mitochondrial disruption (39,40), and with neonatally injected MSG (16). The addition of MSG to the HFCS diet resulted in similar levels of hepatic TG to that induced by HFCS alone, but this combination also increased abdominal girth, serum TG, FFA, and insulin levels, unlike HFCS alone. The molecular mechanism for this remains to be elucidated. Microarray analysis of genes affected by the HFCS+MSG combination showed that genes with mitochondrial respiratory chain function were synergistically enhanced, whereas we found decreased expression of several oxidoreductases such as arachidonate lipoxygenases, Cyp2b and Cyp2c members. The increase in de novo lipid synthesis induced by the combination of MSG and HFCS is likely to be a product of increased expression of lipid synthesis genes.
Analysis of visceral fat gene expression indicated that MSG increased the expression of genes previously associated with omental adipose tissue lipid metabolism in polycystic ovarian syndrome patients (41) including glutathione S-transferase and arachidonate lipoxygenase-15. Genes involved in adipocytes differentiation, for example keratin-19, a marker of visceral mesothelial cells (42), and apoD, associated with insulin resistance and altered lipid metabolism in a recent transgenic model (43) were also upregulated. Both MSG and HFCS diets resulted in decreased expression of Ppargc1a compared to control. Ppargc1a is a master regulator of mitochondrial genes and its expression is decreased and associated with impaired oxidative phosphorylation in muscle from type 2 diabetic patients (44). HFCS diets also increased the expression of several lipogenic genes, and in many cases these were enhanced in the HFCS+MSG diet compared to either component alone.
Our data therefore suggest that dietary HFCS causes an increase in the TG content of the liver by a mechanism, which may include the upregulation of genes involved in carbohydrate and lipid metabolism. In the adipose tissue, HFCS increased the expression of lipogenic genes and reduced the expression of key transcription coactivator Ppargc1a, which may lead to altered fat oxidation. Conversely MSG, in the absence of additional calorie intake, appeared to elevate serum lipids without increasing the hepatic TG content. Genes involved in bile acid metabolism were activated in the liver, together with changes in the expression of genes involved in visceral fat lipid metabolism and adipocytes differentiation.
It has previously been established that neonatal injections of MSG causes glutamate-induced excitotoxicity in regions of the brain that are not protected sufficiently by the blood–brain barrier (11,12). Damage to this area, which includes the arcuate nucleus and regions associated neuroendocrine development, causes an obese phenotype in adulthood (11,12,16). One possible explanation for the phenotype that we noted in our mice with long-term MSG exposure is that under these conditions, dietary MSG caused a similar, though possibly less extensive dysregulation to the brain hypothalamic regions, despite an apparent lack of hyperlentinemia detectable in these 32-week-old mice, at the point where our study concluded. In view of reports that neonatal injections of MSG caused murine steatohepatitis in adult mice aged 12 months (16), and that obesity may be associated with dietary MSG consumption in a Chinese population (45), it would be interesting to see whether there are further changes in liver and adipose tissue phenotype following longer exposure to dietary MSG, or a higher dosage, in our animal model. Likewise, it would be interesting to see whether longer exposure to HFCS contributes to adiposity as reported in a trans-fat model of NAFLD (9).
In summary, we have examined the profile of hepatic and adipose tissue gene expression in response to HFCS and/or MSG. MSG-containing diets elevated serum FFA, TG, HDL-C, and insulin levels, but hepatic TG levels were not significantly increased. MSG also increased the expression of hepatic genes involved in bile synthesis and the reverse cholesterol transport pathway. The addition of MSG to the HFCS diet resulted in similar levels of hepatic TG to that induced by HFCS alone, together with increased abdominal girth, serum TG, FFA, and insulin levels. In the visceral fat, MSG and HFCS induced the expression of lipogenic genes, and reduced the expression of mitochondrial oxidative transcription factor Ppargc1a and mitochondrial respiratory chain 1 components. The genes identified in this model may provide clues as to the mechanism of HFCS and MSG-induced metabolic disturbance occasioned by these commonly consumed dietary ingredients.
Acknowledgments
We thank Rhea Mondreal and Mohammed Al-Halaby for technical assistance. Thanks to the Comparative Medicine Department, KFSH&RC for animal husbandry; the Biological Repository Centre at KFSH&RC for histology work, and our gratitude goes to Mr Hakim Al-Enazi for his unparalleled help in coordinating research resources. This work was supported by funding from RAC project #2070 006.
Disclosure
The authors declared no conflict of interest.


