Body Composition, Insulin Sensitivity, and Cardiovascular Disease Profile in Healthy Europeans
Abstract
Objective: To assess whether insulin sensitivity can explain the associations of leg-fat mass (LFM) and trunk-fat mass (TFM) with the cardiovascular disease (CVD) risk profile in healthy European men and women.
Methods and Procedures: We studied 142 healthy men and women of a multicenter European study on insulin sensitivity, aged 30–60 years, from the centres in Hoorn, the Netherlands and Rome, Italy. Whole-body dual-energy X-ray absorptiometry (DXA) was used to determine fat and lean soft tissue mass in the trunk and legs. Fasting glucose, insulin, and lipid levels were measured. Insulin sensitivity (M/I-ratio) was measured during a euglycemic-hyperinsulinemic clamp. Associations between fat distribution and CVD risk factors were studied with linear regression analyses with adjustment for other body compartments, and subsequent adjustment for insulin sensitivity.
Results: In men, larger LFM was significantly and independently associated with lower triglyceride levels (TGs) and higher high-density lipoprotein (HDL) cholesterol (P < 0.10) and tended to be associated also with lower low-density lipoprotein (LDL) cholesterol, and lower fasting insulin levels. In women, larger LFM was associated with favorable values of all CVD risk factors, although the associations were not statistically significant. In both sexes, larger TFM was independently and significantly associated with unfavorable values of most CVD risk factors, and most associations did not markedly change after adjustment for insulin sensitivity.
Discussion: In a relatively young and healthy European population, larger LFM is associated with a lower and TFM with a higher cardiovascular and metabolic risk, which can not be explained by insulin sensitivity.
Introduction
Obesity is a well-known risk factor for both type 2 diabetes (DM2) and cardiovascular disease (CVD). More in particular, the distribution of body fat is associated with the risk of DM2 and components of the metabolic syndrome (MS). Insulin resistance (IR) is thought to be a key player in the association between fat distribution and the development of dyslipidemia, CVD, and DM2 in adult humans (1) and even in children and adolescents (2).
Waist and hip circumference, as estimates of fat distribution have been shown to have independent and opposite associations with glucose levels, dyslipidemia, IR, and DM2 (3,4). Recent studies showed that large hip circumferences were associated with lower risk of total mortality, cardiovascular mortality and morbidity, and CVD risk factors independently of waist circumference (3,4,5,6,7,8). Leg-fat correlates inversely with coronary atherosclerosis (9). Furthermore, trunk and leg fat have independent and opposite associations with fasting and postload glucose and IR in elderly populations (10) and have been shown to relate to CVD risk factors in the same way in Japanese (11) and white populations (4,12).
In obese male subjects the relationship between lower body fat mass and a more favorable blood lipid profile persisted after adjustment for insulin sensitivity (13). However, it is not known whether these relationships are present in healthy white men and women and, if present, whether they can be explained by underlying differences in insulin sensitivity. In the present study, we used the gold standard technique, that is, the hyperinsulinemic-euglycemic clamp, to investigate to what extent insulin sensitivity can explain the associations between body composition and CVD risk factors in healthy persons.
Methods and Procedures
Study population
The RISC (relationship between Insulin sensitivity and CVD risk) study is a prospective, observational, multicenter cohort study whose rationale and methodology have been published previously (14). Briefly, participants were randomly recruited, from local populations of the participating countries. Participants were clinically healthy and aged between 30 and 60 years. Those with a history of cardiovascular, pulmonary, kidney, or malignant disease were excluded as well as those currently taking medications. After clinical examinations those with hypertension, diabetes, hypercholesterolemia, hypertriglyceridemia, and electrocardiogram abnormalities were also excluded (14). The population was stratified by sex and age according to 10-year age groups. Baseline examinations began in June 2002 and were completed in July 2005. The present analysis is based on the cross-sectional baseline data of 80 Dutch and 62 Italian participants of the RISC study, who satisfied all the inclusion criteria, had a hyperinsulinemic-euglycemic clamp study (clamp) of high quality and who underwent a dual-energy X-ray absorptiometry (DXA) scan.
Ethical considerations
The study protocol was approved by the Ethical Review Committee of the VU University Medical Centre in Amsterdam and Istituto di Medicina Interna e Geriatria, Policlinico A Gemelli in Rome. All participants gave their written informed consent.
Lifestyle and medical history questionnaire
Information about participants and their partners' personal medical history and family history of CVD, stroke, hypertension and diabetes, smoking, alcohol habits was collected. Physical activity was measured with the 7-day International Physical activity Questionnaire (15). All medication was recorded. A modified version of the Rose questionnaire (16) and the Edinburgh claudication questionnaire (17) were used for exclusion of prevalent CVD. The lifestyle questionnaire was prepared in English, translated into the two languages of the study and back-translated into English to ensure homogeneity.
Physical examinations
Height was measured on a clinic stadiometer. Body weight and fat-free mass were evaluated by the TANITA bioimpedance balance (Tanita International Division, Middlesex, UK); waist, hip, and thigh circumferences were measured by tape measure according to a standardized written protocol. BMI was calculated by weight divided by height squared (kg/m2). Sitting blood pressure and heart rate (OMRON 705 cp; OMRON Healthcare Europe, Veghel, the Netherlands) were measured 3 times over 10 min; the median value was used in the statistical analysis.
Oral glucose-tolerance tests
Fasting blood samples were taken before and during a 75-g oral glucose-tolerance test at 0, 30, 60, 90, and 120 min. Samples were transported on dry ice at prearranged intervals to central laboratories (14).
Clamp
On a separate day within one week after the oral glucose-tolerance test, a euglycemic hyperinsulinemic clamp was performed in all subjects. Exogenous insulin was administered as a primed continuous infusion at a rate of 240 pmol·min−1·m−2 simultaneously with a 20% dextrose infusion, adjusted every 5–10 min to maintain plasma glucose levels within 0.8 mmol/l (±15%) of the target glucose level (4.5–5.5 mmol/l). The steady-state period (for calculation of insulin sensitivity) was between 80 and 120 min. Additional blood samples were obtained at 20-min intervals for insulin and nonesterified fatty acid determination. The clamp procedure was standardized across centers by means of a demonstration video and ad hoc operating instructions. The crude data from each clamp were immediately transferred to the coordinating center where they underwent quality-control scrutiny according to preset criteria. Insulin sensitivity was expressed as the ratio of the M-value (18) averaged over the final 40 min of the 2-h clamp to the mean plasma insulin concentration measured during the same interval (M/I, in units of µmol·min−1·kgffm−1 nm−1). The M value was first normalized by fat-free mass (measured by TANITA bio-impedance balance), given that glucose uptake can only occur in cell mass (includes metabolically active part of adipose tissue) (18). The normalization by insulin level adjusts for minor differences in clamp insulin levels, given that within the physiological range, plasma insulin level is proportional to whole-body glucose disposal (18). The glucose and insulin areas under the curve were calculated by means of the trapezium rule (19).
Lab assays
Fasting plasma glucose was analyzed using the Cobas integra system (Roche diagnostics, Basel, Switzerland). Fasting serum insulin concentrations were measured using solid-phase, two-site fluoro-immuno-metric assays (Auto DELFIA Insulin kit; Wallac Oy, Turku, Finland). Serum high-density lipoprotein cholesterol (HDL), low-density lipoprotein cholesterol (LDL), and triglyceride levels (TGs) were analyzed with homogenous enzymatic colorimetric tests for modular analyzers (Roche diagnostics, Basel, Switzerland). Serum nonesterified fatty acids were determined with an enzymatic colorimetric kit for modular (Randox, Crumlin, UK)
Body composition
Whole-body DXA was performed using the fan-beam technology (QDR-2000, software version 7.20D; Hologic, Brussels, Belgium). The software provides estimates of lean tissue mass, fat mass, and bone mineral mass for the total body, and for standard body regions (1). With the use of specific anatomic landmarks, regions of the head, trunk, arms, and legs were distinguished (10). In the present analyses, we studied fat and lean soft tissue mass from the trunk and legs.
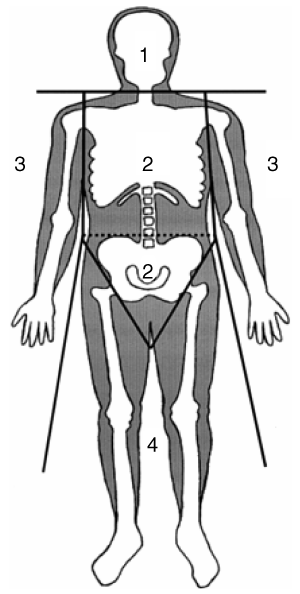
Standard regions of a dual-energy X-ray absorptiometry scan: 1, head; 2, trunk; 3, arms; 4, legs.
Statistical analyses
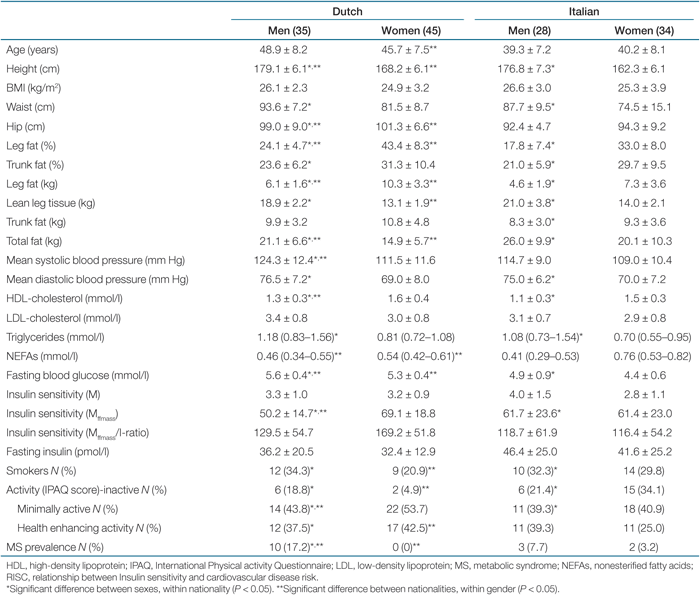
In Table 1, clinical characteristics of 142 subjects are presented as means with standard deviations in categories of nationality and sex; for skewed data, the medians and inter-quartile ranges are shown. Age-adjusted ANOVA was performed to assess whether the differences between the groups (according to sex and nationality) were significant.
 |
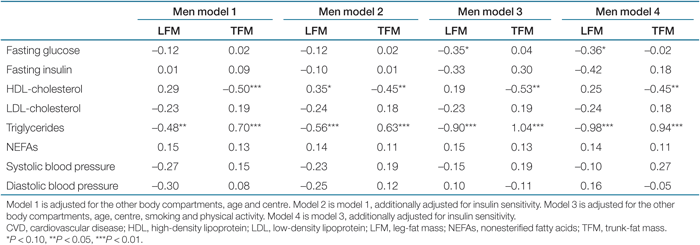
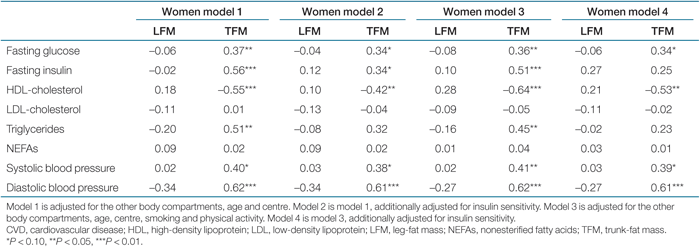
Linear regression analysis was used to examine the relationships between body composition measures and CVD risk factors (Tables 2 and 3). Associations did not change after adjustment for menopause, and there was no interaction. Therefore, we did not adjust for menopause in the models. Due to differences in body composition, all models were presented separately for men and women. To facilitate direct comparisons, results are reported as standardized β. A standardized β of 0.1 indicates that when the independent variable increases by 1 s.d., the dependent variable increases by 0.1 s.d. A P value <0.05 (two-tailed) was considered statistically significant. Regression models were checked for colinearity. A tolerance of <0.1 or a variance-inflation factor of >10 were considered as indications of colinearity. Statistical analyses were performed with SPSS for Windows version 12.0.2 (SPSS, Chicago, IL).
 |
 |
Results
The clinical characteristics of the subjects are shown in Table 1. When compared with women, men were about the same age, but the subjects of Rome were younger in general. Italian women had relatively low mean insulin sensitivity compared to Italian men (not statistically different), and they had a larger proportion of physical inactivity (statistically significant).
Although there was a low prevalence of the MS (20) (Table 1), larger leg fat was associated with a lower prevalence of the MS (statistically not significant), whereas the association of larger trunk-fat mass (TFM) with a higher prevalence of the MS was statistically significant (data not shown).
In men, larger leg-fat mass (LFM) was significantly associated with lower TGs, independent of other body compartments. The association became a bit stronger after adjustment for insulin sensitivity (Table 2). Although not statistically significant, larger LFM was also associated with lower fasting plasma glucose and blood-pressure levels and with higher HDL (P < 0.10). Larger TFM was significantly associated with higher TGs and with lower HDL. These associations did not markedly change after adjustment for insulin sensitivity.
In women (Table 3), larger LFM was associated with more favorable HDL, LDL and TGs, although not statistically significant. These associations did not markedly change after adjustment for insulin sensitivity. Larger TFM was significantly associated with higher fasting plasma glucose, fasting insulin and TGs, higher systolic and diastolic blood pressure, and lower HDL. These associations did not markedly change after adjustment for insulin sensitivity, except for TGs, which association with trunk fat became statistically nonsignificant. Adjustment for height did not change any of the associations above (data not shown), and there was no interaction with nationality.
Discussion
Although this study is limited due to a small sample, it still yields interesting observations. The present study in healthy subjects confirms the known associations of leg and trunk fat with glucose and lipid concentrations. To our knowledge, we are the first to show that these associations are not explained by whole-body insulin sensitivity, when measured with the euglycemic-clamp technique. These findings are in agreement with previous studies which used alternate measures of body composition (3,4,5,6,7,8,9), or the DXA scan (8,9,10,11). Most of these previous studies were in elderly populations, or in elderly and obese populations. Only one recent study in Japanese men and women (11) reported similar findings in the young and the old (aged 20–79 years). Buemann et al. (13) found similar results in male obese subjects, when they used the Matsudas index to estimate the level of whole-body insulin sensitivity (the Matsudas index is calculated from plasma glucose and serum insulin levels, measured during an oral glucose-tolerance test and corresponds relatively well with the euglycemic clamp (21)). The unfavorable associations between trunk fat and CVD risk factors were also present and consistent among sexes in our study. Again, these associations could not be explained by the level of insulin sensitivity. Normalization of insulin sensitivity for fat-free mass is still under debate. To evaluate the possible differences between the different methods (the normalization of the M value for fat mass (Mffmass) or the correction for insulin level (Mffmass/I-ratio)), we repeated analyses with uncorrected M values and M/I ratios (data not shown). These analyses showed that the strength and the direction of the found associations remained unchanged and were, therefore, virtually independent of the used corrections, for fat-free mass or for steady-state insulin level.
Study limitations
DXA cannot discriminate between different fat depots. It is, therefore, not possible to draw conclusions from the present study with regard to the difference in associations between subcutaneous leg fat and CVD risk factors or between intra-or inter-muscular leg fat and CVD risk factors. However, in the lean subjects, total leg fat in the thigh measured by DXA represents almost exclusively subcutaneous leg fat (90% subcutaneous, 8% subfascial, and 2% intermuscular) (22), in contrast to total fat in the trunk which is 35–40% visceral fat and 60–65% subcutaneous fat (23,24). The present analyses is based on cross-sectional data, and it is not known whether the same results will be found when this group is studied prospectively.
Body composition and CVD risk factors
Snijder et al. found that most likely subcutaneous thigh fat accounts for the favorable effects of leg fat on CVD risk factors rather than intramuscular fat (25). Research on lipodystrophy, has demonstrated that conditions that involve the absence of subcutaneous fat are associated with IR (26,27,28,29). The differences in amount of subcutaneous fat mass between men and women (leg-fat percentage was twice as high in women when compared to men) may partly explain the differences in the associations between leg fat and insulin sensitivity for either gender. The mechanism by which the subcutaneous leg fat adds to a favorable CVD risk profile is still under debate. Previous studies have reported differences in metabolic, genetic, and hormonal characteristics between subcutaneous and visceral fat tissue. When compared with visceral adipocytes (fat cells), subcutaneous adipocytes have low catecholamine stimulated lipolysis rates and are more sensitive to insulin (30,31,32,33). It has been suggested that subcutaneous adipose tissue acts as a “metabolic sink,” metabolizing and storing excess free fatty acids in both fasting (34,35) and postprandial states (36). This may prevent ectopic fat accumulation in liver, muscle, and ß cell and thus eventually prevent IR, impaired insulin secretion, impaired glucose metabolism, hyperlipidemia, and increased CVD risk. In addition, it is known that visceral fat contains more macrophages, which are both more active and secrete more Interleukin-6 and Tumor Necrosis Factor-α than subcutaneous fat, which in turn increases the C-reactive protein levels. This produces a chronic low inflammatory state which adds to the CVD risk (37). It is not known whether similar pathways also can be found in subcutaneous thigh- or trunk-fat depots and whether the associations are present in the opposite direction.
In conclusion, in healthy European men and women, the associations between body composition and CVD risk factors cannot be explained by insulin sensitivity.
Acknowledgment
The RISC study was made possible by grants from the EU (QLG1-CT-2001-01252), Astra-Zeneca, and Merck Sante. The Dutch subcohort was supported by additional grants from the Netherlands Heart foundation (2002B123) and Heineken NV. Further information on the RISC project and participating centers can be found on the website www.egir.org.
Disclosure
The authors declared no conflict of interest.


