BMI, Waist Circumference, and Incident Urinary Incontinence in Older Women
Abstract
Overall body fat and central adiposity may reflect different mechanisms leading to urinary incontinence (UI). We examined the associations of BMI and waist circumference with incident UI, including the independent associations of BMI and waist circumference with UI type, among women aged 54–79 years in the Nurses' Health Study. Study participants reported their height in 1976 and their weight and waist circumference in 2000. From 2000 to 2002, we identified 6,790 women with incident UI at least monthly among 35,754 women reporting no UI in 2000. Type of incontinence was determined on questionnaires sent to cases with at least weekly incontinence. Relative risks (RRs) and 95% confidence intervals (CIs) were estimated using multiple logistic regression. There were highly significant trends of increasing risk of UI with increasing BMI and waist circumference (P for trend <0.001 for both). Multivariable RRs of developing at least monthly UI were 1.66 (95% CI 1.45–1.91) comparing women with a BMI of ≥35 kg/m2 to women with BMI 21–22.9 kg/m2 and 1.72 (95% CI 1.53–1.95) comparing women in extreme quintiles of waist circumference. When BMI and waist circumference were included in models simultaneously, BMI was associated with urge and mixed UI (P for trend 0.003 and 0.03, respectively), but not stress UI (P for trend 0.77). Waist circumference was associated only with stress UI (P for trend <0.001). These results suggest that women who avoid high BMI and waist circumference may have a lower risk of UI development.
Introduction
Higher BMI has been consistently identified as a risk factor for prevalent urinary incontinence (UI) in cross-sectional studies (1). However, it is possible that some incontinent women may avoid physical activity to cope with their urinary symptoms and subsequently gain weight, resulting in biased findings from cross-sectional studies (2,3). Thus, further study of the relation between obesity and UI in a prospective setting is needed to improve understanding of the role of this potentially modifiable risk factor in UI development.
Furthermore, measures of body habitus other than BMI, such as waist circumference, may be important to consider; specifically, BMI represents overall body fat, while waist circumference better represents central adiposity. If overall body fat and central adiposity reflect different mechanisms leading to UI, an investigation of their independent relations with the various UI types could provide important insights as to their respective roles in UI etiology. For example, it has been hypothesized that higher levels of central adiposity increase abdominal pressure and could be most relevant to stress UI (4); however, there are few prospective studies that simultaneously examine BMI, waist circumference and stress, urge, or mixed UI.
Therefore, in a prospective cohort of older women, we examined the associations of BMI and waist circumference with incident UI, including the independent associations of BMI and waist circumference with stress, urge, and mixed UI.
Methods and procedures
Study population
The Nurses' Health Study was initiated in 1976 when 121,700 female nurses aged 30–55 years responded to a mailed questionnaire about their medical history and lifestyle. Information is updated using biennial questionnaires. During each questionnaire cycle, full-length questionnaires are sent in initial mailings, followed by abbreviated questionnaires to maximize participation. Questions about UI were included on the full-length 2000 and 2002 questionnaires. To date, the follow-up rate is ∼90%. The Institutional Review Board of Brigham and Women's Hospital approved this study.
Women who completed the full-length questionnaires in both 2000 and 2002 (n = 77,696) were identical to the entire cohort in key characteristics, including mean age (66 years in both), mean BMI (27 kg/m2 in both), current cigarette smoking (9% in both), and diabetes (9% in both). Other characteristics were also very similar in those who did and did not complete the full-length questionnaire, such as parity (93% vs. 92% parous, respectively), current use of postmenopausal hormone therapy (43% vs. 37%, respectively), and previous hysterectomy (41% vs. 38%, respectively).
In these analyses of incident UI, we excluded women missing data on BMI (n = 104) or UI (n = 1,990), and women with prevalent UI in 2000, defined as leaking at least once per month (n = 28,813) or less than once per month of quantities at least enough to wet the underwear (n = 7,948). In addition, to address the high potential for confounding by health status, 841 women with a history of major neurologic conditions, including stroke, multiple sclerosis, amyotrophic lateral sclerosis, and Parkinson's disease; 2,242 women with significant functional limitations; and 4 women who reported living in a nursing home, were excluded from analyses. Thus, there were 35,754 continent participants in 2000 at risk for incident UI in 2002.
Measurement of incident UI
In 2000 and 2002, participants were asked, “During the last 12 months, how often have you leaked or lost control of your urine?” Response options were never, less than once per month, once per month, two to three times per month, about once per week, and almost every day. Women reporting UI were then asked, “When you lose your urine, how much usually leaks?” Response options were a few drops, enough to wet your underwear, enough to wet your outer clothing, and enough to wet the floor. A reliability study among a subgroup of the nurses demonstrated high reproducibility of responses to these questions (5).
In the epidemiologic literature, definitions of UI have ranged from any involuntary urine loss to leakage occurring at least once per day (6). Due to the absence of a standard definition, we considered several definitions of incident UI in our analyses. Our primary definition included cases of leaking at least once per month in 2002 among those with no UI or insignificant UI (i.e., a few drops less than once per month) in 2000, as we believed that this represents clinically meaningful UI. Second, to evaluate risk factors for more significant UI, frequent incontinence was defined as leaking at least once per week in 2002, and severe incontinence was defined as leaking at least once per week of quantities at least enough to wet the underwear, corresponding to the definition of severe UI from the validated Sandvik Severity Index (7). For all analyses, participants reporting never leaking or leaking a few drops less than once per month again in 2002 were considered as noncases.
Due to the large number of incident cases, we mailed a supplementary questionnaire to a random subset of women with incident frequent UI in 2002 to collect more detailed information about precipitants of urine loss (n = 1,939). Of these women, 186 did not respond (9.6%) and 119 (6.1%) returned incomplete questionnaires, leaving 1,634 women with sufficient information to be classified by UI type. Incident cases with frequent UI who provided incontinence type information and those who did not were similar in mean age (66 years vs. 67 years, respectively), mean BMI (27 kg/m2 in both), and current cigarette smoking (9% vs. 10%, respectively). Other characteristics were also highly similar in these two groups, such as parity (93% vs. 92% parous, respectively), diabetes (9% vs. 10%, respectively), current use of postmenopausal hormone therapy (47% vs. 40%, respectively), and previous hysterectomy (42% vs. 39%, respectively).
The supplementary questionnaire included questions to assess incontinence type (8). We defined stress UI as leakage occurring with coughing or sneezing, lifting things, laughing, or doing exercise. Urine loss with a sudden feeling of bladder fullness or when a toilet was inaccessible was considered a symptom of urge UI. UI classifications were based on the participants' reports of their dominant symptoms. Women reporting stress and urge symptoms equally were defined as cases of mixed UI. Those women whose symptoms did not meet the criteria for any UI type definition were excluded from analyses of UI type (n = 33).
Measurement of BMI and waist circumference
Participants were classified into seven categories of BMI, calculated using weight reported on the 2000 questionnaire and height reported on the 1976 questionnaire: <21, 21–22.9 (reference), 23–24.9, 25–27.4, 27.5–29.9, 30–34.9, and ≥35 kg/m2. In a similar group of nurses, self-reported height and height measurements obtained from medical records were highly correlated (r = 0.94) (9). In addition, among 140 Nurses' Health Study participants, self-reported weight was highly correlated with weight measured by a technician (r = 0.97) (10).
Waist circumference categories were created using quintile cutpoints. An illustration and instructions for measuring waist circumference at the navel were included on the 2000 questionnaire. Participants were asked to use a tape measure to measure their waist to the nearest quarter inch while standing and to avoid measuring over bulky clothing. Among 140 Nurses' Health Study participants, self-reported and technician-measured waist circumference measurements were well-correlated (r = 0.89) (10). Participants without a tape measure were asked to skip this question, thus 13,466 women with missing information were excluded from analyses of waist circumference. These women were similar to the entire cohort in mean age (65 years vs. 66 years, respectively), current cigarette smoking (11% vs. 9%, respectively), and previous hysterectomy (35% vs. 38%, respectively) and identical in mean BMI (27 kg/m2 in both), parity (92% parous in both), diabetes (9% in both), and current use of postmenopausal hormone therapy (37% in both).
Statistical analysis
To evaluate the relation of BMI and waist circumference to risk of UI, age-adjusted and multivariable-adjusted relative risks (RRs), estimated by odds ratios (ORs), and 95% confidence intervals (CIs) were calculated for each case definition (i.e., any, frequent, severe, stress, urge, mixed UI) using multiple logistic regression. Each multiple logistic regression model included the exposure variable of interest (i.e., BMI or waist circumference) and covariates previously identified in the literature as UI risk factors, including age (<60, 60–64, 65–69, 70–74, ≥75 years), parity (0, 1–2, ≥3, missing births), race or ethnicity (white, black, Hispanic, Asian, other or missing), cigarette smoking (never, past, current), menopausal status (premenopausal, unknown menopausal status, postmenopausal and never used hormone therapy, formerly used hormone therapy, or currently use hormone therapy), physical activity (metabolic equivalent hours per week in quintile categories), hysterectomy, diabetes mellitus, high blood pressure, and diuretic use. To investigate the independent associations of BMI and abdominal adiposity with incident UI, we conducted additional multivariable analyses in which BMI and waist circumference were included in the logistic regression model simultaneously; in these models, subjects missing waist circumference were excluded. Tests for linear trend in the RRs across categories were conducted by creating a continuous variable using the median value of BMI or waist circumference in each category.
Results
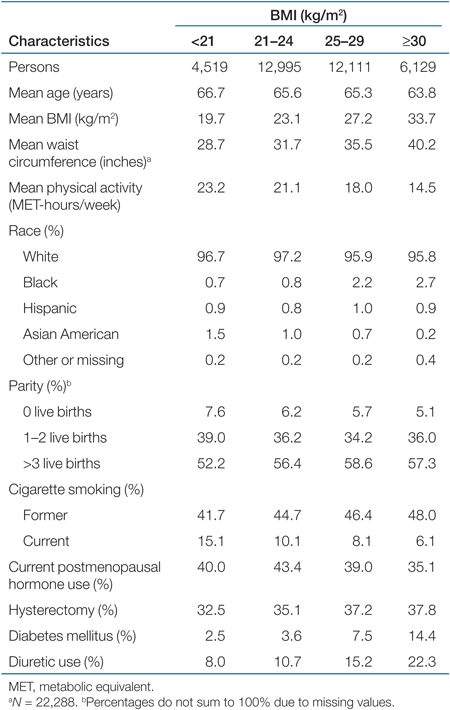
Among these women aged 54–79 years, 34% were overweight (BMI 25–29 kg/m2) and 17% were obese (BMI ≥30 kg/m2). The proportion of black women increased and the proportion of Asian-American women decreased with increasing levels of BMI (Table 1). In addition, compared with leaner women, those with higher BMI were less likely to be nulliparous, current cigarette smokers, or current users of postmenopausal hormone therapy. As expected, women with diabetes mellitus and women using diuretics were more likely to be in the higher categories of BMI.
 |
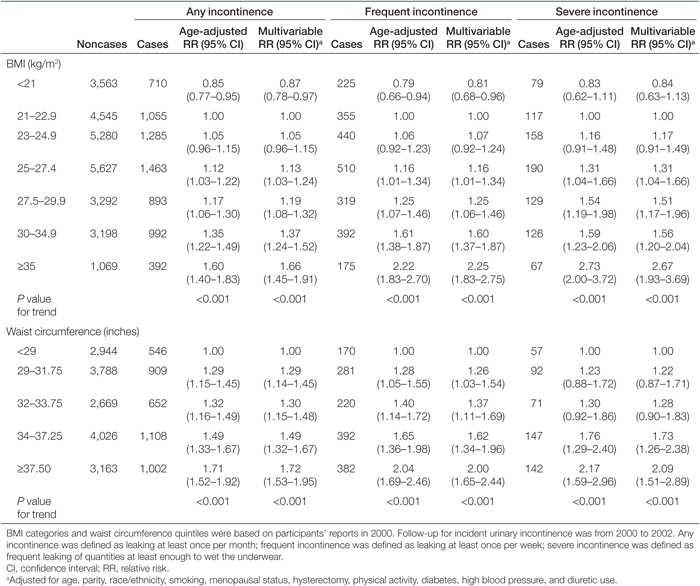
In multivariable analyses, there were highly significant linear trends of increasing risks of any, frequent, and severe UI with increasing BMI and with increasing waist circumference (P for trend < 0.001 for each) (Table 2). Compared with the reference group (BMI 21–22.9 kg/m2), the risk of developing at least weekly UI was reduced by 19% (95% CI 4–32%) in women with a BMI <21 kg/m2. In contrast, there were significant elevations in risk ranging from 16% (95% CI 1–34%) in women with a BMI between 25 and 27.4 kg/m2 to 125% (95% CI 83–175%) in women with a BMI of ≥35 kg/m2. Comparing extreme quintiles of waist circumference (≥37.5 inches vs. <29 inches), multivariable RRs were 2.00 (95% CI 1.65–2.44) for frequent UI and 2.09 (95% CI 1.51–2.89) for severe UI. When BMI and waist circumference were included in the same model, the RRs were attenuated for each, but both remained significant predictors of incident UI (data not shown). For example, after adjusting for waist circumference, RRs for frequent UI decreased from 2.25 to 1.83 (95% CI 1.28–2.63) comparing women with BMI ≥35 kg/m2 to women in the reference group. After adjusting for BMI, the RR of frequent UI decreased from 2.00 to 1.40 (95% CI 1.09–1.79) comparing women in extreme quintiles of waist circumference.
 |
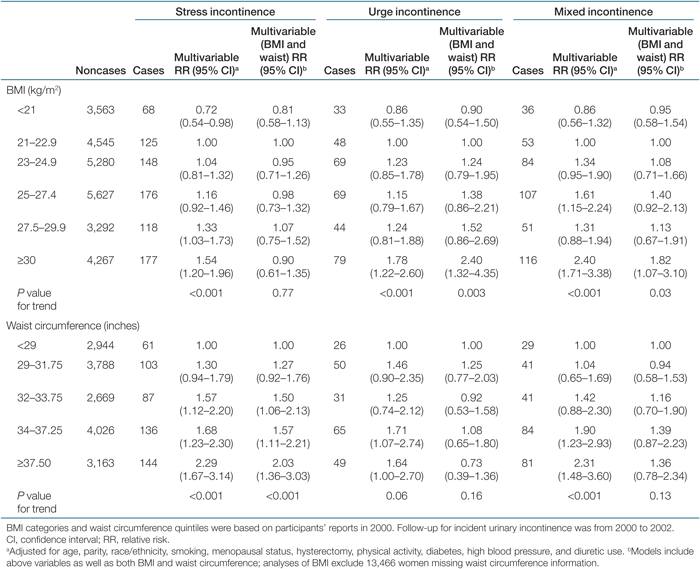
Analyses of UI type were restricted to women with incident frequent UI (Table 3); thus, we combined the two highest categories of BMI due to the smaller number of cases (i.e., the highest BMI category was ≥30 kg/m2, rather than ≥35 kg/m2). In models without simultaneous adjustment for BMI and waist circumference, we found highly significant trends of increasing risk of stress UI with increasing BMI and with increasing waist circumference (P for trend <0.001 for each). However, when BMI and waist circumference were included in the same model, only waist circumference remained a significant predictor of stress UI (P for trend = 0.77 for BMI, P for trend <0.001 for waist). For example, after adjusting for waist circumference, the RR of stress UI comparing women with a BMI of ≥30 kg/m2 to women in the reference group was 0.90 (95% CI 0.61–1.35), while the RR comparing women in extreme quintiles of waist circumference was quite strong (RR = 2.03, 95% CI 1.36–3.03).
 |
For urge UI, before adjusting for waist circumference, there was a highly significant trend of increasing risk with increasing BMI (P for trend <0.001), and before adjusting for BMI, there was a marginally significant trend of increasing risk of urge UI with increasing waist circumference (P for trend = 0.06). Specifically, RRs for urge UI were 1.78 (95% CI 1.22–2.60) comparing women with BMI ≥30 kg/m2 to the reference group, and 1.64 (95% CI 1.00–2.70) comparing women in extreme quintiles of waist circumference. When BMI and waist circumference were included in the same model, the association between BMI and urge UI persisted (P for trend = 0.003) and the association with waist circumference was nonsignificant (P for trend = 0.16).
Findings for mixed UI were generally similar to those for urge UI. Before adjusting for BMI and waist circumference, both increasing BMI and waist circumference were associated with an increasing risk of mixed UI (P for trend <0.001 for each). After BMI and waist circumference were adjusted for each other, the relation between BMI and mixed UI persisted (P for trend = 0.03), but there was no relation with waist circumference (P for trend = 0.13).
We examined whether associations between BMI, waist circumference, and incident UI varied by age (<65 years vs. ≥65 years); however, we did not observe any significant effect modification (P value for interaction = 0.18 for BMI, 0.26 for waist circumference).
In addition, we examined the ratio of waist-to-hip circumference as an alternate approach to examine the relation between abdominal adiposity and incident UI. Results were generally similar to those using waist circumference, but RRs were attenuated, possibly due to additional measurement error associated with hip circumference measurement or because waist-to-hip ratio is a poorer measure of central adiposity compared with waist circumference alone. For example, comparing extreme quintiles, the RR for any UI was 1.39 (95% CI 1.24–1.54) for waist-to-hip ratio, compared with 1.72 (95% CI 1.53–1.95) for extreme quintiles of waist circumference. After adjusting for BMI, there was an increase in the risk of stress UI with increasing waist-to-hip ratio (P for trend = 0.01), but waist-to-hip ratio was not associated with urge (P for trend = 0.09) or mixed UI (P for trend = 0.1).
Discussion
In this cohort of older women, overall BMI and abdominal adiposity were both significantly related to an increased risk of developing UI over 2 years of follow-up. More specifically, BMI was independently associated with urge and mixed UI while abdominal adiposity was an independent predictor of stress UI.
There are very little prospective data on the overall relation of BMI with incident UI. In one study of 1,439 women aged 42–52 years followed for 5 years, each unit increase in BMI was associated with a 5% (95% CI 2–7%) increased risk of at least monthly UI and a 12% (95% CI 6–19%) increased risk of at least weekly UI (11). Our results provide additional support, in a prospective study of older, continent women, for the relation between BMI and UI.
The different relations of BMI and waist circumference with specific UI types in our study provide important information regarding the variety of mechanisms, both systemic and mechanical, linking adiposity to UI. BMI and waist circumference are correlated (r = 0.7 in our study), yet still measure different aspects of body fat. BMI indicates overall adiposity and correlates well with absolute body fat measured by densitometry (r = 0.8–0.9) (12), but does not indicate body-fat distribution. In contrast, waist circumference is a measure of centrally distributed adiposity.
Based on our findings of an increase in urge UI with increasing BMI, but not waist circumference, it is likely that BMI primarily influences UI through systemic mechanisms. For example, increased BMI is linked to oxidative stress and chronic insulin resistance (13), factors that could cause vascular damage to the pelvic floor and lead to dysfunction of the detrusor and sphincter muscles. In addition, it is possible that impaired fasting glucose associated with diabetes and with prediabetes (only a small proportion of participants had clinically diagnosed diabetes) results in increased urine production and urinary frequency, contributing to an increased risk of urge UI. Still, an additional possibility is that mobility limitations due to obesity or obesity-related medical conditions could impair ability to reach a toilet, also contributing to the risk of urge UI; however, we adjusted our analyses for functional limitations and other health conditions which might affect mobility (e.g., stroke and Parkinson's disease).
In contrast, after simultaneously considering associations with BMI and waist circumference, we found that stress UI was only associated with waist circumference. In addition, findings from previous cross-sectional studies of patients undergoing gastric bypass surgery indicated that correlations between bladder pressure and central adiposity, measured by sagittal abdominal diameter (range 0.6–0.8), are stronger than correlations between bladder pressure and BMI (range 0.4–0.6) (14,15). Together, these observations suggest that the primary impact of abdominal adiposity on incontinence is best explained through the mechanical impact of central adiposity on intra-abdominal pressure, bladder pressure, and urethral mobility (16,17). That is, the weight of centrally distributed adipose tissue may cause a chronic elevation in intra-abdominal pressure and, consequently, intravesical pressure, resulting in strain on the urethral support structures and an increase in the risk of stress UI development.
No other prospective studies have examined overall BMI vs. abdominal adiposity in relation to UI type; however, findings from several cross-sectional studies are similar to ours. For example, when BMI and waist circumference were simultaneously considered among 2,702 women aged 42–52 years, there was an increased risk of prevalent stress UI with each centimeter increase in waist circumference (OR 1.04, 95% CI 1.02–1.06), but not with each unit increase in BMI (OR 0.99, 95% CI 0.95–1.04) (11). Likewise, a cross-sectional investigation of 2,743 postmenopausal women with coronary heart disease found an increased risk of stress UI (OR 1.18, 95% CI 1.00–1.39), but not urge (OR 1.06, 95% CI 0.91–1.23) or mixed UI (OR 1.09, 95% CI 0.96–1.23), with each 0.1 unit increase in waist-to-hip ratio, after adjusting for BMI (4). In a cross-sectional study of 769 women aged ≥30 years, both BMI and waist circumference were associated with stress UI (OR 2.97, 95% CI 1.98–4.44 for BMI ≥ 27.0 kg/m2 vs. <23.0 kg/m2; OR 5.01, 95% CI 3.21–7.84 for waist circumference ≥90.0 cm vs. <78.0 cm); however, after simultaneous adjustment for BMI and waist circumference, only waist circumference remained a significant predictor of stress UI (OR 6.07, 95% CI 3.23–11.40 for waist circumference) (18).
Limitations of our study should be considered. First, data on UI were self-reported. However, previous studies have demonstrated the reliability (5) and validity (19) of self-reports of UI. In addition, compared with clinical diagnoses, self-reports of UI type have been found to be highly specific (20), which is important to estimate valid RRs in a prospective study (21).
Data on BMI and waist circumference were also self-reported. Data on height, which may decrease with age, was reported 24 years earlier than weight, possibly resulting in slight underestimation of BMI. However, in a prospective study, such random misclassification of these variables would likely result in bias of the RR estimates toward the null value. In an observational study, confounding must be considered. We controlled for a large number of potential confounding factors, and excluded from the study population women who reported significant functional limitations or major neurologic conditions, reducing the possibility that confounding substantially influenced our findings. Nevertheless, residual confounding cannot be ruled out. Finally, the Nurses' Health Study is a largely white cohort of health professionals. Although risk factor relations observed in these women (5) have been consistent with findings from studies of broader-based populations of women, it is possible that our results are not applicable to nonwhite women, and further research should be conducted in minority populations.
In summary, among these older women, increasingly higher BMI was related to increased risks of urge and mixed UI, while increasingly higher waist circumference was related to stress UI. These results indicate that adiposity affects continence status through multiple mechanisms. Therefore, our findings suggest that avoiding high BMI and high waist circumference may help to reduce the burden of UI in women.
Disclosure
The authors declared no conflict of interest.
Acknowledgments
This research was supported by grants DK62438 and CA87969 from the National Institutes of Health. The content is solely the responsibility of the authors and does not necessarily represent the official views of the National Institutes of Health. M.K.T. was supported by the Yerby Postdoctoral Fellowship Program.


