Exploring Serum Ferritin's Connection to the Acute Phase Response in Zoo-Managed African Rhinoceroses
ABSTRACT
Despite serum ferritin's potential as an iron status indicator, its concentrations vary significantly throughout a black rhinoceros's (Diceros bicornis) life, sometimes irrespective of iron load. We explored acute phase response-related biomarkers, serum amyloid A (SAA) and ceruloplasmin (Cp), to better understand the mechanisms influencing serum ferritin changes in managed black rhinoceroses. The objective was to evaluate the relationships between circulating levels of ferritin, SAA, and Cp in black and white rhinoceroses (Ceratotherium simum). We analyzed banked serum samples collected serially from 11 black (n = 222) and 7 white (n = 134), rhinoceroses (rhinos) and classified samples based on SAA values: clinically healthy (< 1 mg/L), subclinical (1–7 mg/L), or clinically abnormal (> 7 mg/L). In black rhinos, serum ferritin was not different between health status categories (p = 0.5292), nor was it correlated with SAA (p = 0.4164). However, Cp activity was significantly lower in clinically healthy sera (p < 0.0001) and had a moderate positive association with SAA (r = 0.477, p < 0.0001). Among the white rhino samples, only five had SAA values greater than 1 mg/L, limiting the assessment of ferritin and Cp activity in the health context. Minor, yet significant, relationships were observed between serum ferritin and Cp activity, negative in black rhinos (r = −0.206; p = 0.0022) and positive in white rhinos (r = 0.289, p = 0.0008). Cp activity may aid in diagnosing illness in black and white rhinos, based on values observed in sera collected near the time of death. However, acute inflammatory processes do not appear to be one of the primary drivers of the high ferritin concentrations detected in some black rhinos.
Summary
-
Acute inflammation is unlikely to be the main cause of elevated ferritin levels in some black rhinoceroses.
-
Investigating species-specific differences in the relationship between serum ferritin and ceruloplasmin activity could offer key insights into rhinoceros health.
1 Introduction
Black rhinoceroses (Diceros bicornis) are considered critically endangered by the International Union for Conservation of Nature (Emslie 2020). Ex situ conservation efforts may provide crucial genetic reservoirs that could bolster diminishing black rhinoceros populations. However, managed black rhinoceroses (henceforth referred to as rhinos) appear susceptible to numerous illnesses not typically seen in other rhino species, for example, increased susceptibility to infections, ulcerative dermatitis, and chronic glomerulonephritis (Miller and Buss 2015; Roth et al. 2019). Serum iron and ferritin are higher in managed black rhinos compared to their wild (Dierenfeld et al. 2005) and white (Ceratotherium simum) rhino counterparts (Miller et al. 2016; Smith, Chavey, and Miller 1995). Also, black rhinos exhibit a propensity for storing excessive iron in organ tissues (Paglia and Tsu 2012). Thus, there is speculation that some of the health issues in managed black rhinos are connected to their iron metabolism.
Unlike copper and zinc, excess iron is not excreted by mammals; instead, cells upregulate the expression of ferritin to safely store iron within tissues (Harvey 2008). Hemosiderosis results when the amount of iron exceeds the capacity of cells to produce ferritin, and a complex of iron and ferritin accumulates in different organs (e.g., liver, spleen, bone marrow; Piperno 1998). Iron overload disorder (IOD) is a term used to describe excessive organ hemosiderosis in rhinos, regardless of the presence or absence of tissue damage (Citino et al. 2012). An IOD diagnosis in a rhino typically occurs postmortem as their large physique precludes the use of biopsy or MRI to discern hemosiderosis accumulation in a live individual.
Although serum ferritin can be an indicator of iron status in certain circumstances (Lowenstine and Stasiak 2015), Wojtusik and Roth (2018) observed that serum ferritin concentrations varied greatly during a black rhino's lifetime, and the variations appeared dissociated from IOD. Their findings are consistent with those of other species. Serum ferritin can be nonspecifically elevated independent of iron overload (Ravasi et al. 2017), though increases are typically associated with conditions in which inflammation has a central role, such as cancer, COVID-19, diabetes, infection, insulin resistance, neurodegeneration, and obesity (Friedrichs et al. 2010; Habib et al. 2021; Kellon & Gustafson, 2019; Ottenjann et al. 2006; Smith and Cipriano 1987; Wang et al. 2010). In many instances, ferritin appears to act as an acute phase reactant and modulates the immune response (Giemza-Stokłosa, Islam, and Kotyla 2019). Therefore, an investigation into fluctuations of serum ferritin in the context of other acute phase reactants may provide insight into the underlying mechanisms driving serum ferritin variability within black rhinos.
To that end, we examined circulating levels of ceruloplasmin (Cp) activity, serum amyloid A (SAA), and ferritin in black and white rhinos. Cp is a multifunctional glycoprotein that binds 95% of circulating copper and uses it to regulate the flow of iron from cells into plasma (Linder 2016). In other species, serum Cp activity and ferritin increase by 30%–60% and 300%–3000%, respectively, as part of an acute phase response (APR) (Northrop-Clewes 2004, 2008). In most species, SAA will rise as much as 1000-fold during an APR (Cray, Zaias, and Altman 2009), and elevated SAA concentrations have been shown to be prognostic for compromised health in black and white rhinos (Hooijberg and Cray 2022). The goals of this exploratory study were to (1) determine if changes in serum ferritin coincide with alterations in these other positive acute phase proteins (APPs) and (2) identify any differences in these associations between black and white rhinos.
2 Materials and Methods
2.1 Source of Serum Samples
All samples had been collected for other purposes and stored at −20°C in a rhino serum bank at the Center for Conservation and Research of Endangered Wildlife (CREW). The use of samples was approved by the Cincinnati Zoo and Botanical Garden's Institutional Animal Care and Use Committee (protocol# 19-154: Noninvasive and harmless opportunistic collection of biological samples from animals) and by the zoological institutions from whence the samples originated (personal communications). Samples were selected with a preference for those collected serially across several months and/or years from an individual. The schedule of collection differed among and within individuals, ranging from weekly to monthly, or yearly. The black rhino samples were selected to be a representative subset of those utilized previously in the ferritin study by Wojtusik and Roth (2018). In total, 356 serum samples from black and white rhinos were analyzed. Samples represent 11 black and 7 white rhinos (Table 1), ranging from 6 to 55 samples per individual. The health status during the time of serum collections was unknown except for two individuals for which a portion of their samples were collected near their time of death; a black rhino (female #3) diagnosed with systemic hemosiderosis postmortem, and a white rhino (male #3) diagnosed with cancer postmortem. Where possible, sera were thawed and kept on ice until all assays were performed to ensure that the number of freeze-thaw cycles was minimized and consistent to the extent possible (Huang et al. 2017).
| No. of individuals | No. of samples | Individual's agea at the time of sample collection | |||
|---|---|---|---|---|---|
| Median | Meanb ± SEM | Range | |||
| Black | 11 (6M.5F) | 222 | 18.1 | 17.8 ± 0.6 | 1.2–29.9 |
| White | 7 (5M.2F) | 134 | 23.5 | 23.1 ± 0.8 | 7.8–37.5 |
- Abbreviation: SEM, standard error of the mean.
- a Years.
- b Arithmetic mean.
2.2 Rhinoceros-Specific Ferritin Immunoassay
Serum ferritin values for the black rhino samples were derived during a previous study (Wojtusik and Roth 2018). Concentrations of ferritin within white rhino sera were determined with an enzyme-linked immunosorbent assay (ELISA) previously validated for Sumatran (Roth, Reinhart, and Kroll 2017) and black (Wojtusik and Roth 2018) rhinos. Serum ferritin was assessed as described in detail by Roth, Reinhart, and Kroll (2017) with minor modifications. Monoclonal antibody 5D10.B5 was utilized at 1 µg/mL for coating plates as per protocol, but antibody 1D6.A3 conjugated to horseradish peroxidase was used at 100 ng/mL instead of 400 ng/mL for detection. Additionally, high kinetic 3,3,5,5-Tetramethybenzidine (Moss; Pasadena, MD, USA) and 1 N HCl were employed as peroxidase substrate and stop solution, respectively, in place of a substrate solution comprised of hydrogen peroxide and 2,2′-azino-bis(3-ethylbenzothiazoline-6-sulfonic acid) in a citrate buffer. Standards (31–4000 ng/mL) and quality controls (250 and 1000 ng/mL) were created from white rhino liver ferritin isolated as described in Wojtusik and Roth (2018). The lower limit of detection (LoD) for white rhino serum ferritin was 45.9 ng/mL (calculated as follows: meanblank (n ≥ 20) + 3SDblank [Shrivastava and Gupta 2011]) with intra- and interassay coefficients of variation (CV) at 6% and 11%, respectively (CV values derived from 14 plates of results). Serum samples initially were run neat, but if results were above the standard range, samples were rerun at a dilution (2- to 10-fold) to ensure the resulting values would fall within the standard curve.
2.3 Cp Colorimetric Activity Assay
Cp activity within the sera was assessed using the DetextX colorimetric kit from Arbor Assays (Ann Arbor, MI, USA) according to manufacturer instructions. Activity is determined using substrate oxidation which results in a colorimetric product proportional to the Cp enzymatic activity present within standard and unknown wells. Rhino serum spiked with high and low control amounts of the Cp standard had an average recovery of 96% (range 90%–102%). Parallelism and dilution linearity were observed with the rhino sera serially diluted (1:50 to 1:200) in assay buffer (average CV 3%; r2 = 0.999). The influence of multiple freeze-thaw cycles on the stability of Cp activity was determined utilizing black rhino serum pooled from three individuals. Aliquots of pooled serum were repeatedly thawed at room temperature for 20 min and then refrozen at −20°C for one to six cycles. The variation in Cp activity between freeze/thaw cycles averaged 11% (p > 0.05), and values were not always lower with each subsequent cycle. Samples were diluted 50- to 100-fold, and values were reported in units (U) of Cp activity per milliliter serum. Intra- and interassay CVs for the Cp activity assay were 2% and 12%, respectively (CV values derived from 10 plates of results). The LoD for the Cp activity assay was determined to be 0.217 U/mL.
2.4 SAA Immunoassay
Concentrations of SAA were measured using a multispecies sandwich ELISA (TriDelta Diagnostic Corp., Maynooth, Ireland) as per manufacturer instructions. This assay has been validated for use with African rhino sera (Cray et al. 2019; Hooijberg et al. 2020; Meyer et al. 2022; Schook et al. 2015). For this study, values were reported using bovine standard equivalents (Cray et al. 2019; Hooijberg et al. 2020). Samples were initially diluted 20-fold for assessment, and when results for a diluted sample fell outside the standard range (18.8–300 ng/mL), samples were rerun at a different dilution (neat to 400-fold). For the SAA ELISA, the intra-assay CV was 10.9% for moderate to high serum values (> 1 mg/L) and ranged from 12.2% (black) to 24.8% (white) for low serum values (< 1 mg/L). These CVs are consistent with previous reports utilizing this assay on rhino sera (Hooijberg et al. 2020; Meyer et al. 2022). Based on the quality control samples that were run with every assay, the interassay CV for the SAA ELISA was 6.8%. Intra- and interassay CV values for the SAA ELISA were derived from 10 plates of results. As per the company (personal communication), the analytical sensitivity of the assay is 3 ng/mL in diluted sera. The LoD was set at 60 ng/mL after adjusting for a 20-fold dilution factor. Samples were classified using SAA values reported in the literature for various health states (Hooijberg et al. 2020; Meyer et al. 2022; Schook et al. 2015); clinically healthy < 1 mg/L and clinically abnormal > 7 mg/L. Samples that fell between those ranges were classified as subclinical illness.
2.5 Exploratory and Statistical Analyses
When sample values fell below the detection limits of an assay (SAA – 30 black and 32 white rhino samples; Ferritin – 26 white rhino samples), the LoD of the specific assay was divided by the square root of 2, and the result was substituted for the sample value (Croghan and Egeghy 2003). Arithmetic values for the median, mean ± standard error of the mean (SEM), minimum, and maximum were calculated using the PROC MEANS procedure of SAS 9.4 (SAS Inst. Inc., Cary, NC, USA). Data were plotted by species to examine the distribution of serum ferritin and Cp activity concentrations related to the SAA classification of health status.
For statistical analyses, serum biomarker values were log-transformed to ensure normality (i.e., Shapiro–Wilk statistic W > 0.85). A p value ≤ .05 was considered statistically significant for all tests performed. We examined the data from black rhino sera for differences in ferritin or Cp activity concentrations in relationship to SAA classified health state (PROC GLIMMIX; F-protected least significant differences). Data were reported as back-transformed least squares means ± SEM. Correlation analyses (PROC CORR) between serum biomarkers by species were performed. A post hoc power analysis using G*Power (ver. 3.19.7; Faul et al. 2009) confirmed that sample sizes provided sufficient power to report correlation outcomes (α = 0.05, β ≤ 0.1). Correlations with significant p values were categorized based on the correlation coefficient value as follows: < 0.2 negligible, 0.2–0.29 minor, 0.3–0.69 moderate, 0.7–0.79 strong, and > 0.8 very strong.
3 Results and Discussion
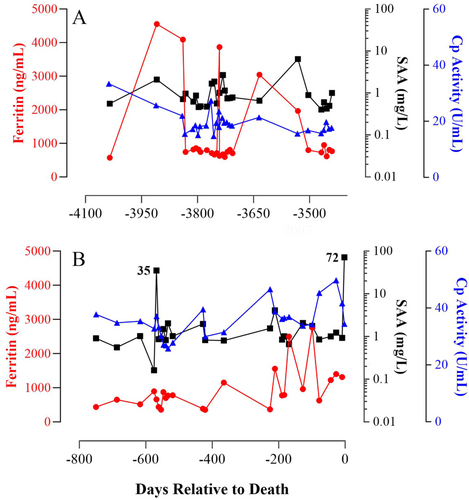
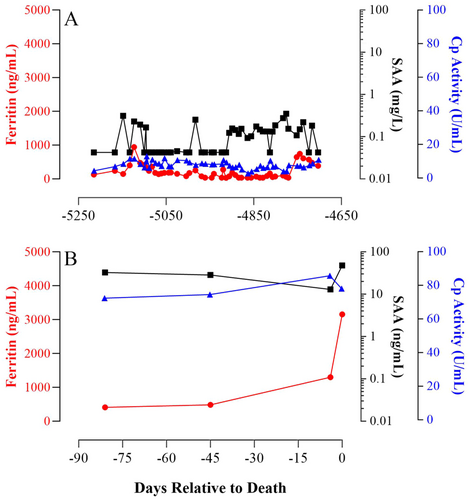
Although this retrospective study encompassed a relatively small number of individuals, the information gained from assessing numerous samples collected serially from each rhino can provide insight into rhino physiology that could not be achieved by analyzing random, single samples from many individuals. As was expected, the serum biomarkers examined herein varied not only among individuals within both species (Tables S1–S3) but also throughout the lifetime of an individual rhino, as illustrated in the representative profiles of the two individuals known to have health issues sometime during the serum collections (Figures 1 and 2). Noteworthy is that in the sera from the black rhino diagnosed with systemic hemosiderosis postmortem, the highest levels of ferritin observed were not observed during the months immediately before death but in the serum drawn 10 years prior.


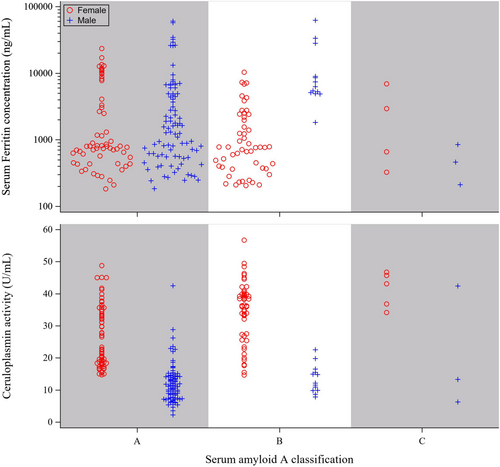
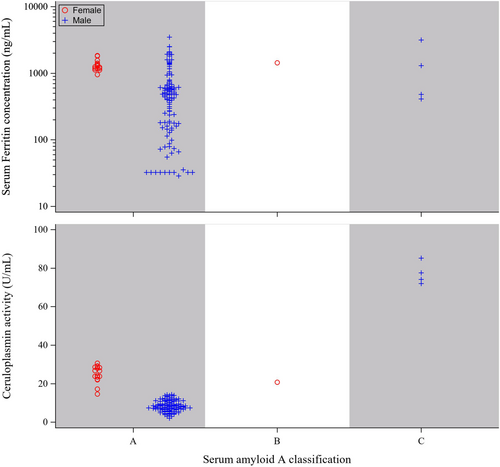
SAA is widely recognized as a major APP in most species, exhibiting a more than 10-fold increase in concentration in response to infection or trauma (Cray, Zaias, and Altman 2009; Petersen, Nielsen, and Heegaard 2004). Elevated SAA concentrations have been identified to be prognostic indicators of compromised health in black and white rhinos (Hooijberg and Cray 2022). In this context, we examined the distribution of serum ferritin and Cp activity (Figures 3 and 4). While ferritin and Cp protein have been observed to act as APPs in other species (Northrop-Clewes 2004, 2008), our analysis of the sera from black rhinos revealed that ferritin and Cp activity values were not consistently elevated when SAA was high (Figure 3). No significant differences in serum ferritin values between health status categories were observed (p = 0.5292; Table 2). However, Cp activity was significantly lower in the sera classified as clinically healthy compared to the other categories (p < 0.0001; Table 2).


| Health status (SAA class) | n | Ferritin (ng/mL)a | Cp activity (U/mL)a |
|---|---|---|---|
| Clinically Healthy (< 1 mg/L) | 149 | 1549.38 ± 177 | 15.27 ± 0.71B |
| Subclinical Illness (1–7 mg/L) | 64 | 1407.09 ± 245A | 27.24 ± 1.96A |
| Clinically Abnormal (> 7 mg/L) | 7 | 866.86 ± 457A | 28.33 ± 5.72A |
| p = 0.5292b | p < 0.0001b |
- Note: A and B mean with different letter superscripts within a column differ.
- Abbreviations: Cp, ceruloplasmin; SAA, serum amyloid A.
- a Values presented as back-transformed least squares means ± standard error of the mean.
- b p value resulting from statistical analysis examining the differences in ferritin or Cp activity concentrations by SAA-classified health status.
SAA concentrations vary with the severity of the disease a rhino is experiencing (Meyer et al. 2022). In healthy animals, circulating SAA is low or undetectable; whereas, for those experiencing a chronic illness or persistent localized inflammation, concentrations are elevated 50%–100% above baseline and will increase rapidly as much as 1000-fold in response to trauma or acute infection (Cray, Zaias, and Altman 2009; Petersen, Nielsen, and Heegaard 2004). In this study, the few samples (n = 8) with SAA values exceeding 7 mg/L were collected from six different black rhinos (3 M.3 F), with only one being drawn from an individual near their time of death (Figure 1B; −2 days relative to death). It is possible that the individuals examined herein were experiencing one of the numerous chronic issues documented in black rhinos (Miller and Buss 2015; Roth et al. 2019), such as periodontal disease which can induce elevated SAA concentrations in humans (Glurich et al. 2002). Approximately one-third of the black rhino samples examined exhibited SAA values that fell between the clinically healthy and abnormal classifications. The SAA values herein appear consistent with the findings of Schook et al. (2015) that many managed black rhinos may be in a pro-inflammatory state since they tend to have higher concentrations of SAA, tumor necrosis factor-alpha, and insulin compared to their wild counterparts.
Our analyses of the black rhino samples revealed no significant correlation between the levels of ferritin and SAA (r = 0.055, p = 0.4164; n = 220), while a moderate positive relationship was observed for Cp activity and SAA (r = 0.477, p < 0.0001; n = 221). These results may be attributed to variations in temporal patterns of change. Typically, during the initial 48 h of an APR, both serum ferritin and Cp protein levels have been observed to mirror the increases in SAA (Northrop-Clewes 2004, 2008). Given the half-life of SAA, which ranges from 24 to 48 h, concentrations will sharply decline as the severity of an illness decreases. In contrast, Cp and ferritin proteins can remain elevated in circulation for additional days and weeks, respectively (Northrop-Clewes 2004, 2008). It is plausible that sample collections occurred days after an APR when SAA was returning or had returned to baseline, Cp would have been declining, and ferritin would still be elevated. This potential scenario could explain the minor negative relationship (r = −0.206, p = 0.0022; n = 220) we discerned between ferritin and Cp in black rhino sera, although we cannot discount the possibility that ferritin is increasing in response to something unrelated to APR.
A limited number of white rhino samples (n = 5) exhibited SAA values that were greater than the clinically healthy criteria (Figure 4). Notably, the four samples classified as clinically abnormal originated from a single male individual (Figure 2), all collected within 90 days of his death, while the sole sample categorized as intermediate originated from a 9-year-old female, who is currently 19 years old. In the analysis of white rhino samples, we observed a minor positive correlation between ferritin and SAA (r = 0.254, p = 0.034; n = 131) and a moderate positive association between Cp activity and SAA (r = 0.477, p < 0.0001; n = 131). However, inferences about the biological relevance of these findings are limited, given the majority of the samples fell within a range where accurate SAA value assessment becomes difficult.
In contrast to what was observed for black rhino sera, serum ferritin and Cp activity had a minor positive relationship in the white rhino sera (r = 0.289, p = 0.0008; n = 131). The disparities between the two species may be explained by the imbalance in the number of samples derived from black and white rhinos of each sex (117 vs. 17 from females and 105 vs. 117 from males, respectively). Apart from the white rhino sera classified as clinically abnormal, circulating Cp activity was consistently lower in males compared to females across species (Figures 3 and 4). This sex-based difference aligns with reports that estrogen and progesterone enhance the expression of circulating Cp (Linder 2016). However, it is crucial to consider that species differences in the relationship between serum biomarkers might also be influenced by their roles in iron and copper homeostasis and transport, which could potentially differ between black and white rhinos. To further elucidate these distinctions, additional studies collecting sera on specific timeframes from a larger pool of individuals with a balanced sex ratio may be warranted to provide a more comprehensive understanding of the species-specific variations in the relationship between Cp activity and serum ferritin observed in this study.
While Cp activity in black rhinos has been previously examined, with values not reported (Mylniczenko et al. 2012; Paglia and Radcliffe 2000), to our knowledge, this study is the first report on Cp activity in white rhinos. The observed Cp activity values for rhino sera align with those reported in various species, including cattle (Cerone et al. 2000), songbirds (Costantini, Casasole, and Eens 2014), and humans (Harder et al. 2020). In most mammalian species, Cp is a minor APP with typical increases of less than twofold during the APR (Northrop-Clewes 2004, 2008). Interestingly, in the black rhino profile depicted in Figure 1, circulating SAA and Cp activity, on average, were approximately fivefold and twofold higher, respectively, in the months preceding death compared to those earlier in life (1.1 ± 0.2 vs. 5.2 ± 3 mg SAA/L and 19.4 ± 0.8 vs. 35.1 ± 1.2 U Cp activity/L). These data support the notion that both SAA and Cp activity can be prognostic for recurrent inflammation in rhinos, as observed in other species (Natesha et al. 1992; Petersen, Nielsen, and Heegaard 2004). An exception to the typical twofold increase was noted in the white rhino profile during the months just before death where Cp activity was ~10-fold higher than earlier in life (8.1 ± 0.3 vs. 77.2 ± 2.9; Figure 2). In humans, Cp activity can serve as a cancer marker with increases being proportional to tumor volume (Senra Varela, Lopez Saez, and Quintela Senra 1997). Cancer was found postmortem to be throughout the body of the white rhino profiled in Figure 2 (personal communication), potentially explaining the elevated levels of Cp activity observed during the months just before death.
4 Conclusion
The cumulative Cp activity and SAA data, spanning across this study and previous investigations (Hooijberg et al. 2020; Meyer et al. 2022), support the conclusion that these biomarkers can serve as prognostic indicators for the health status of rhinos. The observed patterns in Cp activity and SAA levels consistently align with the anticipated APR during health challenges. However, the relationship with ferritin presents a more nuanced scenario. The lack of a consistent relationship between changes in circulating ferritin concentrations and the other APPs could suggest that acute inflammatory processes may not be the primary driver of the high ferritin concentrations detected in some black rhinos during their lifetime (this study, Schook et al. 2015; Wojtusik and Roth 2018).
Further investigations into understanding the species differences in the relationships between serum ferritin and Cp activity and how they relate to chronic and acute illness may provide valuable insights into rhino health.
Acknowledgments
The authors thank the many zoos and rhino holding facilities for their willingness to collaborate and contribute samples for research investigation. Specifically, we thank ABQ BioPark Zoo, Caldwell Zoo, Columbus Zoo and Aquarium, Dallas Zoo, Houston Zoo, Milwaukee County Zoo, SeaWorld Parks and Entertainment, Tulsa Zoo, and White Oak Conservation for their contributions to this effort. This work was supported by generous gifts from Tucker and Michael Coombe; and Elizabeth Tu Hoffman.
Open Research
Data Availability Statement
All data underlying these findings are available upon reasonable request from the corresponding author (L. A. R.). Identifying information will be removed in accordance with our commitment to anonymity to participating facilities.


