Delayed gastric emptying risk stratification in patients with pancreatic ductal adenocarcinoma after pancreatoduodenectomy: An international validation cohort study
Zongting Gu, Yongxing Du and Yunjie Duan These authors contributed equally to this work.
Abstract
Background
Currently, there is still a lack of an accurate predictive model for delayed gastric emptying (DGE) following pancreaticoduodenectomy (PD) in patients with pancreatic ductal adenocarcinoma (PDAC). The aim of this study was to develop a concise model that could effectively predict the risk of DGE.
Methods
This retrospective cohort study included a training cohort of 1251 consecutive PDAC patients who underwent PD from the US multicenter ACS-NSQIP database. Additionally, a validation cohort of 934 consecutive PDAC patients who underwent PD was included from the National Cancer Center in China. A total of 46 perioperative indicators were incorporated in the analysis. The DGE risk stratification (DGERS) model was then developed and validated using Lasso-logistic regression.
Results
After screening using Lasso-logistic regression, we identified four independent predictors that were significantly correlated with DGE: days to pancreatic drain removal (HR, 1.05; 95% CI, 1.02–1.08; p < 0.001), pancreatic fistula (HR, 2.61; 95% CI, 1.65–4.12; p < 0.001), sepsis/septic shock (HR, 2.46; 95% CI, 1.52–3.91; p < 0.001), and reoperation (HR, 4.16; 95% CI, 2.27–7.57; p < 0.001). Based on these factors, we developed a nomogram to predict postoperative DGE. The model demonstrated excellent calibration and optimal performance in the validation cohorts (AUC, 0.73; 95% CI, 0.67–0.73). In the validation cohort, the DGERS exhibited significant risk stratification ability, with AUC values of 0.7, 0.61, and 0.74 for the low-, moderate-, and high-risk groups, respectively.
Conclusions
This study identified four factors that independently increased the occurrence of DGE in patients with PDAC after PD, including days to pancreatic drain removal, pancreatic fistula, sepsis/septic shock, and reoperation. Based on these findings, we developed a personalized and straightforward DGERS that enables dynamic and precise prediction of DGE risk, allowing for effective stratification of individuals based on their risk profiles.
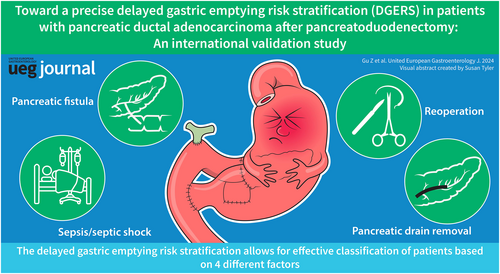
Graphical Abstract
Key summary
Summarise the established knowledge on this subject
-
There is still a lack of an accurate model for delayed gastric emptying (DGE) prediction in patients with PDAC after pancreaticoduodenectomy (PD).
What are the significant and/or new findings of this study?
-
The Lasso-logistic regression was used to develop and validate a simplified Delayed gastric emptying risk stratification (DGERS) in two large-scale international multicenter cohorts.
-
The DGERS enables dynamic and precise prediction of DGE risk, allowing for effective stratification of individuals based on their risk profiles.
-
This study underscores the importance and clinical significance of early pancreatic drain removal in patients with PDAC after PD.
INTRODUCTION
The prognosis of pancreatic ductal adenocarcinoma (PDAC) is extremely poor, with a 5-year survival rate of only 9%.1 Despite advances in PDAC diagnosis and treatment, only 15%–20% of patients have an opportunity for radical surgery with 5-year survival rate less than 30%.2 PD is currently the only potentially curative treatment for PDAC in the head of the pancreas, but its associated complications may negatively impact survival rates.3 Therefore, effectively preventing and controlling PD-related complications is the key to implement such complicated operations for PDAC. Delayed gastric emptying (DGE) is one of the most common complications of PD(3). It significantly prolongs hospital stay, increases hospitalization costs, decreases the postoperative quality of life, and increases the rehospitalization rate,4-6 which conflicts with the current concept of enhanced recovery after surgery (ERAS).7 Moreover, the occurrence of DGE is closely related to the decline in the long-term survival rate of PDAC because it delays the timing of systemic treatments such as adjuvant chemotherapy.8, 9 Therefore, establishing a DGE prediction model to achieve dynamic and accurate risk prediction and stratification is of great significance to guide the hierarchical management of patients and the implementation of preventive measures to reduce the risk of DGE and ultimately improve the prognosis of PDAC.
Despite the scarcity of previous studies on this subject, there are still researchers who are dedicated to addressing this issue. In 2020, Cai et al.10 identified pylorus-preserving pancreaticoduodenectomy (PPPD), bile leakage, abdominal infection and diabetes as independent risk factors for severe delayed gastric emptying (SDGE, grade B/C DGE) through univariate and multivariate logistic analysis of perioperative indicators. Based on these four independent risk factors, a nomogram was developed to predict the risk of SDGE. The reported area under the curve (AUC) value measuring discriminative ability for this nomogram in the validation cohort was 0.721. However, the sample size used to develop this model was relatively small, consisting of only 308 cases. Additionally, external validation of the nomogram was lacking. Furthermore, a recent study aimed to build a risk stratification scoring system called PrEDICT-DGE,11 which included a larger number of patients. However, the scoring system had several limitations. Firstly, it included a relatively high number of model variables (n = 9), which may complicate its practical application. Secondly, the scoring system lacked external validation, which is essential for assessing its performance in different patient populations. Lastly, the ability of the scoring system to achieve precise risk prediction, as measured by AUC, was reported to be 0.688, indicating room for improvement in its discriminative ability. Therefore, there is an urgent need for the development of a simple and accurate DGE prediction model for PDAC patients. Our previous research12 indicated that a least absolute shrinkage and selection operator (Lasso)-based predictive model could enhance performance. Several studies have established postoperative pancreatic fistula (POPF), sepsis (including septic shock), and reoperation as risk factors for DGE.13-18 However, their potential for predicting DGE following PD in PDAC patients remains to be determined. Theoretically, irrespective of the causality of these postoperative indicators with DGE, their correlations can be exploited for predictive purposes prior to formal DGE diagnosis.
This study used a large-scale cohort of patients with PDAC who underwent PD from the multicenter American College of Surgeons (ACS)-National Surgical Quality Improvement Program (NSQIP) database in the United States between 2014 and 2017 to develop a novel nomogram for DGE prediction using reliable Lasso-logistic regression. Based on the novel predictive model, a DGE risk stratification (DGERS) was established and validated in an international cohort of patients from the National Cancer Center (NCC) hospital in China. The DGERS facilitates precise prediction of DGE risk and enables effective stratification of individuals based on their risk profiles.
MATERIALS AND METHODS
Patient study cohort
The training cohort for this study was obtained from the ACS-NSQIP pancreatectomy-targeted database from 1 January 2014 to 31 December 2017, which registers up to 274 perioperative indicators. ACS-NSQIP is a prospectively maintained multicenter database whose data collection is standardized, validated, and reliable.19 More information about the database, data collection protocols, and definitions is available online (https://www.facs.org/quality-programs/acsnsqip/participant-use). The training cohort included PDAC patients who underwent elective PD using CPT codes: 48150, 48,152, 48,153 and 48,154. Figure S1 presents the data distribution features in the training cohort. The validation cohort was derived from the data of PDAC patients who underwent PD in the pancreatic center of Chinese NCC hospital from 1 January 2014 to 31 December 2019. Cases without PD, pathological non-PDAC, or cases with missing data on variables were excluded from the analysis. Furthermore, indicators related to the diagnosis of DGE, such as postoperative gastric tube reset, which may amplify the predictive power of the model, were also excluded. Additionally, indicators without potential clinical significance based on clinical experience and previous reports, such as nursing methods, or those with missing data ≥10%, were also excluded. Figure 1 presents a flowchart of the data screening and analysis. The design, validation and reporting of this clinical prediction model followed the transparent reporting of a multivariable prediction model for individual prognosis or diagnosis (TRIPOD) guidelines of the multivariable prediction model.20 The study exclusively utilized non-identifiable pre-existing data, and as a result, it was determined to be exempt from the requirement for informed consent procedures. This exemption was granted in accordance with the Declaration of Helsinki and the Ethical Guidelines for Clinical Studies (No. P-2021-1230). This study was approved by the Ethics Committee of Chinese NCC (No. 17-168/1424). This retrospective study was registered with ResearchRegistry.com (Unique Identification Number: researchregistry8530). Data has been reported in line with STROCSS 2021 criteria.21
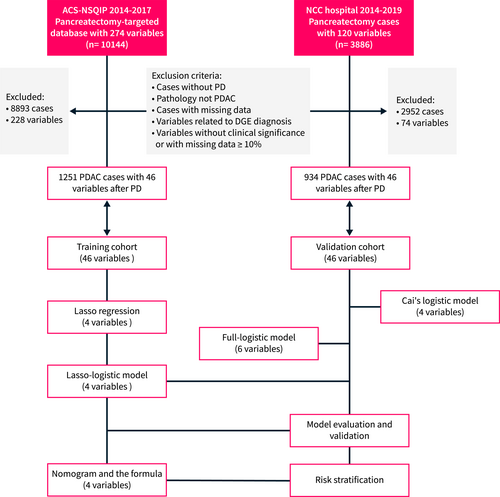
Study flowchart. DGE delayed gastric emptying. DGE is defined according to ISGPS 2007. PD, pancreatoduodenectomy; PDAC, pancreatic ductal adenocarcinoma.
Definitions and indicators
DGE is defined according to the 2007 definition by the International Study Group of Pancreatic Surgery (ISGPS).4 POPF is defined based on the 2016 ISGPS definition.22 According to these definitions, both DGE and POPF are classified into three grades: A, B, and C. Grade A is typically not clinically significant. Therefore, in this study, DGE and POPF refer to clinically relevant grades B and C. Since only a small number of patients were classified as grade C (Table 1; Figure S2a,b), further subclassification was not performed during the modeling process. In light of the lack of broad consensus on the definitions of primary and secondary DGE, we did not stratify DGE in this manner. The definitions of POPF and DGE in ACS-NSQIP are consistent with ISGPF (https://www.facs.org/media/vcdilnwc/pt_nsqip_puf_userguide_2017.pdf). The study cohort consisted of a total of 46 perioperative indicators, which included 20 preoperative variables, six intraoperative variables, and 20 postoperative variables. The extent of lymphadenectomy for the study cohort followed the 2014 ISGPS guideline.23 The specific indicators are shown in Table 1. Furthermore, the predictors included in Cai et al.'s model10 were determined based on the relevant literature.
| Perioperative variables | Training cohort | Validation cohort | p-value | |
|---|---|---|---|---|
| Total | 1251 | 934 | ||
| Preoperative parameters | Age, mean (SD), y | 65.8 (10.5) | 65.7 (10.3) | 0.846 |
| Gender (%) | 0.648 | |||
| Female | 599 (47.9) | 438 (46.9) | ||
| Male | 652 (52.1) | 496 (53.1) | ||
| BMI, mean (SD), kg/m2 | 27.2 (5.8) | 27.2 (5.9) | 0.825 | |
| Diabetes (%) | 0.920 | |||
| None | 916 (73.2) | 682 (73) | ||
| Noninsulin dependent | 149 (11.9) | 118 (12.6) | ||
| Insulin-dependent | 186 (14.9) | 134 (14.3) | ||
| History of severe COPD (%) | 0.822 | |||
| No | 1192 (95.3) | 888 (95.1) | ||
| Yes | 59 (4.7) | 46 (4.9) | ||
| Hypertension requiring medication (%) | 0.960 | |||
| No | 584 (46.7) | 435 (46.6) | ||
| Yes | 667 (53.3) | 499 (53.4) | ||
| >10% weight loss (within 6 months) (%) | 0.824 | |||
| No | 962 (76.9) | 722 (77.3) | ||
| Yes | 289 (23.1) | 212 (22.7) | ||
| Preoperative obstructive jaundice (%) | 0.564 | |||
| No | 479 (38.3) | 369 (39.5) | ||
| Yes | 772 (61.7) | 565 (60.5) | ||
| Preoperative biliary stent (%) | 0.495 | |||
| No | 382 (30.5) | 298 (31.9) | ||
| Yes | 869 (69.5) | 636 (68.1) | ||
| Chemotherapy (within 90 days) (%) | 0.705 | |||
| No | 884 (70.7) | 653 (69.9) | ||
| Yes | 367 (29.3) | 281 (30.1) | ||
| Radiation therapy (within 90 days) (%) | 0.910 | |||
| No | 1047 (83.7) | 780 (83.5) | ||
| Yes | 204 (16.3) | 154 (16.5) | ||
| Preoperative serum creatinine, mean (SD), mg/dL | 0.8 (0.3) | 0.8 (0.3) | 0.621 | |
| Preoperative serum albumin, mean (SD), g/dL | 3.7 (0.6) | 3.7 (0.6) | 0.714 | |
| Preoperative total bilirubin, mean (SD), mg/dL | 2.1 (2.9) | 2.1 (2.9) | 0.902 | |
| Preoperative SGOT, mean (SD), U/L | 55.8 (65.2) | 54.8 (62.9) | 0.718 | |
| Preoperative alkaline phosphatase, mean (SD), U/L | 205.6 (171.1) | 206.8 (172.6) | 0.869 | |
| Preoperative WBC, mean (SD), 109/L | 7.3 (2.7) | 7.3 (2.8) | 0.503 | |
| Preoperative hematocrit, mean (SD), vol% | 36.8 (4.8) | 36.9 (4.8) | 0.910 | |
| Preoperative platelet count, mean (SD), 109/L | 256.1 (99.9) | 254.7 (98.4) | 0.743 | |
| ASA classification (%) | 0.704 | |||
| 1 | 2 (0.2) | 2 (0.2) | ||
| 2 | 250 (20) | 189 (20.2) | ||
| 3 | 936 (74.8) | 700 (74.9) | ||
| 4 | 63 (5) | 43 (4.6) | ||
| Intraoperative parameters | Total operation time, mean (SD), min | 390.2 (125.5) | 391.9 (126.9) | 0.758 |
| Operative approach (%) | 0.671 | |||
| Open | 1134 (90.6) | 854 (91.4) | ||
| Laparoscopic | 64 (5.1) | 42 (4.5) | ||
| Robotic | 46 (3.7) | 32 (3.4) | ||
| Hybrid | 7 (0.6) | 6 (0.6) | ||
| Pancreatic reconstruction (%) | 0.635 | |||
| Pancreaticojejunal duct-to-mucosal | 1136 (90.8) | 855 (91.5) | ||
| Pancreaticogastrostomy | 18 (1.4) | 10 (1.1) | ||
| Pancreaticojejunal invagination | 97 (7.8) | 69 (7.4) | ||
| Pylorus-preserving PD (%) | 0.936 | |||
| No | 1206 (96.4) | 901 (96.5) | ||
| Yes | 45 (3.6) | 33 (3.5) | ||
| Gastrojejunostomy or duodenojejunostomy (%) | 0.769 | |||
| Uncertain | 35 (2.8) | 22 (2.4) | ||
| Antecolic fashion | 878 (70.2) | 658 (70.4) | ||
| Retrocolic fashion | 338 (27) | 254 (27.2) | ||
| Vascular resection (%) | 0.997 | |||
| No | 939 (75.1) | 701 (75.1) | ||
| Yes | 312 (24.9) | 233 (24.9) | ||
| Postoperative parameters | Highest drain amylase (POD2-30), mean (SD), IU | 1651.7 (8845.9) | 1578.9 (7890.7) | 0.840 |
| Days to pancreatic drain removal, mean (SD), d | 8.1 (5.9) | 8.1 (5.7) | 0.967 | |
| Wound infection (%) | 0.966 | |||
| No | 1115 (89.1) | 833 (89.2) | ||
| Yes | 136 (10.9) | 101 (10.8) | ||
| Deep surgical site infection (%) | 0.921 | |||
| No | 1148 (91.8) | 856 (91.6) | ||
| Yes | 103 (8.2) | 78 (8.4) | ||
| Wound disruption (%) | 0.655 | |||
| No | 1240 (99.1) | 924 (98.9) | ||
| Yes | 11 (0.9) | 10 (1.1) | ||
| Pneumonia after surgery (%) | 0.864 | |||
| No | 1219 (97.4) | 909 (97.3) | ||
| Yes | 32 (2.6) | 25 (2.7) | ||
| Pulmonary embolism (%) | 0.639 | |||
| No | 1234 (98.6) | 919 (98.4) | ||
| Yes | 17 (1.4) | 15 (1.6) | ||
| Renal insufficiency/failure (%) | 0.935 | |||
| No | 1242 (99.3) | 927 (99.3) | ||
| Yes | 9 (0.7) | 7 (0.7) | ||
| Urinary tract infection (%) | 0.777 | |||
| No | 1215 (97.1) | 909 (97.3) | ||
| Yes | 36 (2.9) | 25 (2.7) | ||
| Myocardial infarction (%) | 0.935 | |||
| No | 1242 (99.3) | 927 (99.3) | ||
| Yes | 9 (0.7) | 7 (0.7) | ||
| Bleeding transfusion (%) | 0.619 | |||
| No | 969 (77.5) | 715 (76.6) | ||
| Yes | 282 (22.5) | 219 (23.4) | ||
| DVT (%) | 0.896 | |||
| No | 1215 (97.1) | 908 (97.2) | ||
| Yes | 36 (2.9) | 26 (2.8) | ||
| Sepsis/septic shock (%) | 0.764 | |||
| No | 1142 (91.3) | 856 (91.6) | ||
| Yes | 109 (8.7) | 78 (8.4) | ||
| Reoperation (%) | 0.862 | |||
| No | 1198 (95.8) | 893 (95.6) | ||
| Yes | 53 (4.2) | 41 (4.4) | ||
| Wound closure (%) | 0.760 | |||
| All | 1246 (99.6) | 931 (99.7) | ||
| Not all | 5 (0.4) | 3 (0.3) | ||
| Pancreatic fistula (%)a | 0.915 | |||
| No | 1122 (89.7) | 839 (89.8) | ||
| Yes | 129 (10.3) | 95 (10.2) | ||
| Bile leakage (%) | 0.863 | |||
| No | 1148 (91.8) | 859 (92) | ||
| Yes | 103 (8.2) | 75 (8) | ||
| Delayed gastric emptying (%)b | 0.855 | |||
| None/Grade A | 1067 (85.3) | 794 (85) | ||
| Grade B | 164 (13.1) | 125 (13.4) | ||
| Grade C | 20 (1.6) | 15 (1.6) | ||
| T stage (%)c | 0.448 | |||
| Tis | 15 (1.2) | 11 (1.2) | ||
| T1 | 91 (7.3) | 61 (6.5) | ||
| T2 | 112 (9) | 79 (8.5) | ||
| T3 | 988 (79) | 748 (80.1) | ||
| T4 | 44 (3.5) | 34 (3.6) | ||
| Tx | 1 (0.1) | 1 (0.1) | ||
| N stage (%)c | 0.643 | |||
| N0 | 423 (33.8) | 325 (34.8) | ||
| N1 | 827 (66.1) | 608 (65.1) | ||
| Nx | 1 (0.1) | 1 (0.1) |
- Abbreviations: COPD, chronic obstructive pulmonary disease; DVT, deep vein thrombosis; PD, pancreaticoduodenectomy.
- a Based on the 2016 International Study Group of Pancreatic Surgery (ISGPS) definition.
- b Based on the 2007 ISGPS definition.
- c Based on the 8th edition of the AJCC staging system.
Statistical analysis
All statistical analyses were performed using R software (version 4.0.5). The mean (SD) is reported for quantitative variables, while the count (%) is reported for categorical variables. The R package compareGroups was used to analyze the differences in baseline data between the two cohorts. According to the latest risk assessment tool PROBAST, binary or multiclassification conversion of quantitative variables may lose significant information.24 Therefore, this study did not perform binary or multiclassification transformations on quantitative variables, even though their relationship with the outcome variable may be nonlinear. Similarly, univariate analysis was not employed in this study because it did not take into account multivariate correction. Therefore, loss of some essential variables or finding spurious associations could occur.24 Lasso regression is a reliable variable screening method. It performs a penalty regression on all variable coefficients so that relatively unimportant independent variable coefficients are gradually compressed to zero and thus excluded from the model.25 Therefore, Lasso regression can address issues of variable collinearity while avoiding model overfitting and has apparent advantages in screening high-dimensional variables.26 In this study, Lasso regression was used to initially screen variables, and then logistic regression was used to establish a multivariate model. We referred to this method as Lasso-logistic regression.12 Finally, a predictive nomogram of DGE was developed based on the logistic model, and the polynomial formula was extracted by the R nomogram Ex package. The optimal Cutoff function was used to determine the thresholds for the two risk stratifications of the model.27 Model similarity evaluation was performed using the likelihood ratio test. The Akaike information criterion (AIC) and Hosmer and Lemeshow test were used to evaluate the model fitting. The model performance was evaluated using the AUC and Misclass error. The net benefit of the model was evaluated using the decision curve analysis (DCA). The predictive ability of the model was evaluated using a clinical impact curve. p < 0.05 was considered to be statistically significant.
Model visualization
The code for data modeling and model visualization is available at https://github.com/ZongtingCode/DGERS.
RESULTS
Clinical research cohort features
The training cohort included 1251 PDAC patients who underwent PD in the ACS-NSQIP database from 2014 to 2017. The external validation cohort included 934 PDAC patients after PD in a Chinese NCC hospital from 2014 to 2019. The study cohort consists of PDAC cases originating from the pancreatic head or uncinate process. In the training cohort, there were 652 males and 599 females with an average age of 65.8 years and a mean BMI of 27.2 kg/m2. In the external validation cohort, there were 496 males and 438 females, with an average age of 65.7 years and a mean BMI of 27.2 kg/m2. Approximately 14.7% of patients in the training cohort (184/1251) developed DGE after surgery, whereas this rate was 15.0% (140/934) in the validation cohort. The proportion of clinically relevant DGE (grades B/C) associated with abdominal complications such as pancreatic fistula, bile leakage, bleeding, or sepsis/septic shock was 70.7% (130/184) in the training cohort and 72.9% (102/140) in the validation cohort. In both the training and validation cohorts, the median value of “days to pancreatic drain removal” was 6 (95% confidence interval: 2–26 and 2–25, respectively). The baseline characteristics of the two cohorts of PDAC patients treated with PD are summarized in Table 1. The two cohorts were well-matched. Intraoperative indicators, including surgical techniques and operation time, showed no significant differences between the cohorts (p > 0.05).
DEVELOPMENT OF A NOVEL PREDICTION MODEL
Lasso regression for variable screening
Given its effectiveness in handling large-scale variables, Lasso regression was employed in the training cohort for variable screening. As shown in Figure 2, the two vertical dashed lines in the chart represent the log λ of the minimum mean squared error (MSE; left dashed line) and the log λ of a standard error (SE) of the minimum distance (right dashed line). If there is an overfitting problem, then the distance from the minimum to the SE position is a very good starting point for solving the problem.28 The model variables were reduced to 17 when log(λ) reached the minimum MSE, and 4 when it reached a standard error (1-fold SE) of the minimum distance, as determined by the Lasso internal cross-validation (10 k-fold; Figures 2a,b; Table S1). Although the AUC values of the model did not show significant differences between the two cutoffs (Figure 2c), we preferred to choose the point of 1-fold SE of the minimum distance (best λ value = 0.04), as it resulted in a simpler and more explanatory model with fewer variables. Four variables were ultimately selected using Lasso regression (Table 2): days to pancreatic drain removal, pancreatic fistula, sepsis/septic shock, and reoperation.
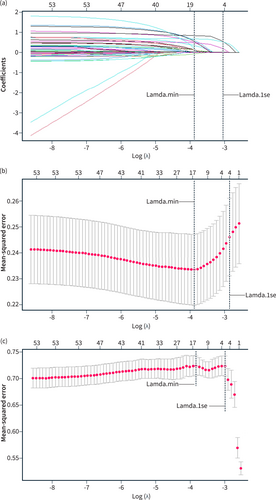
Lasso regression curve. (a) The curve of the regression coefficient versus log (λ); (b) the curve of MSE versus log (λ); (c) the curve of AUC versus log (λ). Lamda.min means the cutoff point that MSE takes the minimum value; Lamda.1 se means that MSE takes 1 × standard error.
| Best λ value | Variables in lasso regression | Coefficient | OR |
|---|---|---|---|
| 0.04 | Days of pancreatic drain removal | 1.54E-02 | 1.02 |
| Pancreatic fistulaa | 5.91E-01 | 1.81 | |
| Sepsis/septic shock | 3.05E-01 | 1.36 | |
| Reoperation | 6.98E-01 | 2.01 |
- Abbreviation: OR, odds ratio.
- a Based on the 2016 International Study Group of Pancreatic Surgery (ISGPS) definition.
Development of a novel DGERS based on lasso-logistic regression
Next, we incorporated the four variables screened by Lasso regression into logistic regression for further modeling. The results showed that all four variables were identified as independent risk factors for DGE (p < 0.001). There was no evidence of multicollinearity or significant interaction effects among the remaining four variables (VIF <2; Table 3, Figure S2c,d), and the modeling was successful. We then developed a nomogram for predicting DGE based on Lasso-logistic regression (Figure 3a). The nomogram includes four predictive indicators: days to pancreatic drain removal, sepsis/septic shock, reoperation, and pancreatic fistula. Considering the limitations on the scale of the nomogram axis, we hardly obtained an accurate scale through the number of axes, especially for quantitative variables. Thus, we cannot calculate the accurate probability, which limits the wide application of the nomogram. Therefore, we further extracted the polynomial formula of the predictors to calculate the exact point of each indicator and the exact risk probability corresponding to the total points (Figure 3b). The risk of DGE was calculated using the following formula:
| Lasso-logistic model | VIFa | OR | 95% CI | p value |
|---|---|---|---|---|
| Days of pancreatic drain removal | 1.20 | 1.05 | 1.02–1.08 | <0.001 |
| Pancreatic fistulab | 1.22 | 2.61 | 1.65–4.12 | <0.001 |
| Sepsis/septic shock | 1.05 | 2.46 | 1.52–3.91 | <0.001 |
| Reoperation | 1.03 | 4.16 | 2.27–7.57 | <0.001 |
- Abbreviations: OR, odds ratio; VIF, variance inflation factor.
- a VIF ≥2, collinearity may exist between independent variables.
- b Based on the 2016 international study group of pancreatic surgery (ISGPS) definition.
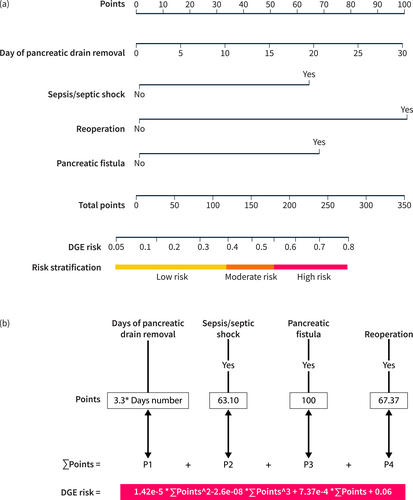
The DGE nomogram based on the Lasso-logistic regression model. (a) Nomogram: the point assignment for each variable to calculate the predicted probability of DGE, the corresponding three risk stratifications are labeled at the bottom; (b) Risk calculation formula: the value of the variable corresponds to different points, and the risk value can be obtained by bringing the sum of the points into the risk formula.
DGE risk = 1.42 × 10^−5 × (∑ Points) ^2–2.6 × 10^−8 × (∑ Points) ^3 + 7.37 × 10^−4 × (∑ Points) + 0.06.
where ∑ Points represents the sum of points based on relevant clinical factors.
To further stratify the risk of DGE, we applied the optimalCutoff function to calculate the binary risk stratification threshold in the training cohort. The optimal-cutoff value was determined to be 0.596. When the threshold was set to an integer value of 0.5, the model demonstrated good predictive ability within two specific subgroups (Figures 4a; S3a). Therefore, we initially set the threshold at 0.5 as the cutoff value to differentiate between the high-risk and low-risk groups. We named this cutoff value as the “max-cutoff” value. Subsequently, within the low-risk group, we identified an additional integer cutoff value, referred to as the “min-cutoff” value, to further stratify the original low-risk group into two subgroups. Remarkably, when the min-cutoff value was set to 0.3, the model displayed equally good predictive ability in these two specific subgroups (Figures 4b; S3b–d). Finally, we utilized the overlap of the two thresholds to create three risk stratifications: the low-risk, intermediate-risk, and high-risk groups. These groups corresponded to predicted probabilities of ≤0.3, >0.3 and ≤ 0.5, and >0.5, respectively. We refer to this risk stratification approach as the DGERS. The ROC curves of the models for each risk group in the training cohort demonstrated significant discriminative ability across all three risk groups. The AUC values for the low-, moderate-, and high-risk groups were 0.69, 0.63, and 0.74, respectively, with particularly prominent performance in the low-risk and high-risk groups (Figure 4b). Moreover, we conducted further analysis of the actual incidence of DGE in each stratified group, confirming the effectiveness of the DGERS method in the training cohort (Figure 4c; Table S2).
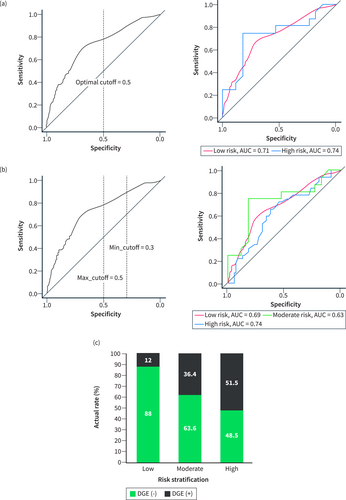
Establishment and evaluation of the DGERS in the training cohort. (a) ROC curves of the model within the binary risk stratification group using an optimal cutoff value of 0.5 as the threshold. (b) ROC curves of the model within the triple risk stratification group using a max_cutoff value of 0.5 and a min_cutoff value of 0.3 as the thresholds. (c) Actual incidence of DGE in the triple risk stratification group. DGERS, delayed gastric emptying risk stratification.
Evaluation and external validation of the novel model
The conventional method of variable screening typically involves univariate analysis or full variable inclusion. However, in this study, we employed a different approach by using Lasso-logistic regression for preliminary variable screening. Since univariate analysis is not recommended by the latest PROBAST as previously described,24 we used the full variable inclusion method as a comparative model, referred to as the full-logistic model (Table S3). In addition, we also compared the DGE nomogram model reported by Cai et al.,10 which is referred to as Cai's logistic model. The analysis results (Table 4) showed that the above three models all had the predictive ability (p > 0.05, Hosmer and Lemeshow test; Figure 5a–c) in the validation cohort. There was a significant difference between the Lasso-logistic model and Cai's logistic model (p < 0.001, Likelihood ratio test). Compared with Cai's logistic model, the Lasso-logistic model had better model fitting (AIC, 955.31 vs. 1028.50), higher model performance (AUC, 73.4% vs. 59.2%), and there was no difference in the number of model variables and misclass error. Therefore, the Lasso-logistic model was superior to Cai's logistic model and the prediction efficiency of the model is acceptable. There was no significant difference between the Lasso-logistic model and the Full-logistic model (p = 0.416, Likelihood ratio test). However, the Lasso-logistic model had fewer independent variables (4 vs. 6) and slightly better predictive power than Full-logistic model (AUC, 73.4 vs. 71.8), so the Lasso-logistic model had better clinical operability and convenience (Table 4). These features are consistent with internal validation in the training cohort (Figure 4a–c). The DCA curve (Figure 6a) demonstrates that the net benefit of the Lasso-logistic model is significantly higher than that of Cai's logistic model in the threshold probability range of 0.18–0.93. However, there was no significant difference in net benefit between the Lasso-logistic model and the full logistic model. The relationship between the predicted DGE positive number and the actual positive number of the Lasso-logistic model at different threshold probabilities (with a cardinality of 1000) is depicted in Figure 6b. The Lasso-logistic model exhibits superior performance compared to the other two models in terms of predictive power and the number of variables. This indicates that the Lasso-logistic model has strong clinical applicability due to its improved accuracy and efficiency. To validate the discriminatory power of this risk stratification method, we plotted the ROC curves of the models for each risk group in the validation cohort. The results demonstrated a significant discriminative ability across all three risk groups. The AUC values for the low-, moderate-, and high-risk groups were 0.7, 0.61, and 0.74, respectively, with particularly strong performance observed in the low-risk and high-risk groups (Figure 6c). Similarly, the actual incidence of DGE in each stratified group confirmed the effectiveness of the DGERS method in the validation cohort (Figure 6d; Table S2).
| Models | Variable inclusion methods | Independent variables number (p < 0.05) | AIC | Misclass error (%) | AUC (%) | Hosmer and lemeshow test (p-value) | alikelihood ratio test (p-value) |
|---|---|---|---|---|---|---|---|
| Lasso-logistic model | Lasso screening | 4 | 955.31 | 14.99 | 73.4 | 0.743 | NA |
| Full-logistic model | Full variables | 6 | 959.38 | 14.45 | 71.8 | 0.980 | 0.416 |
| Cai's logistic model | Reference10 | 4 | 1028.50 | 14.99 | 59.2 | 0.840 | <0.001 |
- Note: AIC is a standard to measure the goodness of model fit. The smaller the AIC value, the better the model.
- Abbreviations: AIC, akaike information criterion; AUC, area under ROC curve.
- a Compared with Lasso-logistic model.
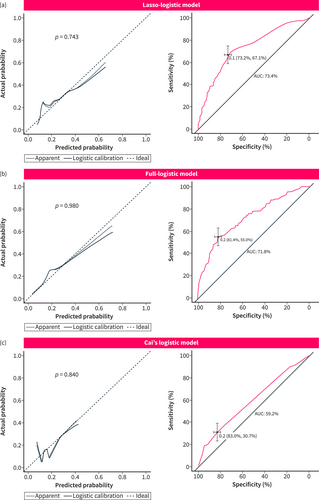
Calibration and ROC curves of three different models in the validation cohort. (a) Lasso-logistic model; (b) Full-logistic model; (c) Cai's logistic model. The left column shows the calibration curve, and the right column shows the ROC curve. The p value comes from the Hosmer and Lemeshow goodness of fit (GOF) test. p > 0.05 means that the model fits well. The best cutoff value, 95% CI and AUC value are marked in the figure. AUC is the area under the ROC curve.
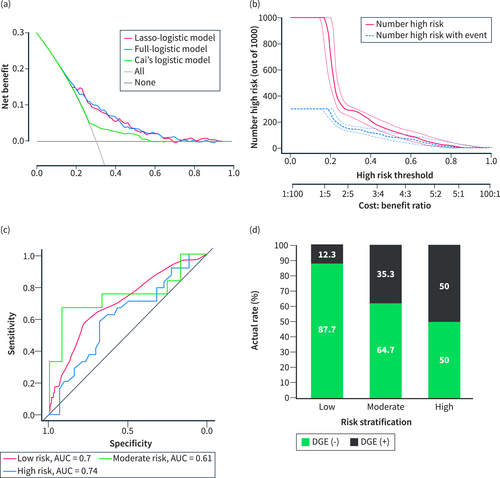
Evaluation of different models in the validation cohort. (a) Decision curve analysis (DCA) of three different models. (b) Clinical impact curve of the Lasso-logistic model. The red curve represents the number predicted using the Lasso-logistic model as DGE under the threshold probability. The blue curve represents the number that actually occurs DGE under the threshold probability. (c) ROC curves of the DGERS model within the triple risk stratification group using the max_cutoff value and min_cutoff value as the thresholds. (d) Actual DGE incidence in the triple risk stratification group of DGERS. DGERS, delayed gastric emptying risk stratification.
DISCUSSION
DGE has always been one of the challenging complications after PD,29 which greatly threatens the quality of life and survival of patients with PDAC(8, 9). Developing a precise prediction model for DGE could help provide proactive strategies for preventive management and early intervention, reducing its incidence and improving prognosis. In this study, a total of 46 perioperative variables that may affect DGE were included, and a reliable Lasso-logistic regression method was used to identify independent risk factors for DGE, including pancreatic leakage, sepsis/septic shock, reoperation, and days to pancreatic drain removal. A simple nomogram was developed for predicting the risk of DGE, and a novel DGERS was constructed. This model provides dynamic and accurate DGE risk prediction and stratification for patients with PDAC after PD. Moreover, the model incorporates a limited number of variables, making it suitable for a wide range of clinical applications. Although they were all postoperative indicators, it is clear that all indicators have predictive value before the DGE diagnosis is confirmed.
Previous research on DGE has primarily focused on analyzing its risk factors.30 Predictive models for DGE are scarce. The few existing models suffer from limitations such as small training cohorts, low performance, lack of model evaluation, and absence of external validation (Table S4). Therefore, to streamline the analysis, this study selected Cai's logistic model as a representative example of previous models for evaluation, based on its superior overall performance. The evaluation and validation analyses demonstrated that the novel DGERS outperformed other traditional models in terms of model complexity, predictive performance, and interpretability, highlighting its potential advantages for clinical application.
The pathogenesis of DGE remains incompletely understood and may be related to pyloric spasm triggered by vagal denervation, ischemia or congestion due to vascular compromise, and disturbances in gastrointestinal hormones.4 POPF has been confirmed as an independent risk factor for DGE by many studies,15, 16 and the severity of POPF was positively associated with a high incidence of DGE.13, 14 POPF may lead to a higher concentration of amylase in the peritoneal effusion. Failure of timely and sufficiently unobstructed drainage leads to the destruction of the gastric wall, including blood vessels and nerves,4 a critical outcome of DGE. Similarly, sepsis as a risk factor for DGE was indicated in multiple studies.15, 17 A possible explanation is that sepsis or septic shock often suggests severe infection in patients. The formation of peri-gastric abscesses induced by intra-abdominal infection may lead to dysrhythmic gastric peristalsis.15 In addition, endotoxins or inflammation induced by sepsis may promote DGE by inhibiting vagal nerve excitation.31, 32 The relationship between reoperation and DGE is also a concern. The retrospective study of Kollmar et al.13 and Parmar et al.17 indicated that reoperation was significantly correlated with the severity of postoperative DGE. Reoperation increases the risk of abdominal infection, traumatic stress and infection, which further aggravates the disorder of the gastric rhythm and complicates the pathophysiological concerns after an operation; therefore, the increased DGE incidence is reasonable. Therefore, this finding suggests that reducing abdominal complications such as pancreatic fistula, sepsis/septic shock, and reoperation is an effective method to decrease the incidence of DGE. In addition, given the independent association of DGE with POPF and sepsis/septic shock, the occurrence of DGE can also serve as an early warning sign for subclinical POPF and intra-abdominal infections. Further tests and imaging examinations are particularly necessary for these patients.
Notably, this is the first study to find that days to pancreatic drain removal after PD in patients with PDAC is also an independent risk factor for DGE. The time to drain removal is positively correlated with the risk of DGE. A possible explanation is that postoperative complications such as POPF or infection prolong the time to pancreatic drain removal, and these factors are related to DGE occurrence. This explanation seems reasonable, but in theory, after the modeling process of Lasso penalized regression and later logistic regression, the collinear variables related to DGE have been removed. However, two variables, POPF and sepsis, were still included in the final model, suggesting a POPF- and a sepsis-independent association between the time to pancreatic drain removal and DGE. Recently, multiple high-quality prospective clinical and RCT studies have provided further evidence that early pancreatic drain removal in PD patients, when safe criteria are met, can prevent abdominal complications and improve patient outcomes.33-35 The 2019 ERAS guidelines for PD recommend removal of pancreatic drains within 72 h for patients with pancreatic drain amylase <5000 U/L on the first postoperative day,7 which is consistent with our study that early removal of the pancreatic drain after surgery may help reduce the DGE incidence in the absence of POPF and sepsis. Therefore, the time to pancreatic drain removal can also be used as an independent objective predictor of DGE in patients with PDAC. This finding underscores the importance and clinical significance of early pancreatic drain removal after PD.
Regrettably, the Cai et al.10 model and several earlier studies13, 15 indicated that pylorus-preserving pancreaticoduodenectomy (PPPD) was an independent risk factor for DGE, but our prediction model did not find this correlation. Moreover, this study did not show that surgical techniques such as pancreaticojejunal duct-to-mucosal anastomosis and antecolic approaches for gastrojejunostomy/duodenojejunostomy independently affect the incidence of DGE, which is consistent with previous findings.36 However, studies indicating that non-pylorus-preserving, duct-to-mucosal anastomosis, and antecolic techniques may reduce PD complications37-39 could potentially influence surgical decision-making. This might explain the high prevalence of these techniques in two international cohorts. Therefore, further research is needed to confirm the relationship between different surgical techniques and DGE occurrence.
Despite its strengths, this study has some limitations. Firstly, the criteria for the timing of pancreatic drain removal may vary among different doctors, even though it is theoretically based on factors such as the absence of POPF or abdominal infection. This subjectivity in practice could introduce variability in the results. Secondly, although the novel model was developed and validated using international cohorts, it is important to note that surgical approaches and postoperative management may differ among patients. Therefore, the generalizability of the results to other surgical centers with different perioperative management strategies remains uncertain. Furthermore, it is crucial to consider that this study is multicenter and retrospective in nature. As a result, some potentially important variables may be missing and were not included in the analysis. Additionally, missing data were excluded from the analysis. Consequently, selection bias might be inevitable. Despite the model's improved performance in predicting DGE, it has several shortcomings that need to be addressed: (1) selection bias may limit the model's predictive accuracy and generalizability, (2) reliance on postoperative indicators restricts its preoperative application, and (3) the complexity of diagnosing DGE subtypes and POPF may reduce its usability. Therefore, these findings must be interpreted with caution. Further validation through prospective, multicenter clinical studies with larger patient populations is necessary to improve the model's efficacy and generalizability. Nonetheless, this study is notable for using a large dataset and numerous variables from the multicenter ACS-NSQIP database for modeling and external validation in an international cohort. Importantly, the study emphasizes the crucial role of individualized strategies for the preoperative prevention of pancreatic fistula, sepsis/septic shock, reoperation, and early postoperative removal of the pancreatic drain in reducing the incidence of DGE.
CONCLUSIONS
In this study, we have identified several perioperative factors that are independently associated with an increased risk of DGE in patients with PDAC who underwent PD. These factors include days to pancreatic drain removal, pancreatic fistula, sepsis/septic shock, and reoperation. Based on these findings, we have developed a personalized and straightforward model called the DGERS to predict the likelihood of DGE in each patient. This model utilizes four easily accessible indicators and enables surgeons to proactively identify and predict DGE. The DGERS model provides a valuable tool for clinicians to assess the risk of DGE and facilitates the implementation of appropriate measures to optimize patient outcomes.
AUTHOR CONTRIBUTIONS
Zongting Gu: Conceptualization; data curation; formal analysis; methodology; software; visualization; writing—original draft. Yongxing Du: Conceptualization; data curation; methodology; software; visualization; writing—original draft. Yunjie Duan: Conceptualization; data curation; methodology; visualization; writing—original draft. Xiaohao Zheng: Formal analysis; methodology; software; visualization. Chengfeng Wang: Conceptualization; data curation; methodology; supervision; writing—review & editing. Jianwei Zhang: Conceptualization; supervision; writing—review & editing.
ACKNOWLEDGMENTS
We thank American Journal Experts (AJE) for assisting in the preparation of this manuscript. This work was supported by National Natural Science Foundation of China (No. 81972314, 81802463), Chinese Academy of Medical Sciences Innovation Fund for Medical Sciences (CIFMS, 2022-I2M-1–010) and Beijing Physician Scientist Training Project (BJTSPT-2024-11).
CONFLICT OF INTEREST STATEMENT
All other authors declare that they have no competing interests.
ETHICS APPROVAL
The study procedures were approved by the Ethics Committee of Chinese NCC (No. 17-168/1424).
Open Research
DATA AVAILABILITY STATEMENT
An open-source version of the code for the model can be accessed at the following URL: https://github.com/ZongtingCode/DGERS. The datasets analyzed during the current study are available in the NSQIP repository https://www.facs.org/quality-programs/acs-nsqip/participant-use. Further inquiries can be directed to the corresponding author. The data that support the findings of this study are available from the corresponding author upon reasonable request.


