Control of Electrostatic Charge Generated during Two-Fluid Spraying of Pure Water Using an Inductive Charging Method†
†This paper is based on Reference [1], which was published in the International Conference Council of Electrical Engineering Conference (2024) ©2024 IEEJ.
Abstract
This study presents a technique designed to prevent electrostatic discharge during the cleaning of semiconductors using a two-fluid spray composed of pure water. The current generated by spraying pure water with a prototype Faraday cage was measured. Furthermore, a shadow Doppler particle analyzer was used to measure the velocity and size of the airborne droplets, clarifying the relationship between the generated current and droplet characteristics. The results confirmed that the current generated during two-fluid spraying exhibits positive polarity and that the droplet charge increases with droplet velocity. We further demonstrated that the charging of pure-water droplets can be controlled by installing an inductive charging element immediately downstream of the pure-water jet. This phenomenon is believed to occur because the electrons induced by the charging element flow through the continuous fluid region along the nozzle wall toward the ground. © 2025 Institute of Electrical Engineers of Japan and Wiley Periodicals LLC.
1 Introduction
In recent years, semiconductor devices have undergone substantial miniaturization, leading to the commercialization of logic integrated circuits with gate lengths of just a few nanometers [1]. In semiconductor chip manufacturing, the cleaning process is critical, as it directly affects product yield [2]. Semiconductor cleaning is typically performed using either batch cleaning [3, 4], in which wafers are immersed in a chemical solution, or single-wafer cleaning, in which wafers are processed individually for resist stripping and particle removal [5]. One tool used in single-wafer cleaning is a two-fluid sprayer, which uses a stream of compressed gas, such as nitrogen, to atomize pure water and spray droplets onto the wafer. However, spraying pure water with a two-fluid sprayer causes electrostatic discharge (ESD), wherein the droplets become electrically charged and may damage the elements of the wafer [6]. Conventional ESD prevention methods include injecting carbon dioxide gas into pure water to reduce its specific resistance or dissolving a small amount of ammonia to produce hydrogenated ammonia water through hydrogenolysis [7]. These methods, however, may not be suitable for certain semiconductor films due to pH sensitivity, and they also involve high operational costs.
In this report, we measured the current generated during two-fluid spraying of pure water using a Faraday cage. We employed a shadow Doppler particle analyzer (SDPA) to measure droplet velocity and size, investigating the relationship between current generation and droplet characteristics. Inductive charging refers to the phenomenon in which a liquid or insulator acquires an electric charge due to the influence of an external electric field or a nearby charged object. To reduce the current without modifying the pure water, such as through the addition of carbon dioxide or ammonia, a custom inductive charging element was installed near the nozzle of the two-fluid sprayer. The results confirmed that the level of charging can be modulated by passing the sprayed droplets through the electric field generated by the inductive charging element.
2 Experimental
2.1 Two-fluid spray
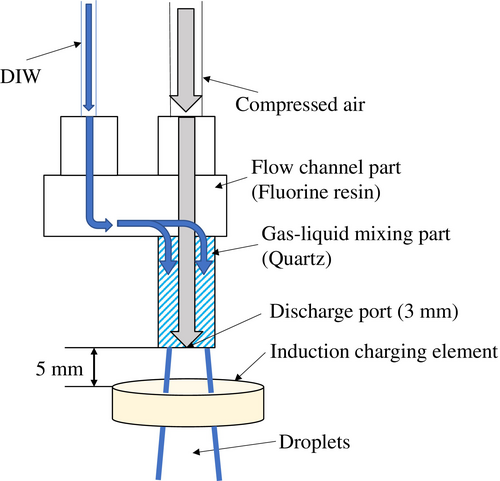
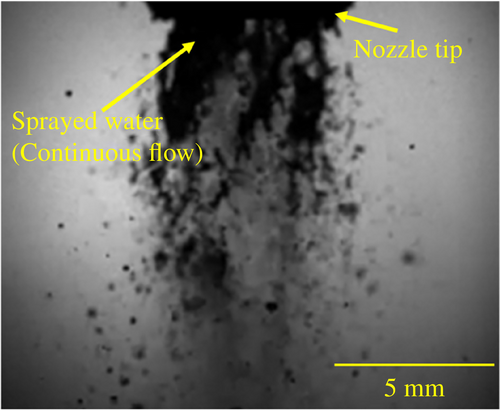
Figure 1 illustrates the structure of the two-fluid spray nozzle. In this nozzle, gas and liquid are mixed, and the inner diameter of the discharge port is 3 mm. Pure water and compressed air are supplied to the gas–liquid mixer at the center of the nozzle via separate channels. Inside the mixer, compressed air flows through the central core, surrounded by a concentric flow of pure water. The mixer component is made of quartz to prevent metal contamination of the pure water, while the remaining wetted parts along the pure-water pathway are constructed from fluoroplastic. To control the charge on the sprayed droplets, an inductive charging device was installed 5 mm below the nozzle tip. Figure 2 shows a high-speed camera image captured immediately after spraying, with an air flow rate of 80 Nl/min and a pure-water flow rate of 100 ml/min. The high-speed camera used was the FASTCAM Mini AX-200 from Photron, operating at a frame rate of 20 000 fps. Pure water sprayed from the nozzle undergoes a transition through three flow regions: [1] the continuous-flow region, where water is discharged as a steady stream; [2] the droplet flow region, where the stream begins to break into droplets; and [3] the diffusion flow region, where the droplets become dispersed and fully separated. Given that the pure water has substantially lower resistance than air, and its charge-relaxation time of ~1.2 × 10⁻⁴ s, we assume that charge transfer occurs primarily in the continuous-flow region. As shown in Fig. 2, this region extends ~7 mm from the jet outlet of the nozzle. Inductive charging—induced by the strong electric field generated by the charging element—occurs exclusively within the continuous-flow region. For droplets that have already separated and passed through the electric field, only internal charge redistribution occurs, and the acquired charge is retained within each droplet.
2.2 Static electricity measurement system
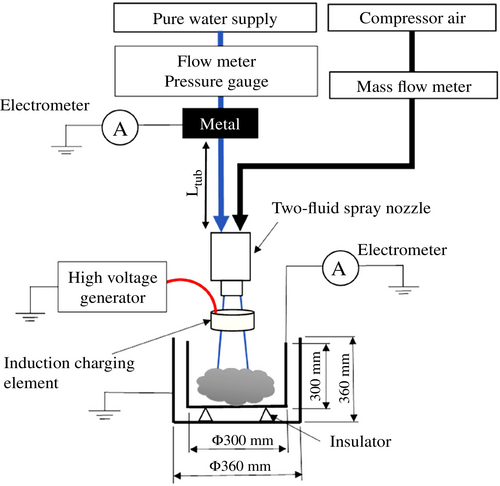
Figure 3 shows the system used to measure the current generated during two-fluid spraying. The cylindrical Faraday cage used for current measurements has an inner diameter and height of 300 mm, and an outer diameter and height of 360 mm. It is constructed from stainless steel. The inner and outer cages are insulated with high-density polyethylene, and the outer cage is specifically designed to shield against external electrical noise. To minimize water splashing inside the inner container, steel wool was placed within the cage. Pure water was produced by sequentially passing tap water through an activated carbon filter, an ion exchange resin, and a final filtration stage. Its specific resistance was maintained at 175 kΩ m or higher, as monitored by a resistivity meter (HORIBA HE-480R). In this setup, the tap water supply is connected to a tap, and the pure-water line is grounded via the resistivity meter. The laboratory environment was not climate-controlled; ambient temperature was ~20°C, and relative humidity was around 35%. A two-fluid spray nozzle was used to atomize the water inside the Faraday cage. The resulting current was measured using an electrometer (ADCMT 8252), which captures minute current levels through an integrating method. In addition to measuring the generated current, several operational parameters were recorded: [1] Pure-water flow rate: clamp-on flowmeter (Keyence FD-XA1); [2] pure-water pressure: pressure gauge (ifm efector PN2094); [3] specific resistance: resistivity meter (HORIBA HE-480R); [4] water temperature: K-type thermocouple; [5] air flow rate: flowmeter (KOFLOC 8550MC); and [6] air pressure: pressure gauge (SMC ISE30A). All measurements were logged using data acquisition systems (NI cDAQ-9208, 9210) with a sampling interval of 0.5 s. The two-fluid spray forms a mixture of air and droplets, and not all droplets are captured by the Faraday cage. Approximately 80% of the sprayed droplets are collected, while the remainder are assumed to remain suspended in the air. Droplet velocity measurements were conducted using SDPA (KANOMAX), which integrates laser Doppler velocimetry with particle sizing. The system uses laser coherence to determine Doppler velocity and shadow-based imaging to estimate particle size [8].
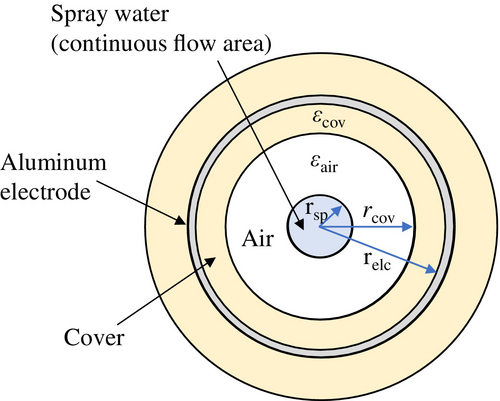
2.3 Design of inductive charging elements
3 Results and Discussion
3.1 Electrostatic characteristics generated during two-fluid spraying
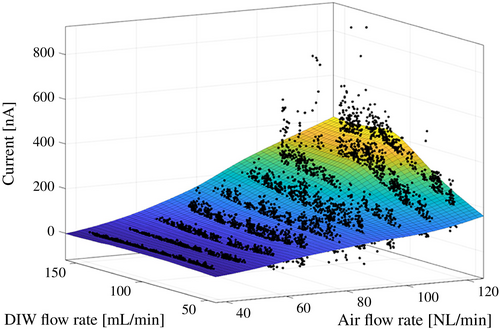
Figure 5 shows the relationship between the generated current and the flow rates of pure water and air. These two variables were selected from seven measured parameters: pure-water flow rate, pure-water pressure, specific resistance, water temperature, air flow rate, air pressure, and generated current. In the figure, black dots represent the measurement points sampled at 0.5-s intervals. The surface overlay is a locally smoothed approximation based on regression of the measured values. The results indicate that the generated current increases with rising air flow rate. When the air flow rate exceeds 100 Nl/min, the current also tends to rise with increasing pure water flow rate.
3.2 Relationship between droplet characteristics and generated static electricity
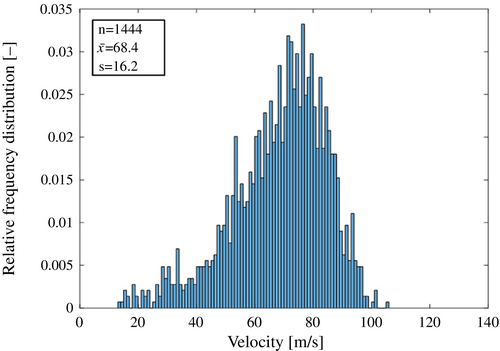
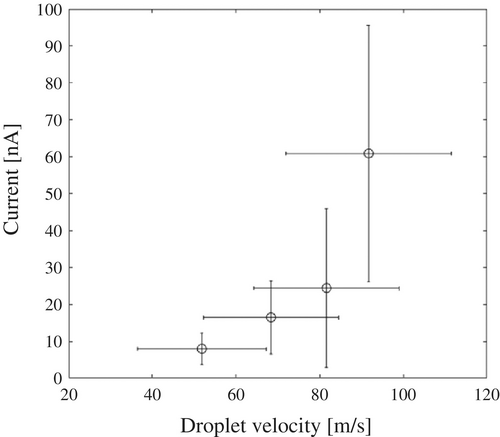
Figure 6 shows the velocity distribution of flying droplets observed during two-fluid spraying at an air flow rate of 50 Nl/min and a pure-water flow rate of 100 ml/min, which includes data from a total of 1444 droplets. The mean droplet velocity, denoted by , was 68.4 m/s, and the standard deviation was 16.2 m/s. Figure 7 illustrates the relationship between the average velocity of flying droplets and the generated current. The results indicate that as droplet velocity increases, the generated current also increases. This trend highlights a critical trade-off: as semiconductor devices continue to shrink in size, achieving higher droplet velocities becomes essential for effective cleaning [5]. However, this also raises the size of ESD, posing a challenge in optimizing cleaning efficiency and device safety.
3.3 Droplet charge
3.4 Effect of controlling the charge of pure-water droplets
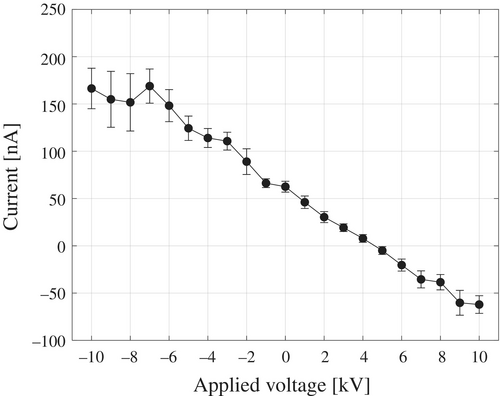
As shown in Fig. 1, an inductive charging device was positioned 5 mm below the tip of the two-fluid spray nozzle to investigate the relationship between the applied voltage and the resulting current. The two-fluid spray was performed under conditions of a pure-water flow rate of 100 ml/min and an air flow rate of 80 Nl/min, yielding an average droplet velocity of 87.8 m/s. The results are presented in Fig. 8. Error bars indicate the SD, calculated from 120 data points measured at 0.5-s intervals. The generated current was linearly proportional to the applied voltage, with a slope of −12.6 nA/kV. When a positive voltage was applied to the inductive charging element, a positive electric field was formed around it, inducing a negative charge in the continuous-flow region of the sprayed pure water. Conversely, applying a negative voltage induced a positive charge in the same. As the water transitioned into the droplet flow region, these induced charges separated during the droplet breakup process, resulting in droplets charged according to the corresponding polarities. Even in the absence of an applied voltage, a current of several tens of nanoamperes was still observed, indicating a potential risk of ESD on semiconductor devices. However, when a voltage of 4.7 kV was applied to the inductive charging element placed 5 mm below the nozzle tip, the generated current dropped to zero.
3.5 Verification of inductive charging
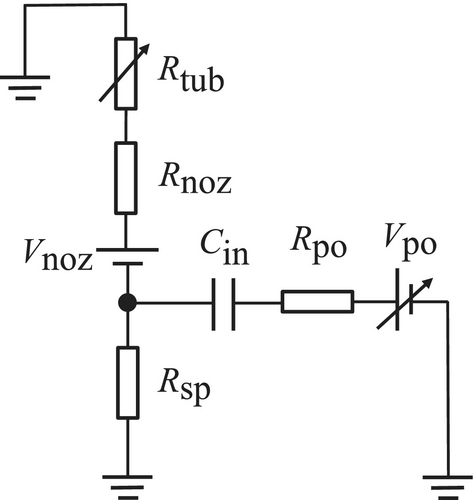
As described in Section 3.1, this potential varies depending on the spray conditions. denotes the voltage applied to the inductive charging electrode and was varied from −10 to +10 kV in this study. represents the series protection resistor of the high-voltage power supply. The stray capacitance is formed between the inductive electrode and the continuous-flow region of pure water inside the nozzle. Although these components are non-contact, the microfarad-level air capacitance permits ionic charge transfer, allowing negative hydroxide (OH−) and positive hydronium (H3O+) ions to drift toward the ground. represents the resistance of the pure water in the spray-side continuous-flow region. Since the resistivity of ambient air (1014–1016 Ω·m) is several orders of magnitude higher, the charge carried by the droplets cannot leak into the air [11]. After impacting the Faraday cage, the ionic charge carried by the droplets is discharged to ground. and represent the pure-water resistance inside the nozzle and the PFA tube, respectively.
Figure 10 shows an image of the interior of the nozzle mixer captured using a high-speed camera. The mixer section, made of quartz, allows visualization of the internal flow. As a result, pure water forms a continuous film along the mixer wall, and an annular flow pattern is observed inside the nozzle. It is assumed that the OH− ions generated by inductive charging migrate toward the ground. By charge conservation, the total charge flowing on the spray side must equal the charge flowing on the nozzle/tube side, as expressed in equation 5.
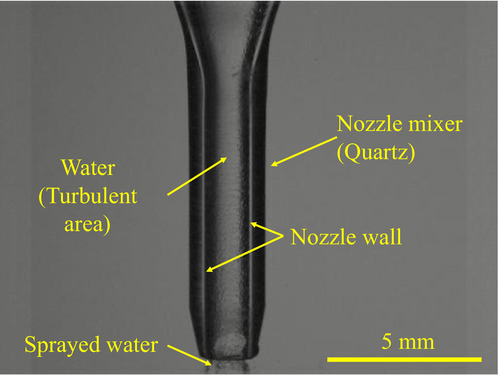
Figure 11 plots the inductive current (associated with and ) and spray current (associated with ) as functions of . Open symbols represent the inductive current; while filled symbols represent the spray current. Circles correspond to = 0 kV, and squares corresponding to = 10 kV. The correction factor K, introduced in (2), is examined in Fig. 11, where the PFA tube length L is converted into the corresponding pure-water resistance . At an applied voltage of 10 kV and , the measured inductive current is 200 nA. Compared with the theoretical value of −50.4 nA, calculated using , this results in an amplified coefficient of ~. As increases, the correction factor K decays in a quasi-exponentially manner, eventually saturating at a residual value of in the high-resistance region (). These data are well fitted by the following empirical equation:
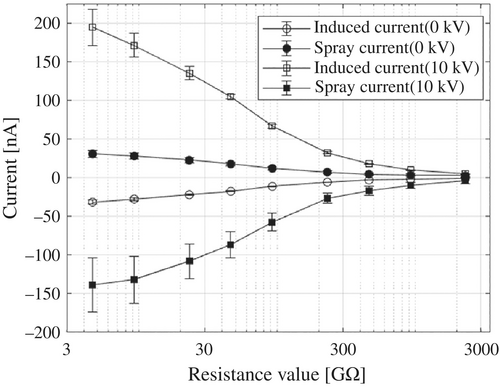
Here, represents the charge-relaxation resistance length, which is determined by the impedance of the conductive path and the hydraulic residence time of the water column. In the low-resistance region, where , charge transfer efficiency is enhanced due to the turbulent expansion of the water–air interface and the bidirectional ion drift, specifically OH− ions migrating toward the tube and H3O+ migrating toward the spray. In contrast, in the high-resistance region, three limiting factors dominate: (i) the high resistance of pure water restricts ion transport (ii) ion recombination occurs within the tube, and (iii) the 80% collection efficiency of the Faraday cage limits the measurable current, causing K to converge toward a residual value . These findings indicate that K is a phenomenological parameter influenced not only by the applied electric field and pure-water flow rate (QDIW), but also by the downstream residence time, which is governed by the resistance of the pure-water column.
4 Conclusions
- The current generated during two-fluid spraying exhibited positive polarity in the nanoampere range and increased with air and pure water flow rates.
- Droplet characteristics measured by SDPA showed that, at a pure-water flow rate of 100 ml/min and air flow rates ranging from 40 to 70 Nl/min, the velocity of flying droplets increased with increasing air flow rate.
- Flying droplets exhibited positive polarity, attributed to an excess of H3O+. The electric charge of a single droplet with a diameter of 39.1 μm was estimated to be approximately 10−16 C, corresponding to around 103 H3O+ per droplet containing approximately 1015 water molecules.
- The inductive charging element was designed to generate a strong electric field near the nozzle tip.
- When pure water was sprayed in the presence of the strong electric field generated by the inductive charging device, the generated current decreased proportionally with increasing applied voltage, with a measured slope of −12.6 nA/kV.
- Inductive charging within the continuous-flow region produced two ionic currents of equal magnitude and opposite polarity—one directed toward the Faraday cage, and the other toward the grounded PFA tube. These currents decayed with increasing tube length and reversed polarity at +10 kV, confirming charge separation via migration of OH− and H3O+.
Acknowledgments
This research was supported by the Grant-in-Aid for Scientific Research (KAKENHI) from the Japan Society for the Promotion of Science (JSPS) (23K03627) and the Aichi Institute of Technology Project Collaborative Research. Furthermore, we thank Sony Semiconductor Manufacturing Corporation and Sony Semiconductor Solutions Corporation for their support during this research.
Biographies

Yoshiyuki Seike (Member) is an Active Professor at the Aichi Institute of Technology (AIT), Japan. He received his Ph.D. in Science and Engineering (2009) from Saitama University and his MS (1993) and BS (1990) degrees from Aichi Institute of Technology. From 1990 to 2016, he worked at Asahi Sunac Corporation. His field areas included organic material for photovoltaic cells, analysis of cleaning processes for semiconductor devices, and ESD in semiconductor manufacturing.

Hiroharu Suzuki (Non-member) received his MS in Engineering in 2023 from the Aichi Institute of Technology, Japan. He is currently an engineer at the Sony Semiconductor Manufacturing Corporation in Japan. His current work involves the research and development of image sensor manufacturing processes.

Yusuke Ichino (Member) is a Professor in the Department of Electrical Engineering, Aichi Institute of Technology (AIT). He graduated from Nagoya University and obtained his Ph.D. in 2004. He moved to AIT from Nagoya University in April 2020. His research interests include high-performance functional oxide materials, including superconductors and organic thin-film solar cells.

Noriyuki Taoka (Non-member) is a Professor in the Department of Electrical Engineering, Aichi Institute of Technology (AIT). He graduated from Kyoto Sangyo University and received a Ph.D. degree from Nagoya University in 2005. He has engaged in research on group IV and III-V semiconductor devices. From April 2023, he has been in the current position at AIT.

Tatsuo Mori (Senior Member) is a Professor in the Department of Electrical Engineering, Aichi Institute of Technology (AIT). He graduated from Nagoya University and obtained his Ph.D. in 1990. He moved to AIT from Nagoya University in April 2012. His research fields are the high-field phenomenon of polymeric insulating materials and the fabrication and estimation of organic devices such as organic light-emitting diodes and organic photovoltaic cells.


