Assessing the effects of Na2SO4 and NaCl on the properties of geopolymer concrete subjected to elevated temperatures
Abstract
Since concrete is exposed to chemical, mechanical, or physical deteriorating effects simultaneously or successively under environmental conditions, this study focused on the durability of geopolymer concretes containing ground blast furnace slag (GGBFS) and fly ash (FA) under the effects of sulfate and salt after elevated temperatures. For this aim, five FA-based geopolymer concrete mixtures with different GGBFS contents were produced and cured at 90°C for 72 h. First, the produced samples were exposed to 200, 400, 600, and 800°C for 2 h. Then, the samples were put into 5% sodium sulfate (Na2SO4) and 5% sodium chloride (NaCl) solutions for 30 days. The impacts of elevated temperature + Na2SO4 and elevated temperature + NaCl on geopolymer concrete were investigated by compressive strength, mass loss, visual examination, capillary water absorption, x-ray diffraction (XRD), scanning electron microscopy (SEM), and Fourier transform infrared spectroscopy (FT-IR). As a result, although cracking or strength decreases in concrete have been observed after only elevated temperatures, it has exhibited significant resistance to the integrated deterioration influences, has not disintegrated, and maintained its integrity under appropriate mix design and curing conditions. Shortly, the results demonstrated the ability of geopolymer concrete subjected to elevated temperatures with acceptable strength and durability under chemical effects, even if left for a short time.
1 INTRODUCTION
Portland cement, the main ingredient in concrete, has many harmful effects, such as high amounts of CO2 and dust emissions and energy consumption during production.1 As a result of these negative effects, many threats such as the depletion of natural resources and global warming have occurred, and therefore the use of sustainable products has become increasingly important.2, 3 Many sustainable materials such as pumice, volcanic ash, perlite, silica fume, metakaolin4 slag5, 6 and fly ash7, 8 are frequently used to produce environmentally friendly binders. In particular, slag and fly ash, which exhibit high pozzolanic actions, are the most common industrial wastes used as precursors in the production of eco-friendly geopolymer concrete.9-12 Furthermore, sodium silicate, calcium, sodium, or potassium hydroxide are extensively favored activators to activate these waste materials.13-16 The most efficient outcomes regarding strength and durability were obtained when NaOH and Na2SO3 were in combination.17, 18 To illustrate, the mechanical features of geopolymer with FA/GGBFS activated by Na2SiO3 are higher than the others, as Na2SiO3 ensures more dissoluble aluminosilicate, which participates in the creation of large amounts of gels.19 In addition to these ingredients, temperature, curing method and time also have an effect on strength and durability. For example, in the long term, the strength of heat-cured specimens increases faster in the first 24 h and slower in subsequent periods. High-temperature heat curing improves polymerization and increases compressive strength.20 The polymerization reaction takes place between aluminosilicate sources and alkaline solutions.21 As a result of the polymerization, which can be briefly defined as dissolution, rearrangement, condensation and solidification processes, a polymer chain network consisting of Si–O–Al bonds is formed between these alkaline solutions and the source material.22, 23 Thus, thanks to this typical three-dimensional aluminosilicate networks, geopolymers display outstanding mechanical and structural qualities compared to traditional concrete under high temperature,24-29 acid, sulfate, or chloride effects.30-34
If the geopolymer exposes to sulfate solution, the –Si–O–Si– bonds can easily break in the aluminosilicate gel. Additionally, when sulfate solution, aluminosilicate gel, and (C-N)-A-S-H can react, ettringite can form, chemical reactions like ion exchange can occur, and high calcium-containing geopolymers can degrade in strength.35, 36 However, fly ash-based geopolymers containing low calcium are more durable against chloride or sulfate effects and do not produce expansive harmful products to the structure.35 For example, in a study, the deterioration rate of the mixture with slag and fly ash has reduced under the impact of sulfate, and high sulfate resistance has observed until the 360th day.36-40 In another work, no deterioration or cracking has indicated in geopolymer samples subjected to sodium sulfate for about a year, and compressive strengths have also been almost the same.41 In other words, using geopolymer instead of traditional concrete positively affected the impermeability and strength.41 Geopolymers also have high chloride resistance due to the creation of N-A-S-H gels that can decrease the transportation of chloride ions, so compressive strength losses are minimal.42 For instance, Okoye et al. examined the chloride effect in the geopolymer containing fly ash and silica fume, and they expressed that weight loss was low and compressive strength was negligible or nonexistent.43 In addition, the penetration of Cl− ions has reduced, and the resistance against ion exchange reactions has increased in fly ash-based geopolymers by adding slag.
Elevated temperature, which causes damage such as cracking, spalling, and disintegration in concrete, is also one of the most critical factors in concrete design. The properties such as permeability, water-binder ratio, composition, and compressive strength, taken into account in concrete design, significantly affect the fire resistance of concrete.44 In this context, one of the most important differences between geopolymer and conventional concrete in terms of fire resistance is the water/binder ratio and pore structure. Since the water/binder ratio of geopolymer is much lower than conventional concrete, spalling, which occurs due to the evaporation of water trapped in hardened concrete and the gain in pore pressure,44 can be decreased. In addition, after adding slag to alkali-activated materials incorporating fly ash, the total porosity and pore volume decrease, and the microstructure improves. For example, in a study, once 25%, 50%, and 75% slag were added to a fly ash-based mixture under high temperature up to 600°C, the best results were obtained from the mixture containing 50% slag, so pore structure improved, and porosity decreased.45
It is also reported that alkali-activated binders containing fly ash or slag have higher thermal stability than Portland cement, and fly ash-based geopolymer maintained its uniformity up to 1000°C.43, 45 Besides, the geopolymers have a three-dimensional structure consisting of polymeric Si–O–Al and so exhibit properties similar to ceramics and can provide high fire resistance.46
From the literature, it is clear that existing studies usually analyze the durability and strength of geopolymer and conventional concrete under different conditions. And in these studies, it has been found that the geopolymer is more durable than the traditional concrete. However, despite all these investigations, behavior of geopolymers or alkali-activated materials against different physical, chemical, or mechanical effects such as elevated temperatures, sulfate, or sodium chloride is not stable like Portland cement, and needs further investigation.
Furthermore, usually, investigations have been carried out by exposing samples to a single mechanical or chemical disruptive effect in the laboratory. Whereas the structure exposes to more than one of these effects simultaneously or in succession in the outdoor environment, and this situation influences service life of concrete.
For this reason, fly ash-based geopolymer concretes containing slag at different ratios were firstly exposed to elevated temperatures, then NaCl and Na2SO4 solutions in this study. Afterwards, the mechanical features and internal structures of produced concretes were investigated.
2 MATERIALS AND TESTING PROCEDURE
2.1 Materials
Table 1 shows the chemical compounds of FA and GGBFS used as precursors for the production of geopolymer concrete.30, 47 The densities of FA and GGBFS are 2.18 and 2.88 g/cm3, and FA is class F because its total content of SiO2, Al2O3, and Fe2O3 exceeds 50%, considering ASTM C618-19.48 Class F fly ash shows good reactivity with alkalines, and slag increases the resistance of the concrete to chemical and thermal effects. The ratio of solution to binder was kept constant throughout the study. The liquid alkaline solution was prepared as a mixture of NaOH and Na2SiO3,30 and the proportion of Na2SiO3/NaOH was selected as 2. Their physical and chemical features are given in Table 2.
| Component (%) | FA | GGBFS |
|---|---|---|
| CaO | 3.7 | 30.93 |
| SiO2 | 59.8 | 37.40 |
| Al2O3 | 22.2 | 10.4 |
| Fe2O3 | 7.65 | 1.3 |
| MgO | 1.85 | 7.2 |
| SO3 | 0.13 | 0.8 |
| K2O | 1.36 | 0.67 |
| Na2O | 1.77 | 0.39 |
| Cl | 0.08 | 0.05 |
| Parameters | NaOH (powder) | Na2SiO3 (2 module) |
|---|---|---|
| Molecular mass (g/mol) | 40 | 122.06 |
| Color | White | Colorless |
| pH | – | 11–12.5 |
| Density (g/cm3) | 2.13 | 1.36–1.40 |
| Components (%) | ||
| H2O | – | 63–67.5 |
| SiO2 | – | 21.5–24.5 |
| Na2O | – | 11–12.5 |
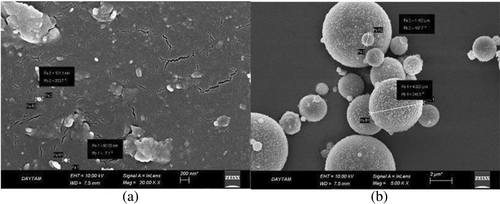
Slag-based materials contain magnesium/calcium aluminosilicate phases called akermanite and gehlenite.49 The x-ray diffraction (XRD) diffractograms in Figure 1 illustrated the peaks that calcite, akermanite, gehlenite, etc. in GGBS, and mullite, muscovite, quartz, magnetite, and hematite in FA. Scanning electron microscopy (SEM) images of GGBFS and FA were presented in Figure 2a,b.

The size of coarse aggregate ranged from 4 to 8 mm, and the usage percentages of fine (0–4 mm) and coarse (4–8 mm) aggregates were 75% and 25%. The densities of aggregates were 2.65 and 2.66 g/cm3 for 0–4 and 4–8 mm, respectively. DELTA UGS-2S plasticizer additive, the main component of which is naphthalene, was selected as 2% of the total binder for proper workability. Furthermore, the features of Na2SO4 and NaCl, used in the durability tests, were given in Table 3. Five different mixtures are designed by adding 0%, 20%, 30%, 40%, and 50% GGBFS, and their compositions are listed in Table 4.
| Physical and chemical properties | Na2SO4 | NaCl |
|---|---|---|
| Color | White | White |
| Concentration (%) | – | – |
| Solubility (g/L) | 445.5 | 358 |
| Molecular weight (g/mol) | 142.04 | 58.44 |
| Density (g/cm3) | 2.70 | 2.17 |
| pH | 5.2–8 | 4.5–7 |
| Vapor pressure (hPa) | – | – |
| Bulk density (kg/m3) | 1400–1600 | 1140 |
| Mixture typea | Total binders (500 kg/m3) | NaOH solution (10 M) | Na2SiO3 | Fine aggregate (0–4 mm) | Coarse aggregate (4–8 mm) | |
|---|---|---|---|---|---|---|
| FA | GGBFS | |||||
| F100 | 500 | 0 | 71.66 | 143.33 | 1097 | 366 |
| FS80 | 400 | 100 | 71.66 | 143.33 | 1118 | 373 |
| FS70 | 350 | 150 | 71.66 | 143.33 | 1129 | 376 |
| FS60 | 300 | 200 | 71.66 | 143.33 | 1140 | 380 |
| FS50 | 250 | 250 | 71.66 | 143.33 | 1151 | 384 |
- a F100, FS80, F70, F60, and F50 denote mixtures containing 100%, 80%, 70%, 60%, and 50% FA.
2.2 Testing procedure
Since the reaction that occurred during the preparation of the NaOH solution is exothermic, the solution was prepared 24 h before casting. In the production of geopolymer concretes, NaOH solution and raw materials were primarily mixed (for 2 min), and then Na2SiO3 was incorporated (for 2 min) to obtain the fresh geopolymer concrete. Finally, aggregate and 2% superplasticizer were added and mixed for 2 min.30 Then, the flow-table test was performed regarding TS EN 1015-3 to establish the workability of fresh concrete, and the results are presented in Table 5. Consequently, the flow diameter decreased with the increment of the GGBFS ratio.50
| Mixture type | F100 | FS80 | FS70 | FS60 | FS50 |
|---|---|---|---|---|---|
| Flow diameter (cm) | 20 | 19 | 17 | 17 | 16.5 |
The produced geopolymer concretes were poured into 5 × 5 × 5 cm3 steel cube molds and compacted with a vibrator table. The increase of compressive strength of fly ash-based geopolymer at laboratory conditions is slower according to heat curing. Therefore, only geopolymer concretes were produced with fly ash need heat curing.41
They were placed in fireproof bags with their molds to prevent moisture loss and cured at 90°C for 24 h. The next day, the samples were demolded, again bagged, and cured at 90°C additional 48 h. After 72 h, the samples were extracted from the cure and kept in laboratory conditions until the 28th day without any protection. Additionally, 12 samples from each mixture were placed in an oven at 200, 400, 600, and 800°C temperatures at a rising of 5°C/min. Once the target temperature was reached, it was kept stable for 2 h. The samples were gradually cooled to avoid thermal shocks. NaCl and Na2SO4 solutions were renewed every 15 days. Furthermore, six samples from each mix were subjected to 5% Na2SO4 and 5% NaCl solution for 30 days after elevated temperatures.
After durability effects, compressive strength, weight changes, capillary water absorption, XRD, and Fourier transform infrared spectroscopy (FT-IR) tests were made for each mixture. The capillary water absorption and compressive strength experiments were made on the 28-day samples regarding TS EN 1305751 and ASTM C109,52 respectively. Furthermore, SEM analysis was conducted to analyze the microstructure phases and the kinetics of geopolymer formation.
Functional group analysis of chosen mixtures was specified in a Bruker VERTEX 70v FT-IR spectrometer with a scanning interval of 6000–50 cm−1 and a 0.4 cm−1 resolution. The mineral phase changes of selected mixtures were assigned by the PANalytical Empyrean XRD analysis (Cu-k-alpha, 90 degrees 2-theta linearity over the whole range and 0.026 angular resolution). SEM with model Zeiss Sigma 300 was used to analyze the microstructural changes of geopolymer concretes. The 1 and 15 kV resolution values of this device are 2.3 and 1.5 nm, respectively. The fractured samples were disintegrated into tiny parts and covered with the proper material. Then, SEM, FT-IR, and XRD analyses were applied to analyze the mineralogic and microstructure qualities of the FS70 and FS50 with the best mechanical features after the effect of elevated temperature + Na2SO4 and elevated temperature + NaCl.
3 RESULTS
3.1 Elevated temperature + Na2SO4
3.1.1 Compressive strength and surface examination
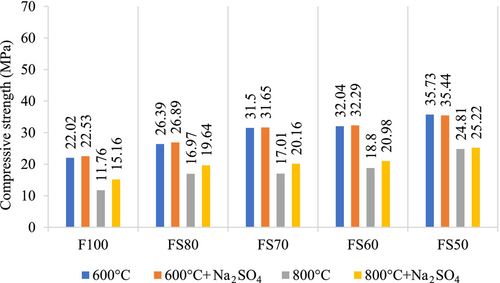
The compressive strength results of samples subjected to the elevated temperature + Na2SO4 were shown in Figures 3 and 4. When Figure 4 was examined, it was seen that the compressive strength of all mixtures increased as the amount of slag increased. Because of the addition of GGBFS, the matrix structure enhanced with the increase in the amount of calcined material, and the matrix reached a denser microstructure which could be expressed as a cause of the rise in the compressive strength.21, 53 Furthermore, GGBFS is a good source of soluble Ca in the mix because of its high CaO content. The amount of soluble Ca is directly related to compressive strength.54 Kathirvel and Kaliyaperumal54 have stated that the favorable feature of void volume is chiefly due to the C-A-S-H gel type, which predominates the microstructure of fly ash-based geopolymer with slag, which is highly dense compared to N-A-S-H and C-S-H gel. This C-A-S-H gel structure also has extra pore-filling ability compared to N-A-S-H gel.
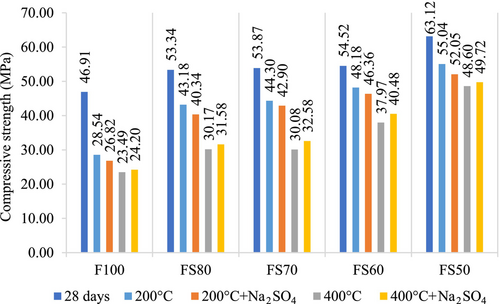
Moreover, a hybrid gel system that has modified characteristics occurs in the matrix by adding the GGBFS. Soluble calcium in the mixture also provides extra C-A-S-H formation, and mechanical strength can be developed.29, 55 However, the hydration products of the mixes with FA and GGBFS can undergo thermal decomposition at elevated temperatures, and hence any decrease in compressive strength can occur.29, 45, 56, 57 In this context, it was defined that the compressive strengths reduced as the temperature raised in all mixture groups. Nonetheless, it was seen that the relative loss in the strength due to exposure to elevated temperatures is less for geopolymers containing higher levels of GGBS. Because, geopolymers with GGBS have fewer voids than without GGBS, and provide high compressive strengths.58 Moreover, GGBS reduces shrinkage and permeability by reducing porosity, and as a result, the compressive strength increases.59 For instance, when subjected to 200°C, the compressive strength losses of F100, FS80, FS70, FS60, and FS50 mixtures were 39%, 19%, 18%, 11%, and 12%, respectively.
After 200 and 400°C, the compressive strengths of the samples exposed to 5% Na2SO4 solution were confronted with their strengths after only high temperatures.
Due to the different products in geopolymer reaction than the hydration components in Portland cement, the sulfate attack mechanism in geopolymer differs from that in traditional concrete. The stable silica-alumina geopolymer structure and low Ca concentration affect the positive sulfate resistance of geopolymer. For example, Pasupathy et al. reported that the geopolymer concrete has shown less sign of scaling effect and disintegration than traditional concrete in the sulfate environment.60 Similarly, Song et al. stated that only sodium sulfate crystals were found in the geopolymer exposed to sulfate solutions, and no expansion products detected. This situation is mainly due to the inert reaction between hydration products and sulfate, is the essential parameter for high sulfate stability. Moreover, they have expressed that the geopolymer specimens in sodium sulfate solution displayed higher strength than those in only water, and the strength of the specimens increased as the quantity of sodium sulfur in the solution increased. This result is because of the uninterrupted hydration of the geopolymer and crystallization of sulfates within the geopolymer.61 Similarly, no significant decrease in compressive strength was observed after 200°C + Na2SO4 according to only 200°C in this study. These decreases were 6.03%, 6.58%, 3.16%, 3.78% and 5.43%, respectively after 200°C + Na2SO4 for F100, FS80, FS70, FS60, and FS50 mixtures. These strength losses may be because of shrinkage and microcracks. In addition, after 400°C + Na2SO4, they increased by 3.02%, 4.67%, 8.31%, 6.61%, and 2.30%, respectively.
The compressive strength losses remarkably increased because of the dehydration when exposed to 800°C. Also, the C-A-S-H is thermally unstable and can deteriorate at a high temperature, like C–S–H.62 Nevertheless, because of the sensitive thermal equilibrium of FA/GGBFS mixtures compared to mixtures containing only FA, unavoidable deterioration and strength degeneration occur after elevated temperatures.45, 56, 57
According to Figure 4, the strength results are close to each other, and no decrease was observed after 400°C + Na2SO4, 600°C + Na2SO4, 800°C + Na2SO4 compared to just increasing temperatures. The rates of increase in the strengths for F100, FS80, FS70, FS60, and FS50 after 600°C + Na2SO4 were 2.32%, 1.89%, 0.48%, 0.78, 0.31%, respectively, while the increase rates after 800°C + Na2SO4 were 28.91%, 15.73%, 18.52%, 11.6%, and 1.65%. The highest results for 600 + Na2SO4 and 800 + Na2SO4 conditions were obtained as 35.44 and 25.22 MPa in the FS50 mix. In these mixtures, the cause of the increase can be connected to the sulfate ions penetration into samples and formed crystals by participating in the geopolymerization.63-65 The compressive strengths improved with the raising of the GGBFS ratio in all groups.66 In addition, the ceaseless hydration of the geopolymer and crystallization of the sodium sulfate from the sulfate solution causes a minor reduction in porosity.
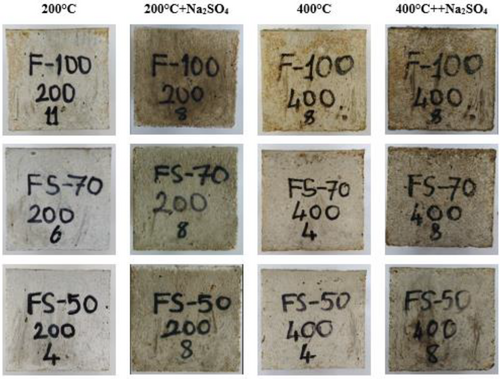
As a result of elevated temperatures, while the color change from 200 to 600°C was in the form of graying, a much more distinctive red color was detected at 800°C. However, the red color change is more pronounced in the F100 mixture due to the iron content. As seen in Figure 5, though the significant change was not in the samples subjected to 200°C + Na2SO4 and 400°C + Na2SO4, graying occurred on their surface. the significant change was not in the samples subjected to 200°C + Na2SO4 and 400°C + Na2SO4, graying occurred on their surface. In addition, any disintegration was not determined in all concretes after the 5% Na2SO4 solution effect for 30 days.
The changes in the color of samples are more pronounced after exposure to 600°C + Na2SO4 and 800°C + Na2SO4 effects. Concrete surface cracks started to appear, particularly after 600°C. These cracks may occur due to the thermal inconsistency between the aggregate and matrix. The color change on the surface of concretes can be based on the oxidation of the iron in the raw material.67 In Figure 6, the colors of the samples submitted to 5% Na2SO4 solution after 600 and 800°C first turned to dark gray and then red, as well as roughness, white and pink spots, and cracks on the samples were noticed. In addition, after elevated temperatures, geopolymer concretes maintained their stability despite the decrease in strength.
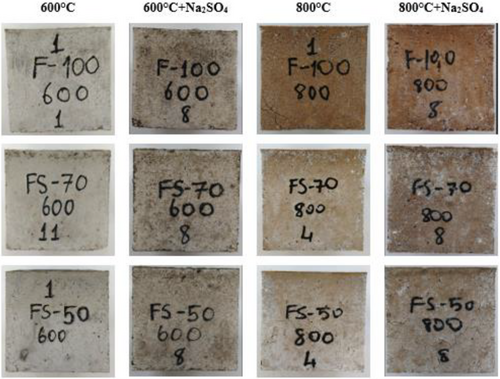
Figure 7 shows the post-crushing images of the F100 sample exposed to elevated temperature + Na2SO4. Although cracks were present on the crushing samples, concrete mass was not poured at 200°C + Na2SO4, 400°C + Na2SO4. After the effect of 600°C + Na2SO4 and 800°C + Na2SO4, the color of the aggregate and the sample turned white and red, respectively, and the matrix structure has been disintegrated. Furthermore, as the GGBFS ratio increased, the red color formation decreased. However, with the increasing GGBFS content, superficial cracks became more evident, particularly at 800°C. Nevertheless, the samples were not dispersed.

3.1.2 Capillary water absorption
The coefficients of capillary water absorption of the mixtures, which were placed in 5% Na2SO4 solution after the high temperatures, were presented in Table 6.47 After 200°C + Na2SO4, 400°C + Na2SO4 and 600°C + Na2SO4, the results generally reduced with the rising GGBFS ratio. Slag containing more free calcium oxide than fly ash, forms C-A-S-H or C-S-H in concrete besides N-A-S-H gel.68 Therefore, the diameter of pore size and porosity can decrease due to the creation of additional C-A-S-H or C-S-H. However, due to the faster disruption of calcium compounds above 800°C, more voids may form, and capillary water absorption may increase in FS50. Moreover, the coefficients for all temperatures were very close to each other after durability effects, and the coefficients changed parallel with temperature. Similarly, Bakharev24 expressed fly ash based-geopolymer after high temperatures such as 800°C shows cracking owing to shrinkage and reduction of strength connected to degradation in the structure of aluminosilicate gel and increment in the average pore dimension.67
| Results (g/m2 × h0,5) | ||||||||
|---|---|---|---|---|---|---|---|---|
| Mix | 200°C | 200°C + Na2SO4 | 400°C | 400°C + Na2SO4 | 600°C | 600°C + Na2SO4 | 800°C | 800°C + Na2SO4 |
| F100 | 0.95 | 1.65 | 1.50 | 1.75 | 1.78 | 1.90 | 1.98 | 1.90 |
| FS80 | 0.51 | 1.65 | 1.73 | 1.81 | 1.78 | 1.85 | 1.78 | 1.84 |
| FS70 | 0.48 | 1.63 | 1.80 | 1.83 | 1.82 | 1.91 | 1.83 | 1.89 |
| FS60 | 0.44 | 1.55 | 1.55 | 1.61 | 1.81 | 1.85 | 1.90 | 2.03 |
| FS50 | 0.42 | 1.23 | 0.82 | 1.43 | 1.77 | 1.85 | 2.06 | 2.16 |
The highest and the lowest results were achieved in the FS50 after 800°C + Na2SO4 and 200°C + Na2SO4. Water absorption by capillary increased in all groups exposed to sulfate effect after elevated temperatures.
As seen in Figure 8, due to the water absorption experiment applied after durability effects, efflorescence was sighted on the samples. Because alkalis in the structure of the samples are not 100% included in the reaction, these components can react with the carbonic acid created by the dissolution of CO2 when there is humidity. In addition, the efflorescence may be caused by Na2SO4 re-emerging from the samples. Similarly, in this study, after the samples came into contact with water, crystalline salts formed on the sample surfaces due to efflorescence caused by free alkalis in the pores.69, 70

3.1.3 Weight changes
According to Table 7, a loss in the weight after 200°C + Na2SO4 and 400°C + Na2SO4 and an increase in the weight after 600°C + Na2SO4 and 800°C + Na2SO4 were obtained in geopolymer concretes.47 The changes in weights of the mixtures containing GGBFS after 200°C + Na2SO4 were higher than that of the F100 mixture. For 200°C + Na2SO4, as the amount of GGBFS increased, the weight losses increased, while as the temperature increased, there was a weight increase. The highest weight increases for all mixtures were obtained after 800°C + Na2SO4. In general, the weight changes are very close to each other and are negligible. Similarly, according to Komljenović et al.71 and Kwasny et al.,72 any increase in weight after only sulfate or salt effects is because of the salts filling the pores created in the geopolymer concrete. Kathirvel and Kaliyaperumal have expressed that little or no gypsum and ettringite does not cause a substantial decline in weight loss and strength degradation of alkali activated slag concrete. Furthermore, they explained that the specimens were found to maintain their integrity with no distress observed on the surface visually.54 In this context, the weight change in the geopolymer concrete samples was negligible due to the sulfate effect.
| Weight change (%) | ||||||||
|---|---|---|---|---|---|---|---|---|
| Mix | 200°C | 200°C + Na2SO4 | 400°C | 400°C + Na2SO4 | 600°C | 600°C + Na2SO4 | 800°C | 800°C + Na2SO4 |
| F100 | 0.97 | −1.47 | 1.81 | −0.77 | 3.48 | +0.1 | 7.19 | +1.74 |
| FS80 | 0.33 | −2.09 | 2.14 | −0.43 | 3.27 | +0.1 | 6.22 | +1.16 |
| FS70 | 0.37 | −2.01 | 2.19 | −0.47 | 3.47 | +0.14 | 6.70 | +1.08 |
| FS60 | 0.40 | −1.95 | 2.18 | −0.65 | 3.61 | +0.23 | 6.88 | +1.56 |
| FS50 | 0.65 | −2.52 | 2.24 | −1.11 | 4.28 | +0.25 | 6.00 | +1.65 |
3.1.4 Scanning electron microscopy
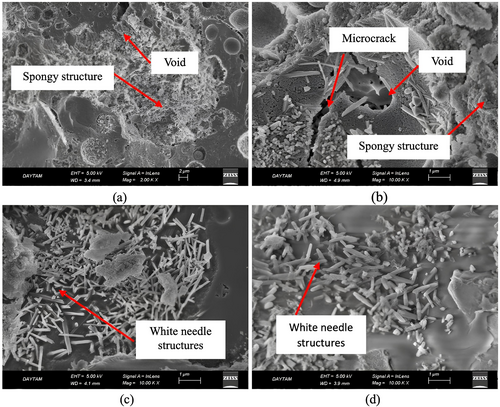
Figure 9 illustrates the SEM images of the FS70 mixture, which gives optimum results, according to the results of the compressive strength, capillary water absorption, and weight change experiments after the effect of elevated temperature + Na2SO4. As seen in the SEM images after elevated temperature + Na2SO4, there were voids and cracks in the inner structure, but the microstructure developed with the effect of Na2SO4. Crystals form in geopolymer concretes that are exposed to the effect of sulfate, and they facilitate the matrix to turn into a denser structure. Any increment in the compressive strength of samples after the sulfate effect may be due to the filling of these crystal structures in the matrix structure into the voids.63 In addition, particularly after 600°C + Na2SO4 and 800°C + Na2SO4, the dense microstructure obtained in SEM analysis, compressive strength results, and weight change supported each other. Furthermore, the microstructure of samples generally contains microcracks, voids, unreacted particles, or new gel phases. However, after elevated temperatures, this structure disrupts due to expansion, decomposition of compounds such as portlandite, or deterioration of gel phases. In addition, these gel phases can recrystallize, sinter, and alter as structural. As a result of these events, the spongy structure is formed and voids increase in the matrix or ITZ.73 A similar spongy structure was observed in the matrix structure in this study. This void structure can form due to the destruction of the geopolymer phase and phase transformations at high temperatures. The formation of this structure caused a decrease in the strength of concrete. However, when samples exposed to NaCl and Na2SO4 solution the salt crystals may have decreased the pore volume by filling these pores.54
3.1.5 X-ray diffraction
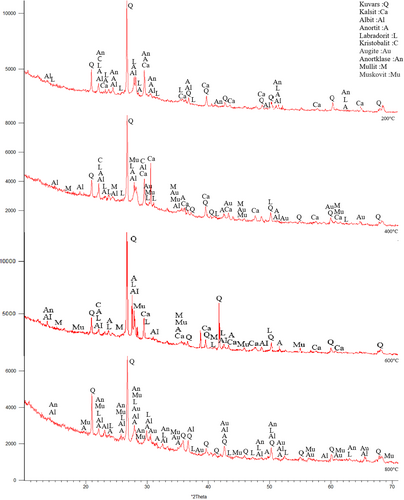
The samples were first subjected to 200°C, 400°C, 600°C, and 800°C. In Figure 10, Quartz (SiO2), Calcite (CaCO3), Albite (NaAlSi3O8), Anorthite (CaAl2Si2O8), Anorthoclase (NaKAlSi3O8), Nepheline (NaAlSiO4), Augite (CaMgFeAlSiO), Muscovite (NaKAlSi2OAI) Mullite (3AI2O32SiO2), Labradorite (CaONaOAISiO), and Cristobalite (SiO2) etc. minerals were observed.73 The existence of these crystalline phases in the XRD analysis, indicates the availability of C-S-H, C-(A)-S-H, N-A-S-H and (N)-C-A-S-H phases.73 In addition, muscovite was formed in the FS70 mixture group. New compounds can be formed with GGBFS added to the mixture. Moreover, quartz was observed intensely between 26° and 27° after 400°C and 600°C, and an increase in the calcite peaks originating from GGBFS were concentrated between 25° and 65°. In addition, the mullite originating from the use of the FA was depicted 16°-17° at the same temperatures. Dişçi and Polat (2021) stated that the formation of calcite compound is an indicator of the presence of C-S-H in geopolymer concretes.74 More prominent peaks of calcite was noticed because of a rise in the amount of GGBFS.49, 75 In general, quartz and calcite minerals declined with the increase of temperature. The recrystallization begins with the appearance of short peaks that are related to new crystalline structures at 800°C.49 As a result of crystallization and dehydration, C-S-H may disappear, and different crystal peaks may form in its place. This situation may be related to the chemical components of the materials used in the binders.45 Ultimately, cristobalite, muscovite, labradorite, albite, and anorthite compounds were formed at the 22° peak point, and the peak densities declined with greater temperature.
In Figure 11, XRD analysis results of FS70 after 200°C + Na2SO4, 400°C + Na2SO4, 600°C + Na2SO4, and 800°C + Na2SO4 were compared. After the effect of elevated temperature + Na2SO4, crystalline phase density was observed in the mineralogical structure of the FS70 mixture. After 200°C + Na2SO4, 400°C + Na2SO4, 600°C + Na2SO4, and 800°C + Na2SO4 in the FS70 mixture, peaks were distributed between 21° and 68° and quartz compound was observed at 27° peak. After the effect of elevated temperature + Na2SO4, different crystal phases formed like nepheline. Numerous peaks of calcite, quartz, and mullite were obtained in XRD analysis performed after the Na2SO4 effect on the geopolymer concretes in the literature.60
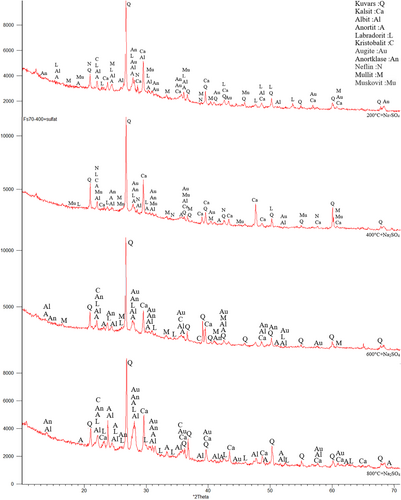
A higher quantity and intensity of crystalline phases were observed after elevated temperature + Na2SO4. As the crystal phases increase, an enhancement in the strength of the geopolymer has been identified.76 For example, anorthite is a calcium aluminosilicate, which is related to the crystalline section of C-A-S-H, its occurrence puts forward the existence of gel similar to C(N)-A-S-H, and can indicate a higher extent of the cross-linking structure.49 Similarly, the strength of the geopolymer concretes improved with the effect of elevated temperature + Na2SO4.
3.1.6 Fourier transform infrared spectroscopy
Figure 12 indicates the results of FT-IR of FS70 after elevated temperatures. The mixture vibrated between 978–1082 and 983–1073 cm−1 and strong bands formed in the range of 1200–900 cm−1 in the geopolymer concretes containing FA and GGBFS.77 Generally, the hybrid geopolymers have similar chemical bonds to the simple geopolymers. In the literature, the absorption bands are designated Si–O–Si (quartz), Si–O–T(N/C-A-S-H), and C–O (sodium/calcium carbonates) for wave numbers 670–850, 979–987, 1400–1463, respectively.78 The broad bands in this range are associated with unsymmetric vibrations manufactured by the Si–O–(Si/Al) bond structure.79 The band near 950–1100 cm−1, originating from the Si–O–T vibrations created with the rearrangement of the bond structures during the formation of the matrix structure, is important for understanding the network structures.80 In addition, as the amount of GGBFS and reduction of Al increases, C-S-H and N-A-S-H are formed, accelerating the geopolymerization reaction, strengthening the matrix structure, and improving compressive strength.81 In this context, the wave numbers generally rise by increasing the amount of slag. The bands observed at 777 cm−1 vibration in all spectra may be because of the Al–O bonds. Band gaps between 430 and 470 cm−1 also express the stretching vibration of the Mg–O structure.82
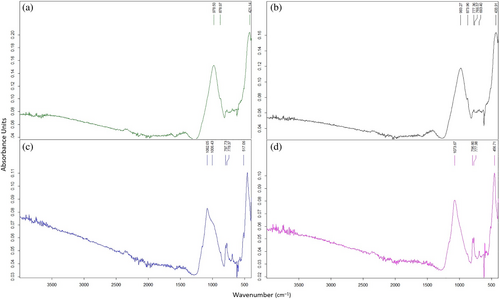
Figure 13 shows the FS70 mixture vibrates between 978 and 1448 cm−1 after elevated temperature + Na2SO4, while between 978 and 1082 cm−1 for only elevated temperature. In other words, after elevated temperature + Na2SO4, a change between 0 and 366 cm−1 was observed in the wave number of asymmetric vibrations formed by the Si–O–T bond structure. The vibration formed by the O–C–O bond in the 1430 cm−1 band is related to the typical carbonate product created by calcite in the binder.79 As seen in Figure 13, vibrations occurred in 1406 cm−1,1419 cm−1,1449 cm−1 bands after 400°C + Na2SO4, 600°C + Na2SO4, and 800°C + Na2SO4, respectively. El-Didamony et al.83 remarked that bands with a low density of around 1422 cm−1 originate from [CO3]−2 groups. Carbonation, particularly in the short bands between 1427 and 1472 cm−1, is caused by contact with the atmosphere. Also, the formation of calcite peaks in XRD supports the carbonation phenomenon observed in the FT-IR analysis after the effect of elevated temperature + Na2SO4. In this study, in the effect of elevated temperature + Na2SO4, a little carbonation was sighted due to contact with air. According to Rajini et al.,81 in support of the XRD results of the work, anorthite, and calcite originating from the carbonate formed in geopolymer concretes are observed in the 1423 cm−1 band. After 400°C + Na2SO4, 600°C + Na2SO4 and 800°C + Na2SO4, a band expressing 424–512 cm−1 bending vibration was observed in the FS70 mixture, and these vibrations were observed in Si–O–Si, O–Si–O bonding groups. structures.79 Vibration bands were observed around 777 cm−1 after elevated temperatures. Moreover, there has been little shift in this vibration band, and the bands have been due to the stretching vibration of the Al–O bond.
3.2 Elevated temperature + NaCl
3.2.1 Compressive strength and surface examination
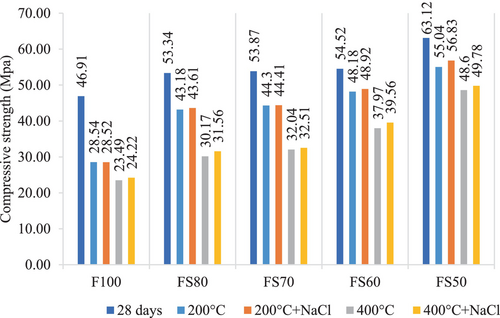
The changes in compressive strength of the samples in the NaCl solution after 200, 400, 600, and 800°C are given in Figures 14 and 15. According to Figure 14, the compressive strengths of F100, FS80, FS70, FS60, and FS50 mixtures after 200°C + NaCl and 400°C + NaCl increased with 0.07%, 0.99%, 0.25%, 1.54%, and 3.25%, and 3.11%, 4.61%, 1.47%, 4.19%, and 2.43%, respectively. Moreover, it was found that as the amount of slag increased, the rate of loss decreased. For instance, a decrease of about 10% in 28 days strength at 200°C has been obtained for the compounds containing 40% and 50% slag. This value is lower than the other mixtures' compressive strength losses.30, 47
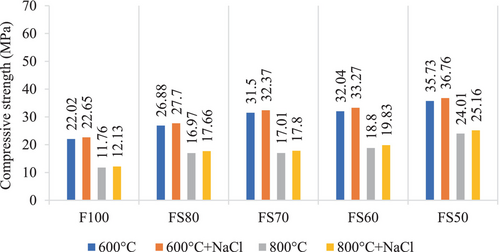
According to Figure 15, the compressive strengths of all the mixtures increased after both 600°C + NaCl and 800°C + NaCl. According to compressive strength results, the increment rates were close to each other, but the FS50 had the highest ultimate strength in all conditions.
Many factors can affect the concrete's resistance to chloride penetration. The reactivity and the CaO ratio of the raw material are particularly important. Any increase in the CaO amount in the raw material enhances the reactivity of the precursor material and compressive strength.64 This situation supplies the generation of great amounts of C-A-S-H or N-A-C-H gels, and so the low porosity, reduced penetration, and lower diffusion of chloride ions can be obtained in the geopolymer matrix.84-86 Also, the conduction and diffusion of chloride are affected by the binding and adsorption capability of the concrete to these ions.86 The durability effects applied as elevated temperature + NaCl owing to the increment in compressive strength has not negatively affected the properties of the concrete for a period like 30 days.
In Figure 16, a color change toward brown and roughness were noticed on the sample's surface exposed to the effect of elevated temperature + NaCl. Moreover, the cracks are not evident for 200°C + NaCl and 400°C + NaCl, but the creation of small voids has been obtained in a few samples. Generally, the cracks were observed at conditions above 600°C + NaCl on the geopolymer concrete specimens.
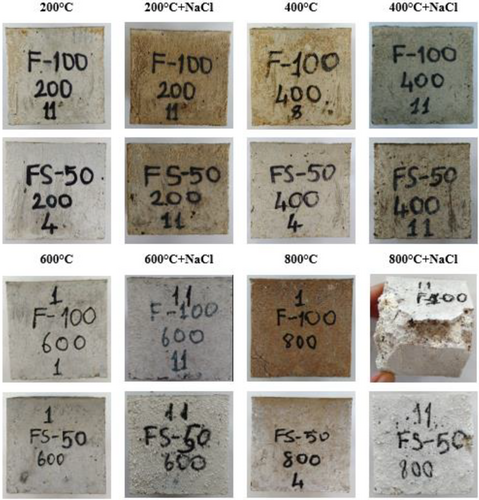
In Figure 17, after 600°C + NaCl and 800°C + NaCl, whitening, salt deposits, and roughness on the surface of samples, fragmentation in the matrix structure, and whiteness in the aggregates, particularly after 800°C + NaCl extra cracks, and disintegration were observed.87

3.2.2 Capillary water absorption
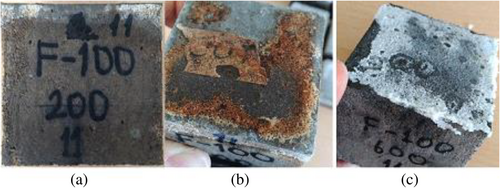
The results obtained in the NaCl solution after 200, 400, 600, and 800°C are shown in Table 8. In general, the capillary water absorption coefficients rose with the increase of the GGBFS ratio in all groups, but the results were very close to each other. Moreover, the efflorescence on the samples was more observed with the rising temperature (Figure 18).
| Results (g/m2 × h0,5) | ||||
|---|---|---|---|---|
| Mixtures | 200°C + NaCI | 400°C + NaCI | 600°C + NaCI | 800°C + NaCI |
| F100 | 1.74 | 1.71 | 1.85 | 1.86 |
| FS80 | 1.67 | 1.77 | 1.82 | 1.84 |
| FS70 | 1.54 | 1.81 | 1.85 | 1.87 |
| FS60 | 1.46 | 1.51 | 1.84 | 2.04 |
| FS50 | 1.09 | 1.54 | 1.83 | 2.11 |
3.2.3 Weight changes
According to Table 9, the weight loss was detected in geopolymer concretes after 200°C + NaCI and 400°C + NaCI, and it was negligibly low after 400°C + NaCI. After 600°C + NaCI and 800°C + NaCI, a very close and negligible weight increase was observed in geopolymer concretes. Weight increase, which is observed after the effect of salt, was because the spaces formed in the structures of the samples were later filled with new structures formed by sodium and chlorine ions.64, 88 Albitar et al.89 kept the geopolymer concretes with fly ash in 5% NaCl solution for 9 months and stated that the weight increase occurred.
| Weight changes (%) | ||||
|---|---|---|---|---|
| Mixtures | 200°C + NaCI | 400°C + NaCI | 600°C + NaCI | 800°C + NaCI |
| F100 | −1.53 | −0.74 | +0.23 | +0.23 |
| FS80 | −2.21 | −0.34 | +0.10 | +0.74 |
| FS70 | −2.16 | −0.33 | +0.10 | +0.74 |
| FS60 | −1.87 | −0.77 | +0.36 | +0.87 |
| FS50 | −2.60 | −0.55 | +0.39 | +0.86 |
3.2.4 Scanning electron microscopy
In the geopolymer, chloride ions can physically and/or chemically adsorb to the geopolymer gel. The geopolymerization of alumino-silicate-rich source materials like fly ash generates N-A-S-H gels. Thus, the chloride binding mechanism of GPC is different from that in cement. In addition, the chloride ions physically connect to the surface of N-A-S-H gels, and the chemical absorption mechanism plays a small role in chloride binding. Also, the precipitation of NaCl takes place on the microstructure of the geopolymer. This precipitation can indicate that the chloride ions are adsorbed into the pore network system, which provides the physical binding capacity of geopolymer.60 So, as seen from Figure 19 in the SEM analysis, due to the precipitation and filling of the spaces by the NaCl crystals, a denser structure was formed, and the capillary absorption coefficient decreased despite the increase in temperature. SEM images of the FS50 mixture group, which gave optimum results according to compressive strength, capillary water absorption, and weight change experiments applied to all mixtures. When the SEM images after elevated temperature + NaCl were examined, a dense spongy formation was observed in the inner structure, particularly after 600°C + NaCl and 800°C + NaCl.
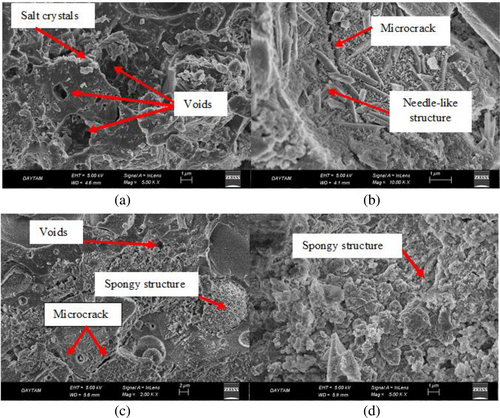
Moreover, the compressive strength results were parallel with this situation. Supporting this study, Zhang et al.90 stated that the pores in the geopolymer concrete were filled after the effect of NaCl, a compact structure was formed, and as a result, the NaCl crystals caused an increase in compressive strength.
3.2.5 X-ray diffraction
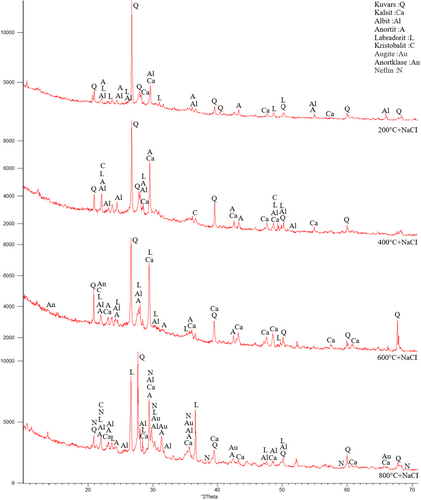
The peaks of the quartz mineral were commonly monitored between 21° and 69° after all temperatures.91 Moreover, the quartz peaks increased with increasing temperature. Calcite mineral in geopolymer concretes formed prominent peaks around 22°, 29°, and 39° after elevated temperatures. Figure 20 demonstrated that the height of the calcite peaks reduced as the temperature raised in the FS50 mixture. Quartz (SiO2), calcite (CaCO3), albite (NaAlSi3O8), anorthite (CaAl2Si2O8), anorthoclase (NaKAlSi3O8), augite (CaMgFeAlSiO), labradorite (CaONaOAISiO), cristobalite (SiO2) minerals were observed in the graph.
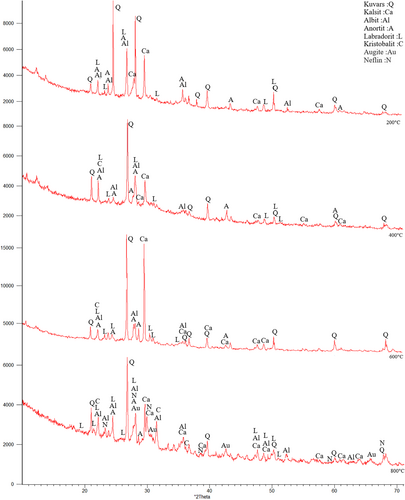
At very high temperatures, gel products decomposing entirely is one of the main factors for the decrement of compressive strength. However, the recrystallization at 800°C provides many new peaks in XRD patterns.49 After elevated temperatures, mullite mineral has not observed in the FS50 mixture. Decreased mullite density with the increase in the GGBFS ratio can be due to the reaction of mullite with different minerals from GGBFS to form new structures.77 In the FS50 mixture group, cristobalite was observed at 22° after all temperatures. Furthermore, labradorite, anorthite, and albite were generally observed at near peaks.
The XRD analysis results of the FS50 mixture, which has the best mechanical properties after elevated temperature + NaCl, are given in Figure 21. Quartz compound was observed at 27° peak after 200°C + NaCl, 400°C + NaCl, 600°C + NaCl, and 800°C + NaCI, just as in the elevated temperature effect in the FS50 mixture group, and the peaks were distributed between 22° and 69°. After elevated temperature + NaCl, a decrease was observed in the densities of the peaks where the quartz compound was observed. Furthermore, the anorthoclase crystal phase was obtained after elevated temperature + NaCl in FS50. The crystal phase density shifted toward the peaks between 22°–29°–30°. The cristobalite phase detected formed at a 22° peak in all XRD graphs was also obtained after the effect of elevated temperature + NaCl.
3.2.6 Fourier transform infrared spectroscopy
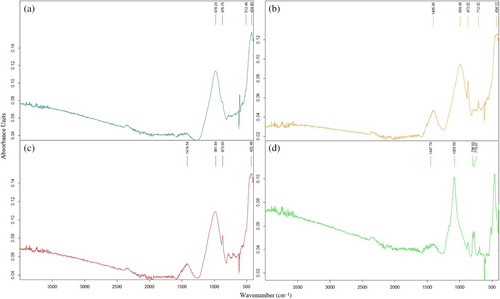
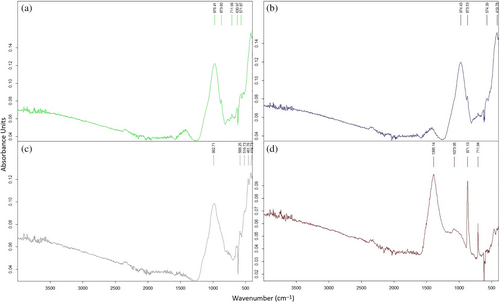
Figure 22 indicates the FS50 mixture vibrates between 974 and 1395 cm−1. Generally, the bands develop around 1040 cm−1 in the geopolymer concretes containing FA. Thus, these bands can be ascribed to the vibration of unsymmetric stretching of Si–O–(Si/Al) bonds. In the literature, the band between 670 and 850 cm−1 is connected with the vibrations of stretching of Si–O–Si in quartz for geopolymer containing fly ash. When GGBS is used, as also observed in XRD, the band of vibration at around 1420 cm−1 is due to the vibration of unsymmetric stretching of the O–C–O structures, meaning the existence of calcite.56 The change from 974 to 1395 cm−1 can be attached to an additional polymerization with the increasing temperature, and a calcium-implicated cross-link can form.56 After exposure to high temperatures, from 200 to 800°C, the absorption area expands. This clear property is a sign of the structural exchange in the gel due to elevated temperature.56
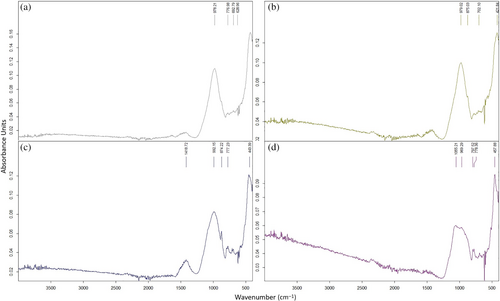
In Figure 23, the FS50 vibrated between 978 and 1418 cm−1 after 200°C + NaCI, 400°C + NaCI, 600°C + NaCl, and 800°C + NaCI. The adsorptions between 700 and 903 cm−1 are appointed to the vibrations of bending and stretching of the Al–O bonds, and suggesting the existence of a compound including distinct calcium and aluminates.29, 92 After the elevated temperatures, the FS50 mix vibrated in the range of 974–1395 cm−1, whereas there was a shift of approximately 4–23 cm−1 in the wave number of asymmetric vibrations formed by the Si–O–T bond structure after elevated temperature + NaCl. Most of the peaks defined between 800 and 1200 cm−1 are related to Si–O–Si(Al) vibrations.92, 93 Similarly, vibrations occurred around 775 cm−1 after elevated temperature + NaCl in the FS50 mixture. According to Pasupathy et al.,60 in FT-IR analysis of geopolymer concrete samples, the vibrations occurring in the 785 cm−1 band were related to the crystal phase of the quartz component. After 600°C + NaCl, after FT-IR analysis, a band expressing 1419 cm−1 stretching vibration was observed and O–C–O bond structure was formed in this band. After 600°C + NaCl, a band meaning 1419 cm−1 stretching vibration was observed and O–C–O bond structure was formed in this band. Moreover, a [HCO3]-bond structure was observed due to carbonation formation at vibrations between 1408 and 1448 cm−1.94 As a result, there was little shift in the vibrational bands in the FT-IR analysis after elevated temperature + NaCl compared to only elevated temperature.
4 CONCLUSIONS
- Whereas the compressive strength decrease has observed after elevated temperatures, the minor enhancement has determined in the sulfate and chloride solutions for all mixes. The absence of any reduction in compressive strength can be considered as a positive effect. Moreover, the color changes on the surfaces of the samples were observed, but they were not fully dispersed. This may be due to the extra pore-filling feature of the C-A-S-H gel structure compared to the N-A-S-H gel. Furthermore, one of the main factors in ensuring this integrity may be the development of the microstructure with the slag and the continuation of the reactions for a longer term owing to the extra structures formed.
- Capillary water absorption coefficients increased in all groups exposed to the sulfate effect, and efflorescence was observed on the surface of the samples. According to the all the experiments the most optimum results were sighted in the FS70 and FS50 after elevated temperature + Na2SO4 and elevated temperature + NaCl. Moreover, the ceaseless hydration of the geopolymer and crystallization of the sodium sulfate from the sulfate solution can cause a minor reduction in porosity. The samples can contain microcracks, voids, unreacted particles, or new gel phases in SEM images.
- After sintering and recrystallization, the alumino-silicate gel structure was partially transformed into a spongy structure, especially after 600. However, with salt crystals precipitating and filling the gaps, the loss of strength was not observed in the samples left in the Na2SO4 and NaCl solutions for 30 days. Additionally, when the weight changes are examined, it is seen that there is an increase in the weight of the samples.
- After elevated temperature + Na2SO4, different crystal phases formed like nepheline. Numerous peaks of calcite, mullite, and quartz were obtained. Also, the formation of calcite peaks supports the carbonation phenomenon. The carbonation also takes place after elevated temperature + NaCl. As the crystal phases increase, the increment in the strength was observed. After elevated temperature + NaCl, a decrease was observed in the intensities where the quartz compound was observed. Moreover, the anorthoclase and cristobalite crystal phases were obtained after elevated temperature + NaCl.
- After elevated temperature + Na2SO4, generally a band expressing 424–512 cm−1 bending vibration was observed, and these vibrations were observed in Si–O–Si, O–Si–O bonding groups. Moreover, vibration bands were observed around 777 cm−1 after elevated temperatures. There were between 0–366 and 4–23 cm−1 shifts in the wave number of asymmetric vibrations formed by the Si–O–T bond structure after elevated temperature + Na2SO4 and elevated temperature + NaCl compared to only elevated temperature. This situation can be attached to the forming calcium cross-linked, stretching vibration of the Al–O bond and further polymerization with rising temperature. After exposed between 200 and 800°C, the absorption area becomes more expansive. Besides, exposure to elevated temperatures has led to sintering and chemical reactions between the original phases, causing the formation of new phases.
ACKNOWLEDGMENTS
This research was supported by the research project “Investigation of the properties of geopolymer concrete exposed to acid, sulfate and salt effect after high temperature”.
Biographies

Nisa Yazıcı, Department of Civil Engineering, Atatürk University, 25240 Erzurum, Turkey. Email: [email protected].

Fatma Karagöl, Department of Civil Engineering, Atatürk University, 25240 Erzurum, Turkey. Email: [email protected].
Open Research
DATA AVAILABILITY STATEMENT
The data that support the findings of this study are available from the corresponding author upon reasonable request.


