Post-tension retrofitting of RC dapped-end beams: A numerical investigation
Abstract
Dapped-end beams are frequently used in roofing and flooring systems of precast reinforced concrete buildings as well as in bridge constructions. Due to design flaws, deterioration, and construction mistakes, they may have unsatisfactory structural performance. Past experimental studies investigated the effectiveness of post-tension strengthening techniques applied to dapped-end beams, revealing them as effective solutions, even though a limited range of influencing parameters were considered. This paper numerically investigates the performance improvement provided by post-tension interventions applied to dapped-end beams. Numerical models were built through a refined FEM software simulating two experimental tests found in the literature. After the models' calibration, a post-tension intervention was designed and implemented in the models, considering the level of prestressing as the main intervention's parameter. Afterwards, the behavior in the post-intervention condition was analyzed to find changes in the failure modes and highlight the performance improvement concerning cracking phenomena and ultimate load-bearing capacity. It is found that the level of tendons' prestress significantly improves the cracking load, which increases almost linearly with respect to it. Conversely, the significant gain in terms of ultimate load-bearing capacity (up to 53%) shows only slight variations when the prestress level changes. Finally, accounting also for the reduction of deformation capacity for high prestressing levels, practical suggestions are provided regarding the optimal post-tension choice.
1 INTRODUCTION
Dapped-end beams are used in a variety of buildings such as industrial facilities, multistorey parking buildings, and roof structures. In fact, this kind of flooring system allows fast construction through the installation of precast RC beams with dapped-ends. In both building and bridge structures, using dapped-end beams increases the safety during the construction phases due to the higher lateral stability of isolated dapped-end beams with respect to full-depth beams supported at their bottom face (Figure 1). The structural behavior of dapped-end beams is significantly influenced by the abrupt change of shape at ends, which determines the presence of disturbed regions where the stress regime is characterized by shear.1 Due to multiple reasons, strengthening interventions may be needed to satisfy the safety and serviceability requirements as well as durability features.2 For example, overloading can occur in the case a structure is subjected to a refurbishment that changes its intended use. Structural degradation can heavily affect the load-bearing capacity, which is a frequent case in bridge structures where carbonation and/or chloride ingress are able to initiate corrosion phenomena leading to cracking, spalling, and delamination of concrete. This can cause a significant loss of rebars mass as well as a deterioration of their bond and ductility properties.3, 4 Finally, design and/or construction flaws can cause the need for a rehabilitation intervention on dapped-end beams.

Therefore, it is essential to consider also the possible deterioration when assessing dapped-end beams,5, 6 taking into account that steel corrosion and concrete damage can lead not only to a load-bearing capacity reduction but also to changes in the expected failure mode.7, 8
Therefore, it is crucial to building owners and practitioners the availability of a range of technical solutions to retrofit dapped-end beams, possibly cheap and low-impact, to minimize disruption and consequent economic losses.
Santarsiero et al.9 have reported a review of strengthening techniques for half-joints in bridge structures, even though most of them can also be applied to other kinds of structures, such as buildings. They have classified the techniques into two main groups: (i) solutions able to modify the load transfer between the suspended and supporting parts and (ii) techniques devoted to strengthening. They also have described the advantages and disadvantages of each one providing a final decision-making framework also based on intervention costs.
For instance, in Ref. [10] prestressed concrete double tee dapped-end beams, commonly used in either roofs or slabs, were experimentally investigated. The performances of dapped-ends reinforced with externally bonded carbon fiber laminates and those of similar elements with improved reinforcement detailing were compared. Taher11 reported the results of different Fiber Reinforced Polymers (FRP) wrapping configurations applied to dapped-end beams. The strengthening configurations differed from each other in the angle with respect to the beam axis and the region of application, finding strength increments up to about 40%.
Nagy-György et al.2 carried out static tests on RC dapped-end beams belonging to roof beams retrofitted with FRP-based strengthening techniques aiming to delay the opening of a crack from the re-entrant corner which may lead to the failure12 (diagonal crack developing from the re-entrant corner). The results indicated that FRP laminates externally bonded along the re-entrant corner of the dapped-end were able to significantly increase the cracking load (improvement up to 116%), even though the ultimate load was improved by only 10% due to debonding of composites.
Finally, Atta and Taman13 tested eight reinforced concrete beams with dapped ends retrofitted by different external prestressing solutions made by horizontal, vertical, or inclined ties. The results showed that three solutions out of the seven tested provided the best results with remarkable performance improvements in both cracking and ultimate limit states. In that study, prestressing values were fixed, and the effect of its variation could not be investigated.
Based on the above-cited studies, post-tension techniques can provide significant improvement in terms of both cracking and ultimate load-bearing capacity, also being rather cheap. In fact, only steel elements are required, allowing this technique to be suitable for a variety of structures and easy to apply.14
Besides the advantages of this retrofitting technique, there are aspects to be better clarified for its extensive application. In particular, further research would be helpful to find out the effect of prestressing variations in steel rods in order to obtain helpful design guidance. For these reasons, this paper numerically investigates how post-tension interventions can improve the dapped-end beams' structural performance. Hence, dapped-end beam's 3D numerical models were built using ATENA finite element software15 to simulate two experimental tests from the literature, which differ significantly in terms of load-bearing capacity. The models were calibrated to predict the experimental results and, afterward, a post-tension intervention was designed and implemented in the models considering the level of prestressing as the main intervention's parameter. The numerical simulation results showed the achievable performance improvement in both ultimate and cracking loads as a function of the prestress level. Moreover, the intervention caused some changes in the failure mode as demonstrated by the crack patterns predicted by the FE models.
2 THE POST-TENSION RETROFIT TECHNIQUE
Reinforced concrete dapped-end beams can fail through several modes depending on the amount and arrangement of steel reinforcement. Cracks can develop in both the dapped (nib) and the undapped part according to five possible modes observed in experimental testing campaigns and in real structures' failures.16 According to,12 the possible failures under a loading system provoking a reaction V, are depicted in Figure 2a.
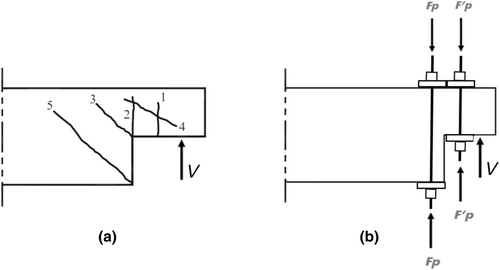
As dapped ends represent disturbed regions17 of RC beams, most of the failure modes are related to shear stresses typically under the shape of inclined cracks, such as modes 3, 4, and 5 in Figure 2a. Mode 2 is related to direct shear, while only mode 1 is related to bending stress. A comprehensive analysis of dapped-end beams' failure modes is described in,9 which reports a database including experimental test results of 147 specimens. It was found that the most common failure modes are 3, 4, and 5 that can be detected alone or combined (they were found in 95% of specimens). This means that the application of post-tension forces Fp and/or (Figure 2b) could increase the failure load values with respect to those modes, preventing the onset of the inclined cracks associated. It is worth noting that the application of is rather difficult due to the narrow space between the upper and lower nibs (Figure 1).
The same study9 highlighted how the post-tension technique emerged as the most versatile among several investigated options due to its many advantages. The low-cost required materials, relative ease of application, and ability to improve both failure load capacity (ultimate limit state, ULS) and cracking load value (serviceability limit state, SLS) make it one of the most affordable options to retrofit dapped-end beams. Moreover, in case of materials degradation due to steel corrosion and/or concrete cracking, repair works can be carried out by local restoration measures applied before the post-tension intervention.
Post-tension rods can be installed through holes drilled in the floor slab (Figure 3). Holes are drilled near the girder sides and the edge of the undapped region (Figure 3a,b). High-strength steel rods are placed and fastened on top and bottom steel plates. Adequate plate thickness should be adopted to guarantee uniform contact stress distribution between steel and concrete.
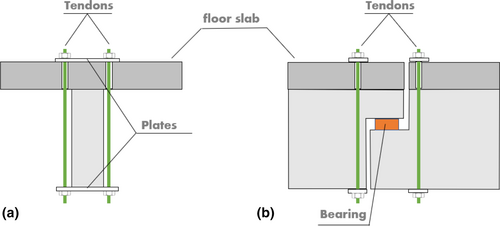
Finally, the design prestressing force Fp (being the sum of the two ties' forces) must be applied to the rods in order to make them active in improving the structural performance of the dapped-end beam at hand. It is worth noting that this kind of retrofitting technique has already been applied in real structures,18, 19 even though, in those cases, it was not possible to evaluate the actual performance improvement. For this reason, the subsequent numerical investigation focuses on a laboratory experiment, which provided measurable performance permitting a fine calibration and further analyses to determine the effect of retrofitting measures.
3 NUMERICAL INVESTIGATION
3.1 Specimens description and numerical modeling
This section describes the numerical investigation carried out by nonlinear finite element analyses on two dapped-end beams (Figure 4), based on an experimental campaign made by Rajapakse et al.20 The experimental program considered different detailing of the two beam ends, in order to make more tests on the same beam, even though all the specimens had the same geometry and dimensions in terms of concrete volume. Referring to beams 1 and 2, 3D nonlinear modeling focused on the dapped-ends 1-OL1 and 2-OL3, highlighted on the left-hand side in Figure 4a,b, respectively.
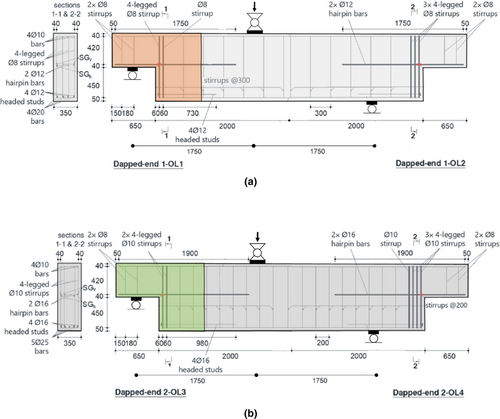
The choice of modeling dapped-ends 1-OL1 and 2-OL3 is due to the possibility of applying the post-tension intervention to specimens with very different characteristics in terms of structural performance (e.g., the peak load of 2-OL3 is almost double that of 1-OL1) and also in terms of observed failure modes, as discussed later on. As for the 1-OL1 dapped-end, the vertical reinforcement near the re-entrant corner is made by an 8 mm diameter 4-legged stirrup plus a 2-legged stirrup (total steel amount Av = 301.44 mm2). The horizontal reinforcement is made by two 12 mm diameter hairpin bars (total steel amount Ah = 452.16 mm2).
Dapped-end 2-OL3 is provided with a higher amount of vertical and horizontal reinforcement, made, respectively, by 2 layers of 10 mm diameter 4-legged stirrups (total steel amount Av = 628 mm2) and two 16 mm diameter hairpin bars (total steel amount Ah = 803.84 mm2).
The total beams' depth is equal to 1000 mm, while the width is equal to 350 mm. As for the reinforcing steel, test data are available regarding each bar diameter used, according to Table 1.
| Φ (mm) | fy (MPa) | fu (MPa) | εy (−) | εu (−) | Es (GPa) |
|---|---|---|---|---|---|
| 8 | 521 | 643 | 0.00297 | 0.0982 | 175 |
| 10 | 509 | 643 | 0.00272 | 0.1132 | 187 |
| 12 | 537 | 634 | 0.00265 | 0.1204 | 203 |
| 16 | 599 | 703 | 0.00303 | 0.0927 | 198 |
| 20 | 598 | 694 | 0.00293 | 0.09 | 204 |
| 25 | 540 | 647 | 0.00264 | 0.0998 | 204 |
The mean cylinder concrete strength is fcm = 56.8 MPa, while the maximum aggregate size is 16 mm. Based on this data, all other relevant material properties were evaluated according to the Italian building code21 and Model Code,22 to perform the subsequent nonlinear modeling (Table 2).
| Parameter | Units | Value |
|---|---|---|
| Uniaxial compressive strength, | MPa | 56.80 |
| Elastic modulus, Ec | MPa | 37,044 |
| Strain at compressive strength, εc | — | 0.002 |
| Tensile strength, | MPa | 4.01 |
| Unit fracture energy, GF | N/m | 101.2 |
| Poisson's coefficient, ν | — | 0.20 |
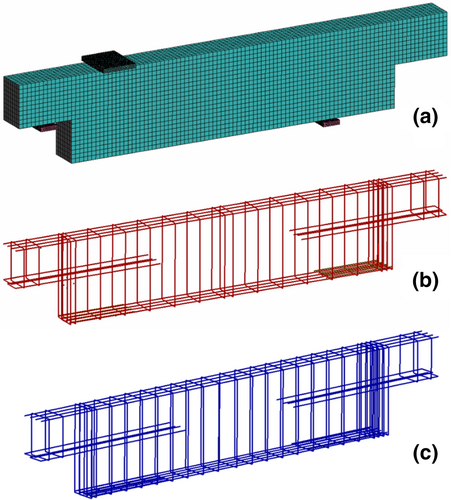
Properties of steel and concrete are utilized for the nonlinear model created in ATENA 3D environment version 5.9.0,15 through hexahedral linear (8-noded) finite elements for concrete members. The modeling activity was devoted to reproducing as consistently as possible the experimental conditions related to the test made by Rajapakse et al.,20 recreating the exact position of loads and restrains and using several monitoring points in order to acquire physical entities from the models to evaluate their mechanical performances and compare them with the experimental ones. Reinforcing rebars were modeled employing 1D truss elements embedded in concrete (Figure 5) capable of absorbing axial load only. Overall, both models include more than 13,000 hexahedral elements for the concrete volume and 1300 truss elements for the reinforcing steel bars. The restraining plates were modeled using tetrahedral elements. Finally, both models are made of more than 21,700 nodes. The size of hexahedral elements was chosen to be averagely equal to 0.05 m, resulting from a mesh sensitivity analysis. In fact, the size of hexahedral elements was increased starting from a side dimension of 0.025 m, which is considered to determine a fine mesh in full-scale engineering structures specimens.
A significant role in the description of nonlinear fracture mechanics of the 3D finite element model is played by the materials' constitutive relations, which should allow for consideration of the crushing and cracking of concrete, as well as the yielding and fracture of steel. Due to the monotonic nature of the experimental test modeled, in a similar manner to previous studies,23 a perfect bond was considered between steel and concrete. In fact, bond deterioration is mainly observed in cyclic loading, which is not the case in the examined experimental test.
As for concrete, analyses considered the plane stress state and a smeared cracks approach to model the damage. The concrete behavior in the biaxial stress state is described by effective stress and the equivalent uniaxial strain , which is used in order to eliminate the Poisson's effect. The concrete equivalent uniaxial stress–strain relationship is plotted in Figure 6a.

The tensile behavior of concrete (Figure 6b) is assumed linear upon reaching the strength . When this stress is reached, the concrete crack's propagation is modeled by an exponential crack-opening law (Figure 6b) based on fracture energy.22
The ascending part of the compressive branch follows the Model Code (1990) law22 ending at the peak value . Relationships between equivalent values (, ) and uniaxial values (fcm and ) are based on the biaxial stress failure criterion according to Ref. [24].
The characteristic compressive strength is determined as fck = fcm – 8 = 48.8 MPa. The design compressive stress is calculated through the expression ,21 where γc = 1.5 is the partial safety factor of concrete.
The steel reinforcement behavior was modeled using a bilinear stress–strain relationship with elastic modulus equal to 200,000 MPa, stress and strains at yielding and ultimate, as reported in Table 1, according to the different diameters of rebars.
3.2 Comparison of numerical and experimental behavior
3.2.1 Dapped-end 1-OL1
To evaluate the nonlinear FE model's capability of predicting the experimental behavior, a series of response parameters are compared. To compare the experimental and numerical behavior of the weakest end 1-OL1 (Figure 7a), it is worth noting that Rajapakse et al.20 monitored, among others, the crack opening at the re-entrant corner through LVDTs (DT3 and DT4 in Figure 7b), as well as the applied loads and reactions during the experiments. In this case, modeling the specimen's response through a detailed FE simulation is not a straightforward task, since DT3 and DT4 transducers are very close to the most damaged zone and their measurements could have been affected accordingly.
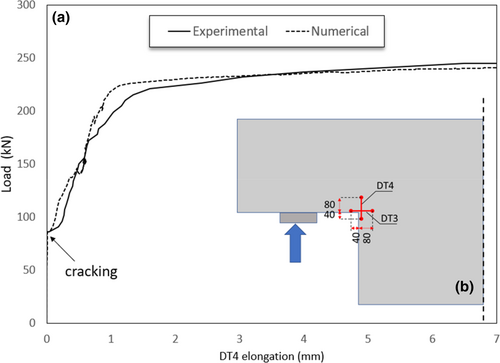
Despite this, the modeling effectiveness is testified by the superposition of the experimental and numerical load-deformation curves, as can be seen in Figure 7a and Table 3. The restraint vertical reaction V is plotted as a function of the vertical crack opening displacement measured by the DT4 transducer (Figure 7b). As can be seen, experimental and numerical behaviors are rather similar, throughout the deformation range. The model predicts very well the cracking load (equal to about 78 kN) with respect to the experimental test (75 kN).
| Cracking load Vc | Peak load Vu | Re-entrant corner crack width at yielding | Re-entrant corner crack width at peak load | |
|---|---|---|---|---|
| (kN) | (kN) | (mm) | (mm) | |
| Experimental | 75 | 245 | 0.71 | 8.14 |
| Numerical | 78 | 240 | 0.70 | 8.50 |
| Ratio | 1.04 | 0.98 | 0.99 | 1.04 |
The tested specimen showed a crack pattern according to mode 3 (Figure 2a), which is related to diagonal tension at the re-entrant corner of the dapped-end (Figure 8a). However, the model can predict the sequence of yielding. In fact, the vertical 4-legged stirrups yield before the horizontal ones (see Figure 8b).
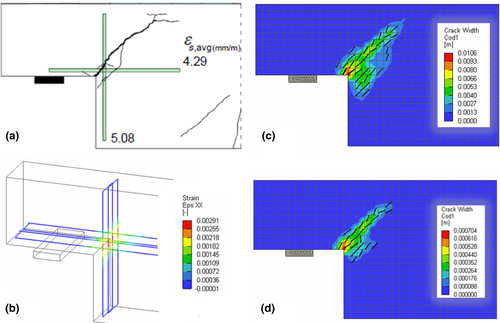
The re-entrant crack opening is the maximum width of the diagonal crack extending from the dapped-end corner. It is calculated by composing the deformations related to DT3 (horizontal) and DT4 (vertical) by the square root of the sum of the squares rule (SRSS). This allows computing the crack width measured orthogonally to the crack propagation direction. This crack width can be compared with the crack opening displacement provided by the numerical analysis. In order to compute the numerical crack width values, starting from the crack width colormaps, we retrieve the middle line of the crack in the corner finite element (re-entrant corner) extending throughout the element, being representative of the experimental crack monitored through DT3 and DT4 sensors. This line is then split into different segments for each color present along the line in the element and finally, the weighted average of crack width is calculated based on the relative length of these segments.
As can be seen from Table 3, the comparison of crack data is satisfactory, with an error in the range of 1%–4%, being very low.
In summary, the model predicts the experimental behavior very well, regarding the load–displacement relation, crack patterns, and reinforcement-yielding sequence. Less accuracy is observed for deformation values in the range 0.7–1.7 mm, probably due to local material (concrete) variability,27 which was not accounted for by the finite element model.
3.2.2 Dapped-end 2-OL3
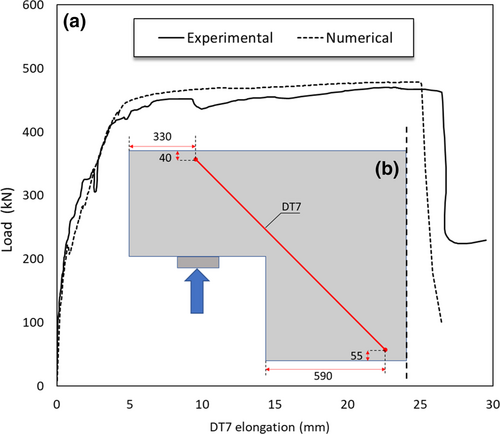
As for the 2-OL3 dapped-end, Figure 9a shows the overlap of load-deformation curves related to the experimental test and the numerical model. In this case, the curves were plotted in terms of displacements monitored by transducer DT7, positioned as shown in Figure 9b, as it is located far from the re-entrant corner from which the cracks propagate toward the nib and the undapped portion (Figure 10a) and thus difficult to monitor using transducers DT3 and DT4. As can be seen, the numerical model reproduces a behavior quite similar to the experimental test for both low load values and higher values near failure. As reported in Table 4, the error is only 4% in terms of the first cracking load Vc and 1% in terms of Vu.
| Cracking load Vc | Peak load Vu | Re-entrant corner crack width at yielding | Re-entrant corner crack width at peak load | |
|---|---|---|---|---|
| (kN) | (kN) | (mm) | (mm) | |
| Experimental | 86 | 472 | 1.20 | 14.14 |
| Numerical | 89 | 478.8 | 1.08 | 13.35 |
| Ratio | 1.03 | 1.01 | 0.90 | 0.94 |
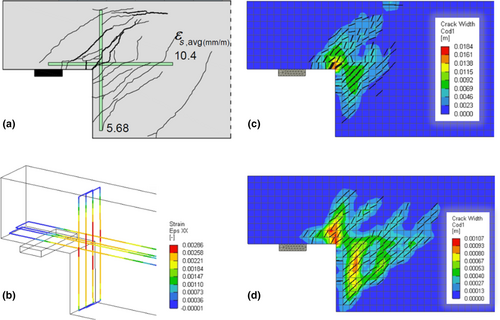
The experimental test exhibits a failure mechanism that includes modes number 3, 4, and 5 in Figure 2, with wider cracks related to mode 3 (Figure 10a). As shown in Figure 10c, the numerical model reproduces this crack pattern and also replicates the sequence of yielding of the rebars located near the re-entrant corner, with the yielding occurring first in the first layer of vertical stirrups and then in the horizontal ones (Figure 10b).
The last two columns of Table 4 report also the re-entrant corner crack width at yielding and at peak load both for the experimental test, computed as in the previous case, and the numerical model. Also in this case, the comparison of crack data shows a good agreement.
The result of the modeling activities on 1-OL1 and 2-OL3 specimens demonstrated the accuracy of the predicted mechanical behavior and can be used for the subsequent simulations considering the presence of external post-tension retrofit systems.
4 MODELING AND ANALYSIS OF THE RETROFIT INTERVENTION
The intervention is simply made by two external steel post-tensioned bars (one on each beam's side) according to the solution applied to specimen no. 2 by Atta and Taman.13 These bars can be installed through holes drilled in the floor slab and steel plates (ordinary steel, Table. 5) at the bottom and top of the undapped part of the beam (Figure 11) to uniformly distribute the load applied by the tendons.
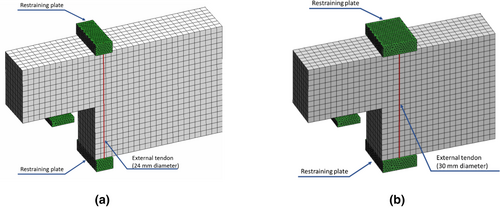
The intervention design should be devoted to calculating the total force Fp needed to obtain the required load-bearing capacity improvement for the specimen at hand. This task can be performed through kinematic methods (e.g., Ref. [28]) capable of predicting the peak load of dapped-ends with a behavior governed by an inclined crack at the re-entrant corner. This method is based on equilibrium and compatibility equations and it aims to estimate the strength in the absence of advanced numerical methods. In this case, a more straightforward approach can help evaluate the tendons' reaction needed to obtain load capacity improvement . This is possible thanks to the results from the FE models (e.g., failure mode, re-entrant corner crack angle, depth of the compression zone).
Figure 12 shows the ideal 45° crack developing from the corner to the border of the concrete compression zone, which has been identified by analyzing the concrete compressive plastic strain values at peak load. The only area with non-zero values is clearly visible, and its depth can be easily measured (x = 60 mm and x = 50 mm, respectively, for the 1-OL1 and 2-OL3 dapped-end).
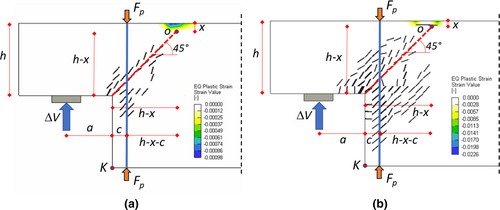
Relating to dapped-end 1-OL1, assuming (increasing the joint capacity by 50%) and , the tendons force can be obtained equal to 249.9 kN. This is the force provided by two tendons. The tendons area is determined by imposing a working stress of 50% with respect to the yielding stress (fyb = 900 MPa for high-strength 10.9 class steel,21 Table 6). This way, the resulting diameter is equal to 24 mm. Regarding the 2-OL3 dapped-end, in a similar way, assuming , it can be obtained a value of 491.6 kN for the tendons force, which results in a bar diameter of 30 mm.
It is worth noting that the restraining plates in the 2-OL3 specimen are wider compared with 1-OL1 due to the higher force exerted by the tendons, which have an almost double cross-section area (Table 6).
Once the intervention has been roughly designed, additional numerical simulation must be carried out on the updated numerical models including the tendons. The numerical analyses are performed with the same monotonic procedure, always starting from zero-loading conditions, therefore considering the models undamaged, choosing the tendons prestress as the main parameter, which is assumed in the range of 0.05 fyb – 0.40 fyb. Consequently, another important parameter is σc, which represents the normal stress between the restraining plates and the underlying concrete, obtained as the ratio between Fp and the plates' surface in contact with the concrete (350 × 150 mm2 and 350 × 300 mm2, respectively, for 1-OL1 and 2-OL3 dapped-end). This stress value is related to the axial load applied by the tendons to the concrete region near the re-entrant corner and is shown as ratio σc/fcd in Tables 7 and 8, where fcd is the design compressive strength of concrete.
| Analysis | σp/fyb | Post-tension stress σp | Post-tension load Fp | σc | fcd | σc/fcd |
|---|---|---|---|---|---|---|
| (−) | (MPa) | (kN) | (MPa) | (MPa) | (−) | |
| 1 | 0.00 | 0 | 0.00 | 0.00 | 27.65 | 0.00 |
| 2 | 0.05 | 45 | 31.8 | 0.61 | 0.02 | |
| 3 | 0.10 | 100 | 70.6 | 1.34 | 0.05 | |
| 4 | 0.15 | 135 | 95.3 | 1.82 | 0.07 | |
| 5 | 0.20 | 200 | 141.2 | 2.69 | 0.10 | |
| 6 | 0.30 | 270 | 190.6 | 3.63 | 0.13 | |
| 7 | 0.40 | 360 | 254.2 | 4.84 | 0.18 |
| Analysis | σp/fyb | Post-tension stress σp | Post-tension load Fp | σc | fcd | σc/fcd |
|---|---|---|---|---|---|---|
| (−) | (MPa) | (kN) | (MPa) | (MPa) | (−) | |
| 1 | 0.00 | 0 | 0.00 | 0.00 | 27.65 | 0.00 |
| 2 | 0.05 | 45 | 52.3 | 0.50 | 0.02 | |
| 3 | 0.10 | 100 | 116.2 | 1.11 | 0.04 | |
| 4 | 0.15 | 135 | 156.9 | 1.49 | 0.05 | |
| 5 | 0.20 | 200 | 232.4 | 2.21 | 0.08 | |
| 6 | 0.30 | 270 | 313.7 | 2.99 | 0.11 | |
| 7 | 0.40 | 360 | 418.3 | 3.98 | 0.14 |
In previous experimental tests (e.g., Ref. [13]), a tendons' prestress equal to 0.30 fyb was applied. To compare the prestress level with that used in this investigation, it is more useful to compare the σc values. In fact, in Ref. [13] σc was equal to 2.77 MPa, which is similar to case 5, for the first dapped-end, and case 6, for the second one, of this study with σc = 2.69 MPa and σc = 2.99 MPa, respectively, corresponding to a prestress value equal to σp/fyb = 0.20 and 0.3 (see Tables 7 and 8).
- Interval 1: application of the beams self-weight;
- Interval 2: the retrofit intervention becomes active and post-tension is applied through a proper number of analysis steps;
- Interval 3: displacement-controlled analysis up to failure. The vertical deflection is increased to find the dapped-end ultimate load Vu and check the ultimate deflection and related ductility.
All the subsequent comparative analyses are made among numerical results. Therefore, the behavior evaluation is performed in terms of support reaction V and absolute vertical displacement of point K (Figure 12) in place of the DT4 and DT7 transducers.
4.1 Analysis of results
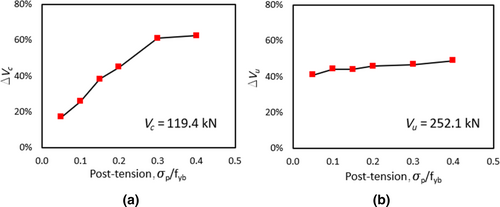
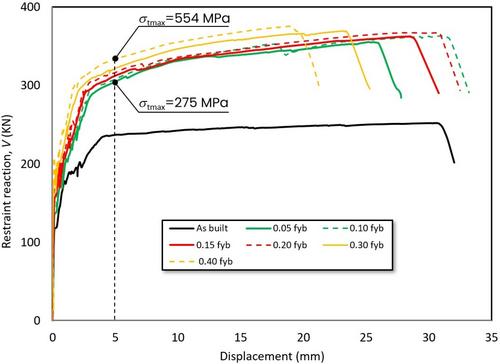
The behavior of retrofitted models is evaluated in terms of both serviceability (SLS) and ultimate limit state (ULS), as a function of the applied post-tension value σp/fyb. SLS is evaluated with respect to cracking load Vc able to form cracks having a width equal to the limit value required by the code.21 This crack width threshold is set equal to 0.20 mm, as a function of the environmental aggressivity and steel sensitivity to corrosion. Relating to 1-OL1 dapped-end, Vc increases almost linearly as post-tension values increase, as can be seen from both Table 9 and Figure 13a. Only beyond σp/fyb = 0.30, the performance improvement stabilizes just above 60%. Regarding the ULS, it can be noted that the ultimate load Vu already shows a significant improvement when minimum post-tension (σp/fyb = 0.05) is applied (ΔVu = 45%), even though its gains are slightly higher for larger post-tension values, reaching about 53.2% for σp/fyb = 0.40 (Figure 13b).
| SLS | ULS | ||||||
|---|---|---|---|---|---|---|---|
| σp/fyb | σp | Vc | ΔVc | Vu | ΔVu | du | σt,max |
| (−) | (MPa) | (kN) | (−) | (kN) | (−) | (mm) | (MPa) |
| 0.00 | 0.00 | 119.4 | — | 252.1 | — | 32.0 | — |
| 0.05 | 45.0 | 139.7 | 17.0% | 355.3 | 45.0% | 27.8 | 642.2 |
| 0.10 | 90.0 | 150.0 | 25.6% | 363.6 | 48.4% | 33.2 | 720.6 |
| 0.15 | 135.0 | 165.0 | 38.2% | 363.0 | 48.2% | 30.8 | 721.5 |
| 0.20 | 180.0 | 173.0 | 44.9% | 367.6 | 50.0% | 32.5 | 752.0 |
| 0.30 | 270.0 | 192.3 | 61.1% | 369.8 | 50.9% | 25.4 | 758.6 |
| 0.40 | 360.0 | 194.0 | 62.5% | 375.3 | 53.2% | 21.2 | 762.1 |
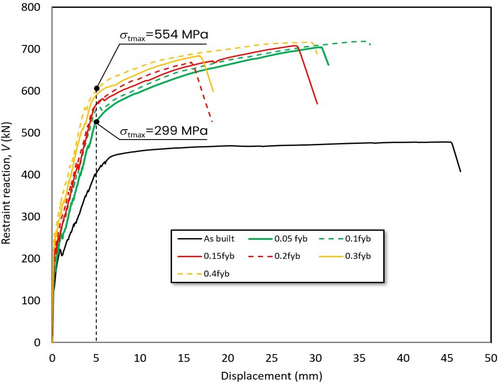
Regarding the 2-OL3 dapped-end, results have a similar trend compared with 1-OL1. In fact, the cracking load increases almost linearly as a function of post-tension, reaching values up to 87% for σp/fyb = 0.40, then showing higher effectiveness (Figure 14a and Table 10).
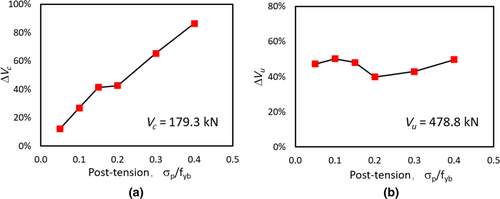
In terms of ultimate load Vu, 2-OL3 dapped-end shows performance improvements between 40% and 50% slightly lower than those obtained for 1-OL1, being not significantly dependent on the post-tension level (Figure 14b).
To somehow validate the results just discussed, it is worth comparing them to previous experimental campaigns. For example, in Ref. [13] post-tension techniques similar to the one used in this study were able to provide a performance improvement in the range of 65%–83%, depending on the intervention details used. In Ref. [9] the post-tension techniques were compared with other kinds of solutions, such as jacketing (steel or concrete-based) and application of externally bonded composites (FRP strips of fabrics). Post-tension was demonstrated to be cheaper, easier to apply, and able to improve both SLS and ULS performance. On the contrary, due to delamination problems at the ULS, jacketing, and FRP are effective mainly concerning SLS.
Regarding the 1-OL1 dapped-end, the deformation capacity was conventionally determined as the displacement value corresponding to a loss of 20% with respect to the peak load.30, 31 After that point, each load–displacement curve was truncated. Figure 15 shows the envelope of all the retrofitted models' curves together with the one of the as-built model. While the peak load always increases with post-tension, the ultimate displacement du is less correlated, as can also be seen in Table 9. However, for σp/fyb >0.10, increasing the tendons' prestress leads to a reduction of ductility, as expected.
In the case of 2-OL3 dapped-end, for some of the post-tension levels, the descending branch was not observed due to excessive concrete cracking. However, as can be seen from Figure 16 and Table 10, the peak load always increases with post-tension. On the contrary, the ultimate deflection ranges between 30 and 36 mm, except for σp/fyb values equal to 0.2 and 0.3, for which the ultimate deflection is equal to about 18 mm. Averagely, for the retrofitted condition, the ultimate deformation values of specimen 2-OL3 are lower than those of 1-OL1.
| SLS | ULS | ||||||
|---|---|---|---|---|---|---|---|
| σp/fyb | σp | Vc | ΔVc | Vu | ΔVu | du | σt,max |
| (−) | (MPa) | (kN) | (−) | (kN) | (−) | (mm) | (MPa) |
| 0.00 | 0.00 | 159.8 | — | 478.8 | — | 46.8 | — |
| 0.05 | 45.0 | 179.3 | 12.2% | 705.1 | 47.3% | 31.5 | 860.0 |
| 0.10 | 90.0 | 202.8 | 26.9% | 719.2 | 50.2% | 36.2 | 900.0 |
| 0.15 | 135.0 | 225.9 | 41.4% | 708.9 | 48.1% | 30.2 | 860.4 |
| 0.20 | 180.0 | 227.8 | 42.6% | 669.4 | 39.8% | 18.2 | 687.2 |
| 0.30 | 270.0 | 264.2 | 65.3% | 684.4 | 42.9% | 18.3 | 756.5 |
| 0.40 | 360.0 | 297.8 | 86.4% | 716.9 | 49.7% | 30.2 | 900.0 |
Finally, the maximum tendons' stress σt,max (at peak load) is reported in Tables 9 (last column), respectively, for the 1-OL1 and 2-OL3 dapped-ends. As can be seen, this value varies between 642.2 and 762.1 MPa (from 71.3% to 85% of fyb), respectively, for σp/fyb = 0.05 and σp/fyb = 0.40, for the 1-OL1 dapped-end. Relating to the 2-OL3 dapped-end, the maximum tendons' stress exhibits higher values, in fact it ranges between the minimum value of 687.2 MPa (76.3% of fyb) for σp/fyb = 0.2, and the maximum value of 900 MPa (100% of fyb) for σp/fyb = 0.1 and 0.4. Therefore, the tendons' stress level is higher than that assumed in the design phase (50% of fyb), even though it remains under the yielding stress in the first case, while it reaches the yielding in the other one.
Considering a lower applied load yet beyond that one causing reinforcement yielding (e.g., corresponding to a 5 mm deflection, Figures 15 and 16), the models with 0.05 fyb exhibit a maximum tendons' stress equal to 275 MPa (30% of fyb) for the 1-OL1 dapped end, and 299 MPa (33% of fyb) for the 2-OL3 one, while the models with 0.4 fyb reach a maximum tendons' stress of 554 MPa, which is 61.5% of fyb, for both the dapped-ends. It can be concluded that the design criterion is somewhat acceptable, as it results in a good agreement with dapped-end behavior. In fact, the tendons' stress values are lower than the yielding one.
5 ANALYSIS OF FAILURE MODES
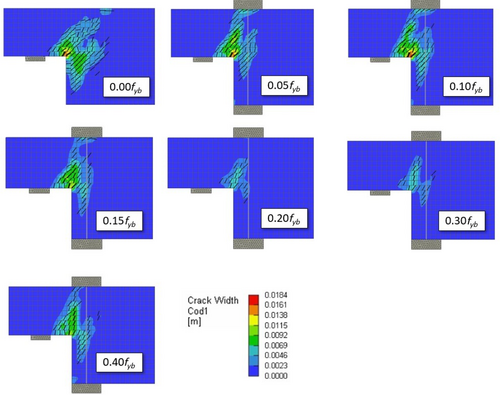
This section aims to analyze the failure modes of the studied dapped-end beams to highlight changes caused by the post-tension intervention. Figures 17 and 18 show the crack width colormaps at peak load for each of the seven numerical models, respectively, for the 1-OL1 and the 2-OL3 dapped-end. These colormaps are all reported referring to the same scale to better compare patterns. As expected, larger cracks are observed in the absence of retrofit intervention, with a maximum width between 8 and 10 mm in the case of 1-OL1 dapped-end, and between 13 and 18 mm for the 2-OL3 one. In the presence of post-tension, regarding the 1-OL1 end, the crack width significantly reduces below 5 mm when prestress is under 0.15 fyb, while it furtherly drops under 4 mm for prestress values approaching the maximum investigated (0.40 fyb). Therefore, the studied post-tension interventions can reduce crack width to about 50%, while increasing the load capacity by more than 50%.
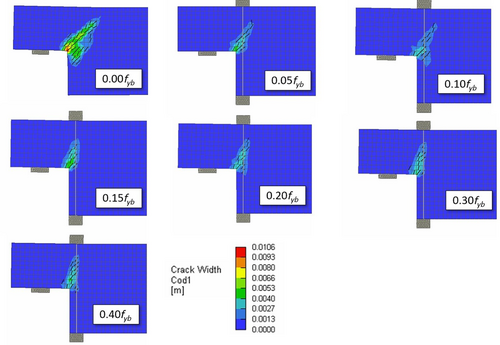
Moreover, while the tendons' prestress increases, the crack angle with respect to the beam axis progressively increases toward the vertical direction. This means that the original failure mode 3, which characterized the as-built 1-OL1 specimen, modifies in the presence of external prestressing, showing an almost vertical crack pattern for 0.40 fyb. This is similar to failure mode 2, according to Ref. [12], which is characterized by direct shear at the interface between the dapped and undapped region of the beam.
As for the 2-OL3 specimen (Figure 18), in the presence of post-tension, the original mechanism according to modes 3, 4, and 5 shifts toward modes 1 and 4 related to shear and flexure cracking of the dapped region.
Furthermore, the horizontal and vertical steel reinforcement strains (Figures 19 and 20), at peak load, can provide valuable information. They are reported for the as-built model and for the ones with post-tension equal to 0.05 fyb and 0.40 fyb, which are the extreme values. For the as-built model related to 1-OL1 dapped-end, strains are higher in the vertical rebars (stirrups at re-entrant corner), approaching the value of 10% (ultimate value according to the test results in Table 1). Also, horizontal hairpin rebars have significant strain values, even though the failure of the dapped-end is due to the vertical ones, as reported in the experimental test. Observing the retrofitted models, only horizontal rebars reach the rupture strain (equal to around 11%), while vertical rebars are in the elastic range or even under compression due to the tendons' action. Therefore, the failure significantly depends on the horizontal hairpin rebars, which are critical to the dapped-end's load-bearing capacity and failure mechanism. Indeed, failure mode 2 (direct shear) is related to the amount of steel crossing the vertical crack between the dapped and undapped region.


Relating to the 2-OL3 dapped-end, Figure 20 shows a rather similar behavior with the difference mainly represented by the fact that tensile strain values in the retrofitted models are lower than those obtained for the 1-OL1 specimen. In fact, maximum strains are in the range of 5.3%–8.1% indicating that rebars, due to the stronger tendons' action, do not approach the fracture strain. This is in agreement with the lower deformation capacity of the 2-OL3 retrofitted models, as mentioned above.
6 CONCLUSIONS
This paper numerically evaluates a post-tension rehabilitation solution for RC dapped-end beams applied to two experimentally tested specimens provided with different reinforcing steel amounts and characterized by different load-bearing capacities and failure modes. A simple design method has been used to dimension post-tension tendons, and their effectiveness is investigated as a function of the applied prestress. The numerical simulations were first aimed at carefully calibrating 3D nonlinear finite element models, able to effectively predict the experimental load-deformation relation as well as the crack patterns. Afterward, the models were used to investigate the dapped-end beams' behavior in the presence of the retrofitting intervention.
- The performance improvement due to the post-tension intervention at the serviceability limit state (e.g., an increase of cracking load, Vc) is almost a linear function of the applied prestress, reaching values up to 87%, when prestress is 0.40 fyb.
- The improvement of the ultimate load-bearing capacity is slightly dependent on the prestress level, since, even under the lower prestress value (0.05 fyb), a significant peak load increase is obtained, being in the range of 45%–53% for 1-OL1 specimen and 40%–50% for 2-OL3 specimen.
- The deformation capacity is slightly lower for 2-OL3 in the retrofitted condition due to heavier concrete cracking. However, for both specimens, even in the presence of intervention, the full yielding of rebars occurs.
- The post-tension intervention inhibits or changes the failure modes observed in the as-built condition (mode 3 for 1-OL1, modes 3-4-5 for 2-OL3) changing it consistently to failure mode 2 (direct shear failure) for 1-OL1 specimen and to modes 1 and 4 (flexure and shear failure of the dapped region), for 2-OL3 specimen.
- In all cases, the tendons' stress remains in the elastic range, far from the yielding value, as it is desirable for an external post-tension system, demonstrating the effectiveness of the proposed design method.
In summary, considering the numerical results, the presented retrofit technique appears to be suitable for dapped-end beams with various features in terms of steel amount and consequent failure modes. Before applying such a retrofit solution, it is recommended to carefully evaluate the expected failure mode in the as-built condition, since post-tension is effective in case modes 3, 5, or both are present.
Nomenclature
-
- A
-
- restraining plates width
-
- B
-
- restraining plates length
-
- dmax
-
- maximum aggregate size
-
- du
-
- ultimate deflection
-
- Ec
-
- concrete Young's modulus
-
- Es
-
- reinforcement Young's modulus
-
- fcd
-
- concrete compressive strength
-
- fck
-
- concrete compressive characteristic strength
-
- fcm
-
- concrete mean compressive strength
-
- Fp
-
- total tendons' load
-
- ft
-
- concrete tensile strength
-
- ftb
-
- failure stress of tendons' steel
-
- fts
-
- failure stress of ordinary steel
-
- fu
-
- reinforcement failure stress
-
- fy
-
- reinforcement yielding stress
-
- fyb
-
- yielding stress of tendons' steel
-
- fys
-
- yielding stress of ordinary steel
-
- GF
-
- fracture energy
-
- H
-
- restraining plates thickness
-
- V
-
- dapped-end's vertical reaction
-
- Vc
-
- cracking load
-
- Vu
-
- peak load
-
- Vy
-
- yielding load
-
- γc
-
- concrete partial safety factor
-
- ΔVc
-
- variation of cracking load
-
- ΔVu
-
- variation of ultimate load
-
- εc
-
- concrete strain at compressive strength
-
- εu
-
- reinforcement failure strain
-
- εy
-
- reinforcement yielding strain
-
- ν
-
- Poisson's coefficient
-
- σc
-
- post-tension compressive stress on concrete
-
- σp
-
- tendons' stress
-
- σt,max
-
- maximum tendons' stress
-
- Φ
-
- reinforcing bar diameter
ACKNOWLEDGMENTS
This research was partly funded by the Italian Department of Civil Protection in the framework of the 2022–2024 DPC-ReLUIS project, WP5, task 5.4 “Upgrading and retrofitting interventions of existing bridges.”
Biographies

Giuseppe Santarsiero, Assistant Professor, Lecturer of Bridge Engineering, School of Engineering, University of Basilicata, Viale dell'Ateneo lucano, 10, 85100, Potenza, Italy. Email: [email protected]

Valentina Picciano, Doctoral Student, School of Engineering, University of Basilicata, Viale dell'Ateneo lucano, 10, 85100, Potenza, Italy. Email: [email protected]
Open Research
DATA AVAILABILITY STATEMENT
The data that support the findings of this study are available from the corresponding author upon reasonable request.


