Shear fatigue of prestressed I-beams with shear reinforcement
Discussion on this paper must be submitted within two months of the print publication. The discussion will then be published in print, along with the authors’ closure, if any, approximately nine months after the print publication.
Funding information: Hessian State Office for Road and Traffic Affairs; German Research Foundation, Grant/Award Numbers: HE 2637/25-1, HE 2637/12-1
Abstract
In the last decades, increasing traffic loads have led to higher requirements on the bearing capacity of existing and also new bridges. In particular, many bridge structures built in the 1960s and 1970s often contain less web reinforcement than the nowadays required minimum web reinforcement. In this context, the shear resistance under cyclic loading is of special interest. For this reason, experimental tests were conducted on prestressed concrete beams with and without shear reinforcement at the Institute of Structural Concrete of RWTH Aachen University within the last years to investigate the shear fatigue strength. The specimens were able to resist more load cycles than predicted by the approaches implemented in the Eurocodes for bridges. Based on the test results, design models for shear under cyclic loading should be reviewed and improved, especially with regard to the assessment of existing structures. This paper describes the recent tests on 20 I-shaped prestressed beams with web reinforcement.
1 INTRODUCTION
Bridges are an important part of the German federal highway system. The requirements on bridge structures have increased significantly in the recent years due to higher traffic volume, especially concerning heavy load traffic.1-4 A large number of bridges were designed and built in the 1960s and 1970s for lower load classes.5 In addition, the calculated static shear load capacity was reduced in the course of further development of the design standards6, 7 accounting for more durability and robustness. Therefore, many German bridges exhibit a deficit in shear strength applying the current standards (e.g. Eurocode 28-11) because of the lower required shear reinforcement of previous design rules.6, 12 The verification of shear resistance under cyclic loading has been required for concrete bridges in Germany since 2003 by introducing the DIN Fachbericht 102,7 which is based on Eurocode 2.13 Hence, a guideline to assess the load bearing capacity of existing bridges14, 15 was introduced and has been continuously refined, for example, in Reference 16-22. The second amendment is already in progress.23 The key element of this assessment guideline is a stepwise verification procedure, which is similar to the level-of-approximation approach of fib Model Code 2010.24 The stepwise verification procedure accounts for the characteristics of older bridges and enables a more refined determination of the structural capacity. However, in numerous cases, the resistance under shear and torsion as well as fatigue loads cannot be verified,25-27 although the webs of these prestressed bridges do not reveal any shear cracks. A further refinement of the shear assessment under static and fatigue loading can reduce the need for strengthening measures or restrictions of usage significantly and will extend the service life of existing bridge structures.
To investigate the cyclic shear capacity of prestressed concrete girders with and without shear reinforcement, experimental tests on 43 girders have been carried out until now28-31, 37 at the Institute for Structural Concrete of RWTH Aachen University. The main parameters of the investigation were shear reinforcement ratio, degree of prestressing and the cyclic part of the shear force. Beside the number of cycles until failure, the redistribution of shear stresses and forces in the shear reinforcement was the most important aspect of the investigations. The definition of cross-section geometry, shear reinforcement ratio, degree of prestressing and the load levels for the test specimen was based on an evaluation of typical existing federal highway bridges in Germany built between 1960 and 1970.
This paper presents the fatigue test on 20 I-shaped single span girders with shear reinforcement. The resisted load cycles are compared with the current German approach for cyclic shear loads which is based on Eurocode 2 (θ accounting for a concrete contribution by aggregate interlock, S-N curve9: ΔσRsk = 175 N/mm2; N* = 106; k1 = 5; k2 = 9). The results of the research project can be used for both the assessment of existing bridges and for the design of new prestressed concrete structures.
2 FATIGUE VERIFICATION OF SHEAR REINFORCEMENT
 ((1))
((1)) ((2))
((2)) ((3))
((3)) ((4))
((4))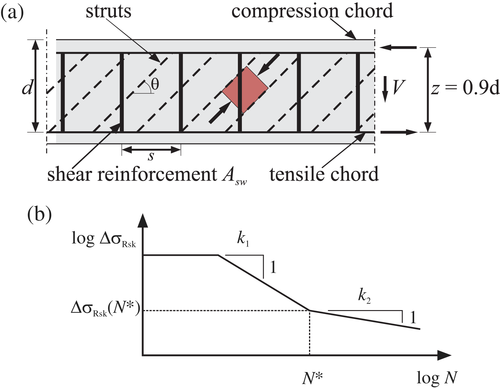
As cyclic loading is expected to reduce the concrete contribution by aggregate interlock due to local crushing of the crack surfaces, the stress of the shear reinforcement has to increase.32 This is considered by increasing the angle θ, determined in the ultimate limit state (ULS) design under static loading, according to Equation (3). The modified inclination of the struts under fatigue loading θfat may only be applied in the design of shear reinforcement. For the verification of the concrete struts, the angle of the ULS design should be assumed.
The stress in the shear reinforcement under maximum and minimum load calculated with θfat must not exceed the yield strength and the respective stress range Δσ (Equation (4)) has to be lower than the fatigue resistance, for example, ΔσRsk. The value ΔV describes the acting shear force range, z the inner lever arm and asw = Asw/s the cross-sectional area of the provided shear reinforcement. The fatigue strength of reinforcing steel is typically described by S-N curves (Figure 1b). The characteristic curves according to Reference 8 are defined by the stress exponents k1 and k2 as well as a characteristic fatigue strength ΔσRsk at N* cycles, which depend on type of reinforcement, bar diameter and in case of bent bars on mandrel diameter. With increasing stress range Δσ the number of load cycles until failure N decreases. All values were determined based on tests on single bars subjected to constant stress ranges. To determine the damage due to fatigue by variable stress ranges, the Palmgren-Miner Rule can be used.
3 EXPERIMENTAL INVESTIGATIONS
3.1 Test specimens
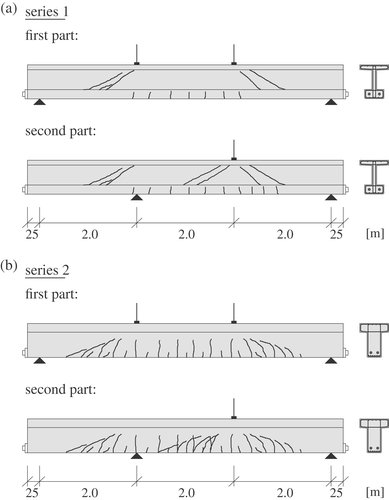
Considering the cross-section geometry, the experimental investigations of prestressed concrete beams with shear reinforcement can be divided into two test series (Figure 2). The first series with I-shaped beams (I-beams) was designed to exhibit shear failure with diagonal cracking in the web independent of bending cracks. In order to take into account the influence of bending cracking on the shear capacity, a further series of T-shaped cross-sections (T-beams) was investigated. With these beams the shear crack arise from bending cracks on the lower surface of the cross-section in the shear-loaded area. In the present paper only the I-beams are investigated, the test series of prestressed T-beams are discussed in further publication (Reference 37) .
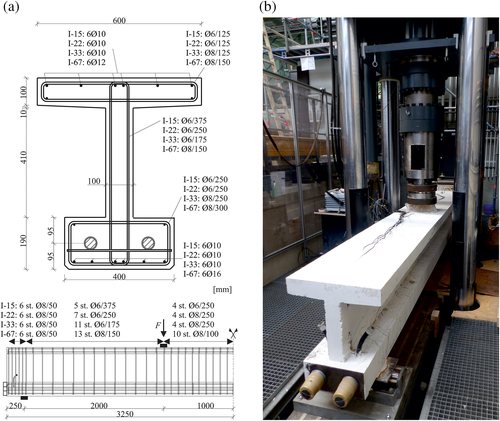
The I-beams with a web width of 0.1 m had a height of 0.7 m and a length of 6.5 m (Figure 3). The shear reinforcement ratios (ρw = asw/bw) in the web of the shear span varied between ρw = 0.15% and ρw = 0.67% using closed stirrups Ø6 or Ø8 with a steel grade B500. Within one beam both shear spans featured the same shear reinforcement ratio. The steel properties, determined by axial tension tests on single bars taken from the same batch, are shown in Table 1. In the middle part of the beam and at the support, the distance between the stirrups was reduced to avoid a premature failure in these areas. In longitudinal direction, either 6Ø10 or 6Ø16 were provided in the lower flange as flexural reinforcement (Figure 3).
| Beam no. | ρw (%) | fym (N/mm2) | ftm (N/mm2) | E modulus (N/mm2) | Pm,tm (kN) |
|---|---|---|---|---|---|
| I-15-1 | 0.15 | 575 | 613 | 200,311 | 636 |
| I-15-2 | 411 | ||||
| I-15-3 | 320 | ||||
| I-22-1 | 0.22 | 587 | 626 | 200,777 | 632 |
| I-22-2 | 432 | ||||
| I-22-3 | 320 | ||||
| I-22-4 | 0.22 | 595 | 633 | 203,761 | 314 |
| I-22-5 | |||||
| I-22-6 | |||||
| I-22-7 | |||||
| I-33-1 | 0.33 | 595 | 633 | 203,761 | 314 |
| I-33-2 | |||||
| I-33-3 | |||||
| I-33-4 | |||||
| I-67-1 | 0.67 | 504 | 645 | 198,384 | 314 |
| I-67-2 | |||||
| I-67-3 | |||||
| I-67-4 | |||||
| I-67-5 | |||||
| I-67-6 |
With an axial distance of 9.5 cm from the bottom side of the beam, two straight tendons (each 3Ø0.6″ [1.4 cm2]) were arranged for post-tensioning (St 1570/1770, fp0.1k = 1,500 N/mm2). After subtraction of all losses, the planned prestressing force for the beams varied between 314 kN and 636 kN (Table 1). The ready-mixed concrete was chosen to feature a relatively constant concrete strength during the test period of each beam. The mean strengths during the test period were in a range of 29 and 49 N/mm2 over all tests with a small scatter within each test beam (Table 2).
| Beam no. | Age (day) | fcm,cyl (N/mm2) | fctm,sp (N/mm2) | E modulus (N/mm2) | Vmax (kN) | Vmin (kN) | Cycles Ni (×103) | ∑ Ni (×103) | Status of test |
|---|---|---|---|---|---|---|---|---|---|
| I-15-1a | 25 (S) | 29.8 | 2.5 | 23,600 | 181.8 | — | 0.001 | 0.001 | Initial crack |
| — | — | — | — | 148.0 | 134.0 | 1,500 | 1,500 | No failure | |
| — | — | — | — | 167.8 | 152.3 | 1,500 | 3,000 | No failure | |
| — | — | — | — | 167.8 | 135.3 | 1,600 | 4,600 | No failure | |
| — | — | — | — | 167.8 | 119.8 | 1,110 | 5,710 | Stopped | |
| I-15-1b | — | — | — | — | 160.4 | 112.4 | 500 | 6,210 | No failure |
| 46 (E) | 32.5 | 2.5 | 22,800 | 160.4 | 95.9 | 1,175 | 7,385 | Stopped | |
| I-15-2a | 16 (S) | 37.7 | 2.9 | 28,600 | 163.3 | — | 0.001 | 0.001 | Initial crack |
| — | — | — | — | 133.3 | 120.3 | 1,000 | 1,000 | No failure | |
| — | — | — | — | 147.8 | 120.3 | 1,100 | 2,100 | No failure | |
| — | — | — | — | 147.8 | 105.3 | 2,098 | 4,198 | No failure | |
| — | — | — | — | 147.8 | 110.3 | 66 | 4,265 | Stopped | |
| I-15-2b | — | — | — | — | 140.4 | 97.9 | 384 | 4,650 | No failure |
| — | — | — | — | 155.9 | 124.9 | 1,000 | 5,650 | No failure | |
| — | — | — | — | 155.9 | 108.9 | 500 | 6,150 | No failure | |
| — | — | — | — | 163.4 | 114.9 | 500 | 6,650 | No failure | |
| — | — | — | — | 177.4 | 124.4 | 85 | 6,735 | Stopped | |
| 35 (E) | 41.0 | 3.3 | 25,800 | 203.4 | — | 0.001 | 6,735 | Residual | |
| I-15-3a | 13 (S) | — | — | 26,300 | 152.3 | — | 0.001 | 0.001 | Initial crack |
| — | — | — | — | 137.3 | 111.3 | 2,000 | 2,000 | No failure | |
| — | — | — | — | 137.3 | 98.3 | 3,500 | 5,500 | No failure | |
| — | — | — | — | 157.8 | 132.8 | 507 | 6,007 | No failure | |
| — | — | — | — | 157.8 | 127.8 | 50 | 6,057 | No failure | |
| — | — | — | — | 157.8 | 122.8 | 100 | 6,157 | No failure | |
| — | — | — | — | 157.8 | 127.8 | 300 | 6,457 | Stopped | |
| I-15-3b | 22 | 34,6 | 2,7 | 27,200 | 150.4 | 115.4 | 943 | 7,400 | No failure |
| — | — | — | — | 150.4 | 105.4 | 1,000 | 8,400 | No failure | |
| — | — | — | — | 160.4 | 115.4 | 500 | 8,900 | Stopped | |
| — | — | — | — | 209.5 | — | 0.001 | 8,900 | Residual | |
| I-15-3b2 | 34 (E) | 37.5 | 3.2 | 25,200 | 210.3 | — | 0.001 | 6,457 | Residual |
| I-22-1a | 16 (S) | 32.4 | 2.6 | 22,700 | 167.8 | — | 0.001 | 0.001 | Initial crack |
| — | — | — | — | 162.8 | 131.8 | 2,000 | 2,000 | No failure | |
| — | — | — | — | 162.8 | 116.3 | 2,670 | 4,670 | Stopped | |
| I-22-1b | — | — | — | — | 157.4 | 110.9 | 830 | 5,500 | No failure |
| — | — | — | — | 187.4 | 140.9 | 500 | 6,000 | Stopped | |
| — | — | — | — | 234.1 | — | 0.001 | 6,000 | Residual | |
| I-22-1b2 | 30 (E) | 36.6 | — | 23,800 | 203.5 | — | 0.001 | 4,670 | Residual |
| I-22-2a | 13 (S) | 32.7 | 2.5 | 27,500 | 157.9 | — | 0.001 | 0.001 | Initial crack |
| — | — | — | — | 145.3 | 120.8 | 60 | 60 | No failure | |
| — | — | — | — | 153.8 | 126.8 | 3,500 | 3,560 | No failure | |
| — | — | — | — | 153.8 | 107.3 | 6 | 3,566 | No failure | |
| — | — | — | — | 153.8 | 126.8 | 1,034 | 4,600 | No failure | |
| — | — | — | — | 153.8 | 116.3 | 1,300 | 5,900 | No failure | |
| — | — | — | — | 182.8 | 145.3 | 287 | 6,187 | Stopped | |
| I-22-2b | 28 (E) | 35.3 | 2.5 | 25,600 | 241.2 | — | 0.001 | 6,187 | Residual |
| I-22-3a | 14 (S) | 33.8 | 2.1 | 25,000 | 159.8 | — | 0.001 | 0.001 | Initial crack |
| — | — | — | — | 148.3 | 117.8 | 3,000 | 3,000 | No failure | |
| — | — | — | — | 148.3 | 105.3 | 1,804 | 4,804 | Stopped | |
| I-22-3b | — | — | — | — | 154.9 | 111.9 | 996 | 5,800 | No failure |
| 33 (E) | 36.6 | 2.6 | 25,600 | 253.8 | — | 0.001 | 5,800 | Residual | |
| I-22-4a | 9 (S) | 30.9 | 2.5 | 23,600 | 143.2 | — | 0.001 | 0.001 | Initial crack |
| 21 (E) | 34.6 | 2.8 | 23,400 | 129.0 | 85.0 | 3,000 | 3,000 | Stopped | |
| I-22-5a | 10 (S) | 34.6 | 2.8 | 24,900 | 162.4 | — | 0.001 | 0.001 | Initial crack |
| 22 (E) | 37.4 | 3.2 | 25,900 | 144.3 | 87.3 | 3,000 | 3,000 | Stopped | |
| I-22-6a | 10 (S) | 33.2 | 2.5 | 22,700 | 152.0 | — | 0.001 | 0.001 | Initial crack |
| 23 (E) | 33.9 | 2.7 | 23,300 | 167.3 | 123.3 | 3,250 | 3,250 | Stopped | |
| I-22-7a | 10 (S) | 30.0 | 2.5 | 25,200 | 145.2 | — | 0.001 | 0.001 | Initial crack |
| — | — | — | — | 159.8 | 102.8 | 1,000 | 1,000 | Stopped | |
| I-22-7b | 21 (E) | 33.5 | 2.7 | 23,100 | 159.8 | 102.8 | 853 | 1853 | Cyclic fail. |
| I-33-1a | 10 (S) | 34.9 | 2.9 | 23,800 | 162.3 | — | 0.001 | 0.001 | Initial crack |
| 27 (E) | 39.4 | 3.4 | 26,900 | 145.3 | 88.3 | 4,475 | 4,475 | Stopped | |
| I-33-2a | 14 (S) | 37.5 | 3.0 | 27,500 | 161.8 | — | 0.001 | 0.001 | Initial crack |
| 26 (E) | 39.5 | 2.8 | 27,200 | 145.3 | 70.0 | 1,404 | 1,404 | Stopped | |
| I-33-3a | 13 (S) | 29.5 | 2.8 | 23,400 | 129.0 | — | 0.001 | 0.001 | Initial crack |
| — | — | — | — | 159.8 | 102.8 | 1,487 | 1,487 | Cyclic fail. | |
| I-33-3b | 26 (E) | 30.8 | 2.6 | 22,600 | 159.9 | 102.9 | 1,013 | 2,500 | Stopped |
| I-33-4 | 13 (S) | 46.6 | 3.2 | 29,400 | 161.8 | — | 0.001 | 0.001 | Initial crack |
| — | — | — | — | 177.8 | 102.3 | 442 | 442 | Cyclic fail. | |
| I-33-4b | 19 (E) | 44.2 | 3.4 | 28,000 | 177.9 | 102.4 | 129 | 571 | Cyclic fail. |
| I-67-1a | 28 (S) | 43.5 | 3.2 | 26,120 | 146.0 | — | 0.001 | 0.001 | Initial crack |
| — | — | — | — | 131.4 | 22.4 | 365 | 365 | No failure | |
| — | — | — | — | 146.7 | 37.7 | 2,835 | 3,200 | No failure | |
| — | — | — | — | 157.5 | 48.5 | 2,020 | 5,220 | Stopped | |
| 52 (E) | 45.1 | 3.3 | 27,300 | 463.0 | — | 0.001 | 5,220 | Residual | |
| I-67-2a | 32 (S) | 48.6 | 3.4 | 27,360 | 138.0 | — | 0.001 | 0.001 | Initial crack |
| — | — | — | — | 179.4 | 44.7 | 1,347 | 1,347 | Cyclic fail. | |
| I-67-2b | 50 (E) | 48.6 | 3.8 | 26,580 | 179.4 | 44.7 | 1,903 | 3,250 | Cyclic fail. |
| I-67-3a | 28 (S) | 44.1 | 3.4 | 25,100 | 138.0 | — | 0.001 | 0.001 | Initial crack |
| — | — | — | — | 179.4 | 71.6 | 5,450 | 5,450 | Stopped | |
| 57 (E) | 46.2 | 3.6 | 27,400 | 322.5 | — | 0.001 | 5,450 | Residual | |
| I-67-4a | 34 (S) | 38.1 | 3.3 | 23,770 | 131.0 | — | 0.001 | 0.001 | Initial crack |
| 59 (E) | 42.5 | 3.3 | 26,360 | 196.5 | 61.8 | 3,047 | 3,047 | Cyclic fail. | |
| I-67-5a | 42 (S) | 41.7 | 3.5 | 25,070 | 135.3 | — | 0.001 | 0.001 | Initial crack |
| 69 (E) | 40.2 | 3.1 | 25,820 | 202.9 | 95.1 | 4,165 | 4,165 | Cyclic fail. | |
| I-67-6a | 14 (S) | 39.7 | 3.2 | 24,680 | 135.6 | — | 0.001 | 0.001 | Initial crack |
| — | — | — | — | 203.4 | 41.8 | 500 | 500 | Cyclic fail. | |
| I-67-6b | 27 (E) | 43.6 | 3.4 | 28,120 | 203.4 | 41.8 | 759 | 1,259 | Cyclic fail. |
- Note: initial crack: initial shear cracks due to static preloading; no failure: no shear failure of beam; stopped: stop of cyclic load; cyclic fail: cyclic shear failure; residual: test of residual static shear strength; (S): test start; (E): test end.
3.2 Test setup and test procedure
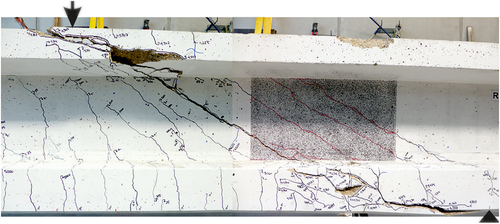
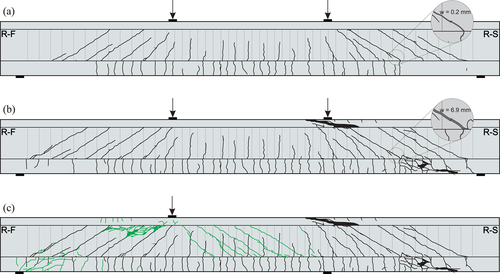
At the beginning of each test, the beams with a span of 6.5 m were loaded statically in a four-point bending test (Figure 2) until a first initial shear crack occurred on both sides in the shear span. This allowed for the investigation of the shear fatigue resistance of the truss model consisting of stirrups and concrete struts. Afterwards, the planned cyclic loading was applied until a cyclic shear failure in one shear span occurred or the cyclic loading was stopped after a large number of cycles (first part of cyclic test under four point bending, indicated by “a” in the beam numbering [Table 2]). Subsequently, the test setup was altered into a three-point loading (Figure 2) with a reduced span to continue the test on the less deteriorated, not yet failed span in order to generate a second shear failure in the beam (second part of cyclic test, indicated by “b” in the beam numbering). Since the shear slenderness and shear loads remained unchanged, the second part of the test represents the continuation of the first part of the test for the not yet failed side of the beam. The range of upper and lower shear force was varied during the cyclic loading for beams I-15-1 to I-15-3 and I-22-1 to I-22-3 in order to cause a fatigue failure throughout the test. In all other tests, the range between upper and lower shear force was kept constant. Except for test I-67-1, the lower shear force had to be increased during testing, since the first lower load was so small leading to an intolerant displacement in longitudinal direction of the beam. If a beam did not fail after a large number of cycles, the residual static shear capacity was determined or the test was stopped. The cyclic load combinations were defined based on EC 210, 11 and Frey. 33 The tested load combinations and the resisted cycles are summarized in Table 2. Vmax and Vmin indicate the upper and lower applied shear force, respectively. Only after fatigue failure of several stirrups in the shear span, the shear cracks propagated into the prestressed tensile flange at the support and the upper flange near the loading point, leading to final failure of the compression zone (Figure 4).
4 TEST RESULTS
Prior to the cyclic loading an initial static load was applied to create a shear crack pattern, which could occur at serviceability limit state. The cyclic loading led to an elongation and widening of the initial cracks as wells as the development of further shear cracks (Figure 5). Consequently, the stirrups in the web were activated to carry shear forces causing a gradual fatigue damage of the reinforcement. After failure of each stirrup the shear forces were redistributed to adjacent stirrups and/or a direct concrete compression strut. At the same time, the vertical deformation of the beam also increased. In the following, the behavior is described more detailed by test specimen I-67-2 as a typical example.
At the beginning of the cyclic loading, the deformation increased significantly because new cracks occurred, and existing cracks widened (Figure 6a). After some ten thousand load cycles, the deformation gradient decreased, and an internal equilibrium was found by activating a truss model consisting of stirrups and concrete struts. At this stage, the stirrups in the area of the cracks exhibited an almost constant stress range.
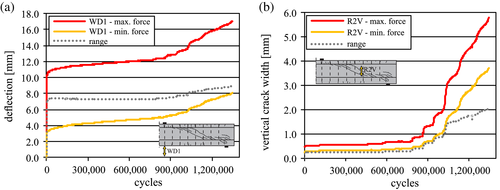
After about 900,000 load cycles, a distinctive increase of deflection and a disproportional increase of crack width was measured by inductive displacement transducer (WD1/R2V, Figure 6).
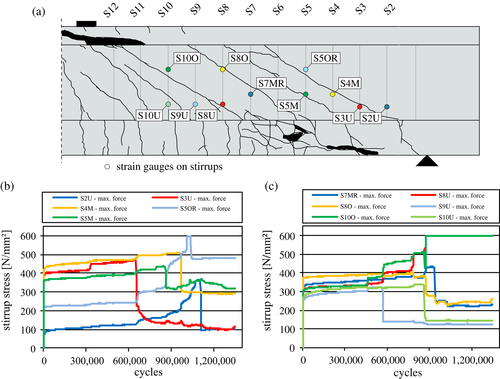
The increase can be explained in more detail by means of strain gauge measurements on the stirrups. With the stress–strain relation of the reinforcement the corresponding stirrup stresses were determined from the steel strains at upper and lower load. A pronounced yielding, as it is known from static tests, was not observed. Figure 7 shows the measured steel stresses of selected stirrups under upper load. At about 600,000 load cycles, a sudden decrease of steel stresses under upper load was observed for the measuring points S3U and S9U, which was induced by fatigue failure of stirrups S3 and S9 (lower area of stirrups 3 and 9, see Figure 7). At the same time, a small increase of the crack width in Figure 6b can be seen and the forces of the internal model were redistributed, so that the adjacent stirrups exhibit higher tensile stresses. At 900,000 cycles, three stirrups broke almost simultaneously (Figure 7: stirrups S5, S8, S10), explaining the abrupt increase of crack width and deformation. At the same time, the measured concrete compressive strains above the crack increased, which indicates a rearrangement of the truss model into a direct compression strut from load introduction to support.
This chain reaction proceeded faster with increasing fatigue fractures in test progression. Consequently, the crack widths and vertical deformations increased significantly until the end of the test. At about 1.35 million cycles, the governing shear crack had clearly grown into both, the upper and lower flange in the shear span at the right-hand side of the beams (Figures 4 and 5b) and the first part of the test was stopped. Then the second part of the test was continued with the shear span of the left-hand side of the beam as a three-point bending test with a span of 4.0 m. The shear span with fatigue failure was positioned beyond the shifted support and acted as a cantilever (Figure 5c). For the second part of the test, the same cyclic shear forces and the same a/d ratio (shear slenderness) were applied until failure after in total 3.25 million load cycles.
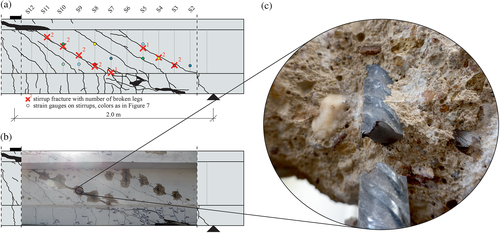
After the second part of test, the concrete of the webs was removed at the intersection of the cracks and the stirrup reinforcement in order to check the stirrups for fractures visually. In Figure 8a, the position where stirrup fractures were detected are marked by “x.” The corresponding number indicates whether one or both legs of the closed stirrups were broken. In the shear span shown here, almost all stirrups were broken at both legs. Figure 8b shows the test beam after removing the concrete at the intersection of stirrups and shear crack and Figure 8c a typical fatigue failure of a stirrup leg. It is visible that the stirrups failed by cyclic loading as they show no necking, indicating a static rupture.
The behavior exemplarily described for beam I-67-2 was typical for all test beams. After the concrete tensile strength had been degraded by the cyclic loading, existing cracks widened and elongated as well as new cracks developed. Due to shear cracking the stirrups exhibit cyclic stress ranges. Once the fatigue strength of the reinforcing steel was reached, a fatigue failure of a stirrup leg occurred, which led to a redistribution of the shear forces within the shear span. Adjacent stirrups obtained higher stress levels and stress ranges, which either accelerated their fatigue failure or caused a rupture by exceeding the residual tensile strength. Because of the shear crack pattern, which developed successively and randomly, the stirrups did not exhibit the same stress range and same stress level over the whole test period despite the applied constant shear loads. The stress ranges of the stirrups increased stepwise with each failure of a stirrup leg. After reaching pronounced shear cracks and several stirrup ruptures the original truss model changed to a direct compression strut system between load application and support.
In Figure 9, the resisted load cycles of all tests with a constant cyclic loading are summarized considering shear reinforcement ratio (0.22%; 0.33%; 0.67%), stress range of stirrups (200 N/mm2, 250 N/mm2, 300 N/mm2) and the upper shear force related to the shear cracking force. The stress ranges were calculated according to Equation (4) assuming a strut inclination of θfat according to Equation (3). In general, the stirrups failed earlier with increasing stress range, as expected.
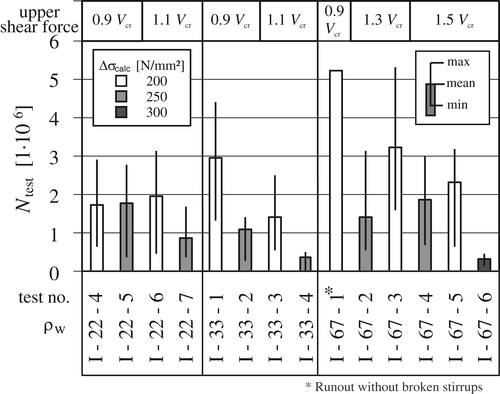
The load cycles listed in Table 2 and the maximum values in Figure 9 represent the point of final shear fatigue failure of the beam after several stirrups had failed already in advance. Based on the evaluation of the measured stirrup legs, the resisted number of load cycles of each stirrup and its strain during the test can be determined in more detail. The boxplot in Figure 9 shows the range between minimum and maximum number of load cycles until failure of a single stirrup leg (thin line) and the mean value of all stirrup leg failures (box). The top line in the diagram indicates that the upper shear forces during cyclic testing varied between 90% and 150% of the shear cracking load Vcr calculated based on principle tensile stress and concrete tensile strength. In test I-67-2 with a calculated stress range of 250 N/mm2 the first fatigue failure of stirrup occurred after 570,000 load cycles, the last one after 3,116,000 loads leading to the final shear fatigue failure of the beam. The mean resisted load cycles of all stirrups was 1,415,304 cycles. In total 16 of 26 stirrups had to fail over a period of 3.25 million load cycles, before the final shear failure of the shear span occurred. In other words, the loss of some stirrups does not cause the failure of a prestressed beam. Development of crack pattern and growth of crack widths announces the final failure in acceptable way. In test I-67-1 with a pronounced shear crack pattern under static preloading, the first stirrup did not fail even after more than five million load cycles. For this reason, the test was stopped and the number of load cycles at that time was used for the mean value Ntest.
5 COMPARISON WITH EXISTING APPROACHES
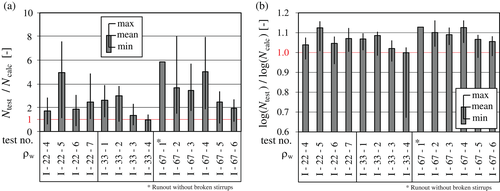
To check the accuracy of the current approach of Eurocode 2 (EC 2)8-11 for shear fatigue of beams with stirrups the measured number of cycles until failure of the stirrups Ntest was compared with the calculated number of cycles until failure Ncalc (Figure 10). Ncalc was determined on the one hand for an S-N curve specified in EC 29 (ΔσRsk = 175 N/mm2; N* = 106; k1 = 5; k2 = 9) and on the other hand for an S-N curve according to Maurer et al. 34 (ΔσRsk = 195 N/mm2; N* = 106; k1 = 4.1; k2 = 7.2), which was derived for reinforcing steel embedded in concrete.
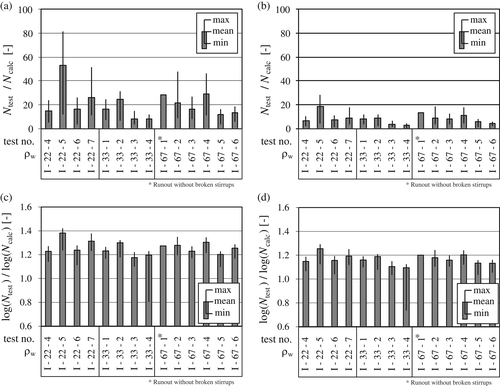
The calculation based on the S-N-curve according to Eurocode 2 clearly underestimates the resisted cycles of the tested stirrups (Figure 10a). The mean value of experimental load cycles was at least 10 times higher than the calculated number of cycles, in some tests up to almost 50 times. The ratio of test I-67-1 is estimated conservatively, based on the number of cycles when the test was stopped without fatigue failure of any stirrup. The application of the S-N curve according to Reference 34 reveals a better agreement with ratios of Ntest/Ncalc varying between approximately 3 and 19 (Figure 10b). This difference is mainly caused by the overestimation of the calculated stress ranges applying the increased strut inclination for fatigue θfat according to Equation (3). Therefore, the tests were additionally evaluated using a method proposed in References 29, 35 with an improved approach to determine the strut angle under cyclic loading. The method is based on an evaluation of the determined number of cycles to failure for each measured leg of the shear reinforcement. The procedure is shown in Figure 11.
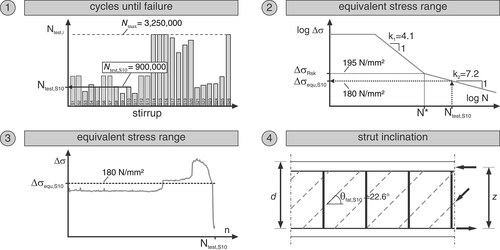
In step 1, the number of cycles to failure of each individual stirrup Ntest,i is determined (Chapter 4). Subsequently, the equivalent stress range Δσequ,i corresponding to a damage of 1.0 according to the Palmgren-Miner-Rule8 is calculated from the number of cycles to failure by applying an S-N curve (Step 2). Here, the S-N curve according to Reference 34 was applied, due to its better results in comparison (Figure 10). Accordingly, the variable stress range in the test is replaced by a constant stress (Step 3), leading to the same damage. Using Equation (5), derived from Equation (1), in step 4 the corresponding strut angles under cyclic loading θfat,test were determined utilizing the shear range ΔV from the test and the previously determined equivalent stress range Δσequ.
 ((5))
((5)) ((6))
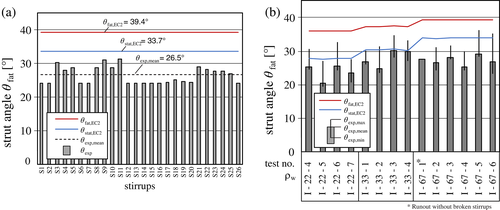
((6))Figure 12a shows the resulting strut angles in test I-67-2 for each stirrup. The strut inclination recalculated from the equivalent stress range of each stirrup leg varied between 24.2° and 31.2° with a mean value of 26.5°. The strut angle according to Equation (6)8 amounts to 39.4° and determines a too steep strut inclination, overestimating the stress range of the stirrups under fatigue loading.
 ((7))
((7))This assumption of Equation (7) results in a compression strut angle of 33.7° for beam I-67-2. The approach is on the safe side, as θstat,EC2 is slightly higher than the maximum compression strut angles from the test, which in turn result from the stirrup that failed first.
The same evaluation was performed for all beams tested with constant load levels and is summarized in Figure 12b. In addition to the mean value of the number of cycles reached before failure, the minimum and maximum values of all stirrups of each beam are also given. For all test beams the determined mean values are smaller than the corresponding strut angle θstat,EC2. Taking the maximum value of the strut inclination, it exceeds the static strut inclination according to Reference 8 for some tests. Accounting for the observed redistribution of shear forces this can be tolerated as the strut inclination describes the overall shear bearing capacity of the prestressed concrete member. Despite the first stirrup fractures, the beams were able to carry the applied shear loads. Furthermore, these test beams partially did not even fail due shear fatigue, so that the test was stopped (Table 2). As in test I-67-2, the approach of the static strut angle according to EC 2 is in good accordance with the test results.
The comparison of this approach with the recalculated strut angles of all I-beams tested with a constant cyclic shear force confirms this assumption. Therefore, this approach can be applied to prestressed concrete beams with shear reinforcement ratios up to ρw = 0.67%.
Finally, the resisted number of cycles Ntest are compared with the calculated number of cycles applying Equation (7), static strut angle according to EC 2 and the S-N curve according to Reference 34 (Figure 13). In comparison to Figure 10, the ratio of Ntest/Ncalc is much closer to one, which also shows that this approach is appropriate for prestressed concrete I-beams with values up to 0.67%.
6 SUMMARY AND OUTLOOK
- The cyclic loading led to a successive failure of the stirrup reinforcement with simultaneous redistribution of shear forces to adjacent stirrups, as well as a clearly visible increase in deformations and crack widths. Due to pronounced crack pattern and increase in deformation, there was a good indication of the following shear failure. With ongoing failure progress, a rearrangement of the truss model into a direct compression strut was observed.
- As a result of the successive failure of the stirrups, the stress in the adjacent stirrups increased gradually. This concerns stress ranges as well as stresses under upper load.
- The approach according to Eurocode 2 for determining the strut angle for fatigue overestimates the actual stress range of the stirrups measured in the test, and consequently underestimates the number of cycles until failure.
- Over the last years, the approach proposed in Reference 35 and implemented in the first amendment to the guideline for the recalculation of bridges in Germany15 was applied to existing structures with shear reinforcement ratio up to 0.35%. This allowed for a verification of the shear fatigue resistance or reduction of strengthening measures in many cases. Further information on the application to existing structures is given in previous publications (17, 36).
- The test on beams with higher shear reinforcement ratios confirm, that the proposal θstat = θfat is also reasonable for prestressed concrete I-beams with values up to 0.67%.
In order to extend this approach to higher shear reinforcement ratios, to beams with other cross-sections and with less or no prestressing more experimental and theoretical investigations are required.
ACKNOWLEDGMENTS
The presented studies were funded by the German Research Foundation (DFG, references HE 2637/12-1 and HE 2637/25-1) and the Hessian State Office for Road and Traffic Affairs (HLSV). The authors express their thanks to the DFG, the HSLV and the members of the project committee for the constructive discussions.
Biographies

Matthias Hillebrand,
RWTH Aachen University/Institute of Structural Concrete,
Aachen, Germany.
Email: [email protected]

Frederik Teworte,
H+P Ingenieure GmbH,
Aachen, Germany.
Email: [email protected]

Josef Hegger,
RWTH Aachen University/Institute of Structural Concrete,
Aachen, Germany.
Email: [email protected]
Open Research
DATA AVAILABILITY STATEMENT
The data that support the findings of this study are available from the corresponding author upon request.


