Longitudinal shear transmission of anchor channels into concrete—An experimental approach
Abstract
The paper presents an innovative method to determine anchor forces in anchor channels exposed to longitudinal shear loads. The channel's load-bearing behavior is experimentally investigated by fiber-optic techniques recording the longitudinal strains. For the first time these recordings uncover the inner flux of forces and enable to deduce the load distribution on the anchors. Before applying on anchor channels, the devices and components as well as its application are tested on a tension rod. Altogether 200 tests on anchor channels are performed varying the types of channel and anchor, the number of anchors, the closest distance of an anchor to the loaded edge and the position of load application. The tests confirmed that all available anchors (up to five were tested) transfer forces into the concrete member. Load distribution on the anchors is not uniform but depends on the type of anchor, the position of load application, the distance between the anchors and load application and the number of anchors available. By contrast, channel type and edge distance of the front anchor have little impact.
1 INTRODUCTION
Anchor channels are c-shaped steel profiles (see Figure 1a) with anchors on the rear that are used to transfer forces into concrete members. Attachments and other components can be installed to the profile in arbitrary positions.1 These days anchor channels usually serve to fix technical facility equipment, in façade construction and to connect structural components. Anchor channels are used since more than a century. Loads can be oriented perpendicularly (tension, local z-direction) or transversely to the anchor channel (transverse shear load, local y-direction). The load bearing behavior of anchor channels loaded in these directions was investigated by various researchers. Initial investigations to calculate the load-bearing capacity in case of concrete failure were carried out for tensile loads in Powell et al.2 and for transverse shear loads in Powell et al.3 While Wohlfahrt,4 Kraus,5 and Potthoff6 refined the basic approaches, Schmid7 contributed a model to consider the benefit of reinforcement which increases the load-bearing capacity. The interaction of tension and transverse shear loads was in the focus of Oluokon and Burdette8 and Wohlfahrt.4 Since serrated anchor channels with toothed lips and special toothed bolts have been put on the market, longitudinal shear loads (local x-direction) can be transferred by mechanical interlock, too. Figure 1b,c exemplifies a serrated anchor channel subjected to longitudinal shear loads in practical application.
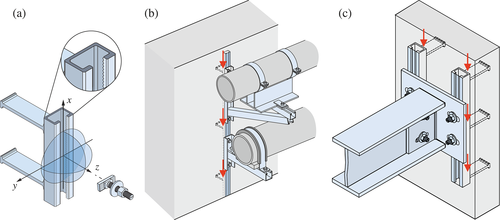
Longitudinally stressed anchor channels transmit forces to the concrete mainly by the anchors. While generally accepted load distribution models have been developed for tensile and transverse shear loads,5, 6 the distribution under longitudinal shear loads has rarely been investigated. Currently, due to a lack of knowledge only conservative assumptions exist that account for one9 or three anchors10 in load transfer for channels close to an edge.11 This yields conservative bearing capacities as in this case concrete failure starts from the anchor closest to the edge and determines the design. Initial contributions to the topic develop specific load distribution models based on simulation with finite elements.12, 13 However, until now no findings from experimental load tests are published that allow a determination of anchor forces from measurement data.
In this paper, an experimental method to investigate the load-bearing capacity of longitudinally stressed anchor channels in-situ with fiber optic sensors,14 from which the load distribution on the anchors can be deduced, is presented for the first time. For this purpose, an extensive test campaign on anchor channels embedded in concrete was set-up in which the types of anchor and channel, the number of anchors, the edge distance and load position varied. In total 200 physical experiments were conducted to evaluate the impact of these parameters. Longitudinal strains in the anchor channels were recorded from which the axial load distribution was obtained. The single anchor forces can be directly read from this curve.
2 EXPERIMENTAL INVESTIGATION METHOD
2.1 Indirect measurement of anchor forces
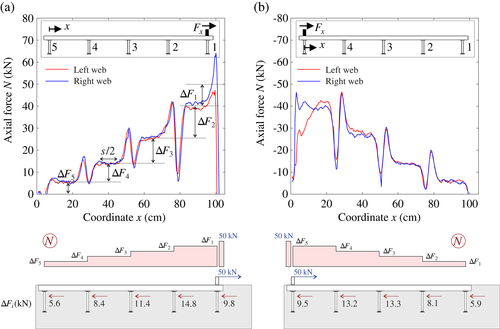
The anchor forces in the tests were measured indirectly, since direct measurement, for example, via pressure sensors on the anchors, would have had a considerable impact on the load-bearing behavior. At its core, the indirect measurement concept bases on the determination of the axial force distribution along the channel. Dependent on the applied load, the channel profile is in tension or compression. From the load levels along the channel it is possible to infer the forces that are introduced into the concrete by each anchor. The anchor forces are the differences between the load levels before and behind an anchor ΔFi (see Figure 2). If other mechanisms of load induction into the concrete are excluded (e.g., friction, adhesion), the sum of all anchor forces equals the induced force F.
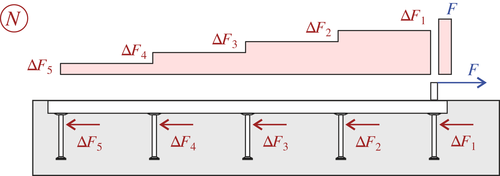
The challenge in terms of measurement technology was to reliably record the strains and to develop a concept with which the force distribution along the channel can be determined from these strains. It was necessary to consider that not only axial forces but also bending moments cause longitudinal strains in the anchor channel due to eccentric load application.15 When placing the sensors in the cross-section, it was decisive where evaluable results could be expected and which positions should therefore be used for the measurement.
To determine these regions, a linear-elastic finite element analysis was performed prior to the experimental investigations.16 Figure 3 shows the simulation results as longitudinal strains along the anchor channel. It can be observed that bending moments from eccentric load application occur especially in the region behind load application between the right and central anchor. Additionally, constant strain states between the anchors (anchor spacing s) along the neutral axis of the cross-section can be seen. These form centrally between the anchors over a length of s/2 and are limited by the regions near the anchors where load induction effects occur locally. In these central regions, principal stresses distribute primarily horizontal (longitudinal strains dominate) while at the anchors, inclined principal stresses are caused by load induction.17
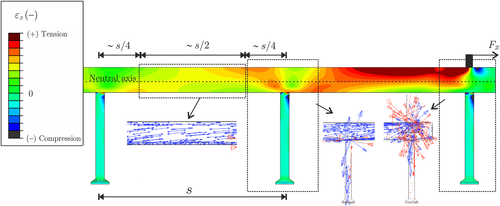
Based on these findings, it is useful to measure the longitudinal strains along the neutral axis to determine the axial force in the channel profile where no strains due to bending arise. The range of evaluation should be limited to the central region between the anchors to avoid an impact of load induction at the anchors.
2.2 Fiber-optic sensors for strain measurement
For the strain measurements a fiber-optic measuring system is chosen that enables quasi-continuous strain recordings along optical fibers glued onto test objects. However, for details on the functionality of fiber-optic measurement systems the corresponding literature is referred to Fischer et al.,18 Engelbrecht,19 and Peters and Inaudi.20 Dependent on the measuring mode the chosen system ODiSI-B21 employs specific measuring point distances, frequencies, accuracies and maximum sensor lengths. In the experiments the strains were recorded every 2.6 mm. When applying the optical fibers it must be kept in mind that strains are just recorded in the direction of the fiber (εx).
Based on the finite element simulation results, the optical fiber was applied at the center of gravity of the channel profile on both webs (left and right web). This redundancy allows a straightforward verification of the measurement result. From the recorded strains at the center of gravity (εc) the axial force in the cross-section follows from Equation (1) considering Young's modulus E and cross-section area A.
 ((1))
((1)) ((2))
((2))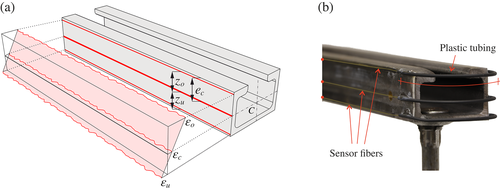
Since the measurements are principally performed along the whole optical fiber not only the previously defined evaluation windows but also the regions of load application at the anchors are covered (see Figure 3). However, the latter were excluded from the evaluation of load levels (see Figure 2).
2.3 Preliminary tests with fiber-optic sensors
Prior to the investigations on anchor channels, a tactile test was conducted on a stretched steel rod to check the general feasibility and to identify a suited combination of adhesive and fiber type for practical application of fiber-optic sensors (see Figure 5).23 Especially, the transmission of strains from the test member to the fiber is critical for reliable strain recordings. For this purpose, a polyimide-coated fiber (∅ = 155 μm)24 and a cyanoacrylate adhesive were combined.
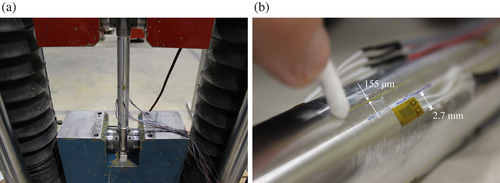
A CNC-machined steel rod with a precisely milled diameter was stretched into the test device. The strains were recorded with a fiber-optic sensor and a strain gauge for control. The simple test setup enables to predict the strains analytically using Hooke's law (ε = F/(EA)), too.
A single optical fiber was wrapped around the steel rod in four loops (1–2, 3–4, 5–6, 7–8), which are circumferentially shifted by 90° to one another (section A-A, Figure 6). Figure 6 compares the strain records of gauges and fiber to the expectation value on different load levels. Experimental results and analytical expectation match well. The discrete strains of the gauges denoted by DMS confirm the results obtained by the fiber-optic sensor. The detail on the right in Figure 6 shows the variance (±45 μm/m) around the analytical mean (842 μm/m) along the fiber-optic sensor on the final load level of 180 kN. The variance correlates to the sum of precision stated by the manufacturer (±25 μm/m) and the repeatability of results due to measurement noise (±20 μm/m).21
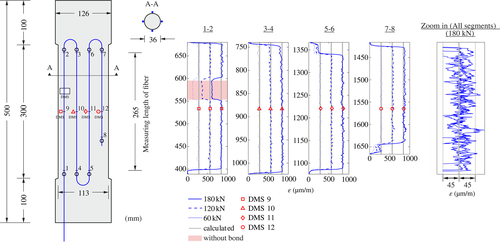
The results of the tactile test confirm that the fiber-optic measuring system is suited to measure the strains on a specimen made of steel. The method is therefore expected to provide reliable results for the investigation of the more complex anchor channels. The combination of fiber and adhesive works well on steel specimen.
3 EXPERIMENTAL PROGRAM
A comprehensive test program (see Table 2) was conducted to investigate the load-bearing behavior of anchor channels exposed to longitudinal shear loads and the load distribution on the anchors. It covers several parameters and varies the number of anchors, the edge distance, the anchor channel and type of anchor. All tests were performed in the linear elastic range of the concrete to allow several tests per anchor channel. Different load positions were tested, with the load inducing bolt placed above each anchor and at midspan.
3.1 Materials
The anchor channels differ in the size of the profile (see Table 1) and the type of anchor (see Table 2). All relevant dimensions of the anchor channels are defined in Figure 7.
| Id. | bch | hch | b1 | tw | tf | ht | d1 | d2 | wa | hef |
|---|---|---|---|---|---|---|---|---|---|---|
| 29/20 | 29 | 20 | 14 | 2.5 | 2.5 | 5 | 8 | 16 | — | 82 |
| 38/23 | 38 | 23 | 18 | 3 | 3.5 | 5.5 | 10 | 21 | — | 96 |
| 53/34 | 53 | 34 | 22.5 | 4 | 4 | 7.5 | 12 | 25 | — | 155 |
| 64/44 | 64 | 44 | 26 | 5 | 4.5 | 10 | 7.1 | 20 | 35 | 178 |
| Config. | Channel type b/h | Number of anchors | Anchor type | Anchor spacing s | Length b | Height h | Edge distances c1 (number of tests) |
|---|---|---|---|---|---|---|---|
| (–) | (mm) | (mm) | (mm) | (mm) | |||
| A | 29/20 | 4 | Round | 200 | 850 | 120 | 50 (7), 100 (7), |
| 150 (7), 200 (7) | |||||||
| B | 38/23 | 4 | Round | 183 | 800 | 150 | 50 (6), 100 (7), |
| 150 (7), 200 (7) | |||||||
| C1 | 53/34 | 2 | Round | 250 | 500 | 200 | 50 (1), 100 (2), |
| 150 (3), 200 (3) | |||||||
| C2 | 53/34 | 3 | Round | 250 | 750 | 200 | 50 (5), 100 (5), |
| 150 (5), 200 (5) | |||||||
| C3 | 53/34 | 4 | Round | 250 | 1,050 | 200 | 100 (7), 200 (7) |
| C4 | 53/34 | 5 | Round | 250 | 1,250 | 200 | 50 (26), 100 (9), |
| 150 (9), 200 (26) | |||||||
| D1 | 64/44 | 4 | I-shaped | 250 | 1,050 | 250 | 100 (7), 200 (7) |
| D2 | 64/44 | 5 | I-shaped | 250 | 1,250 | 250 | 50 (9), 150 (9) |

The maximum grain size of the concrete is 16 mm. Cement type CEM III/A 32.5 N and a water to cement ratio of 0.6 is employed for the mixture. Concrete's compressive strength at the time of testing was determined to 28 N/mm2.
3.2 Test specimen design and preparation
The design of the test specimens was motivated by the idea to realize two configurations (edge distance c1 and  ) with one specimen (see Figure 8a). This yields different distances of the anchors to the edge on both ends. The sum of the two edge distances and a multiple of the anchor spacing defines the specimen length (see Table 2). The width (a)of the specimens was fixed to 800 mm to ensure sufficient space between the horizontal supports at the corners of the specimen and the anchor closest to the edge (see detail in Figure 9). This distance is necessary not to restrict a concrete breakout initiated at the first anchor in case of concrete failure and to prohibit the anchor from direct support (concrete strut). The height of the specimen varied with respect to the required anchoring depth of the profile.
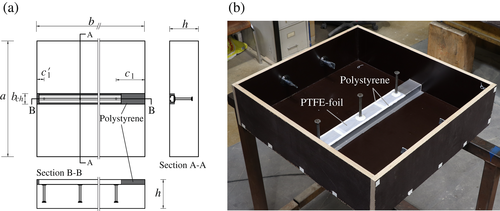
The anchor channels were fixed with nails in the formwork before concreting. An alternative fixing by means of silicone proved to be unsuitable in the tactile tests, as the adhesive to glue the fibers came off the steel surface in case of contact with the silicone. To protect the fibers and to avoid friction and adhesion, the anchor channels were wrapped in polytetrafluorethylene (PTFE) foil (see Figure 8b).25, 26 To restrict load induction to the anchors, additional polystyrene strips were attached in front of the profile. Further strips were provided on the outer sides of both webs.
3.3 Loading and measurement
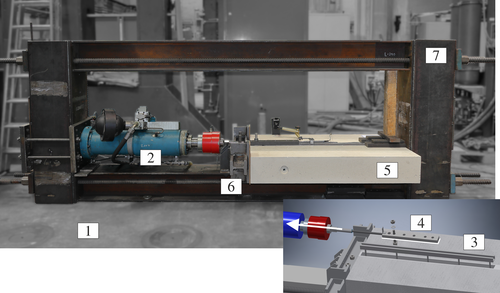
Testing was performed in a steel test frame (see Figure 9), in which the specimens were fitted and loaded by a horizontally mounted servo-hydraulic cylinder. Both the horizontal support at the front of the concrete specimen and the vertical clamping was directly against the frame, which absorbed the forces introduced to the system and thus formed a self-contained system. The load was applied to the profile by use of a mounting plate and a toothed bolt, which was inserted into the serrated anchor channel at fixed positions and stressed. To minimize friction, a PTFE foil was placed between the steel plate (see #4 in Figure 9) and the anchor channel or concrete surface, respectively.27
Loading was applied force-controlled, while the maximum load was limited to the shearing force of the toothing of each profile (see Figure 10). The specified load-levels were all below this failure load and ensured no plastic deformation in the steel components and no cracks in the concrete. As the applied loading is relatively short in duration, no creeping effects of the concrete are to be expected for subsequent tests.28
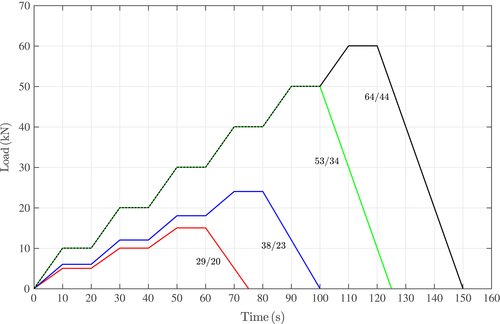
In addition to the fiber-optic strains along the profile, the force of the cylinder, the cylinder path and indirectly the horizontal displacement of the bolt were recorded during the test. For the latter, a displacement transducer controlled the horizontal displacement of the mounting plate relative to the concrete surface. Since the bolt was fixed to the mounting plate no relative displacement between these two components has to be expected.
4 RESULTS AND DISCUSSION
The results for anchor channels subjected to longitudinal shear load are exemplified on configuration C4, which is representative for all other configurations. In Figure 11 the distribution of the axial force N along the profile is displayed. The forces therein are computed from the strains in both webs as explained before. Clearly the load levels and differences (ΔFi) between them can be identified from which the forces at the anchors are derived. Figure 11a shows an anchor channel which is loaded at position 1 and thus completely stressed in tension. However, when loaded in position 5 (see Figure 11b), the profile is completely under compression. In both cases, the stepped course of the axial force is qualitatively comparable. Obviously all anchors are involved in the load transfer from the profile to the concrete albeit not to the same extent.
The experimental results are summarized in Figure 12 for the maximum load level according to Figure 10. Visualization is separate for all configurations of Table 2. In the diagrams, the course of the relative anchor force is plotted as the ratio of force F to maximum force Fmax. The anchor forces vary between 4% and 65% of Fmax.
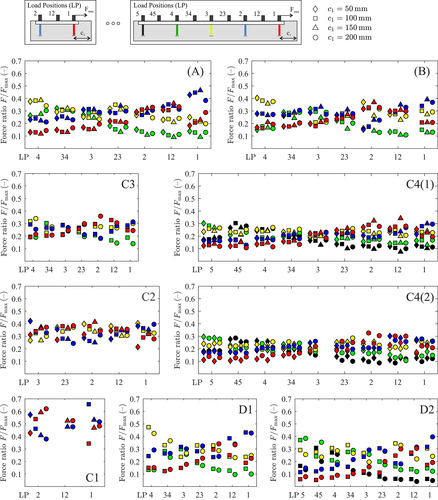
The test results are grouped along the x-axis according to the tested load position. Within these groups, tests with different edge distances are displayed adjacent to each other. Specific markers are assigned to the different edge distances as defined at the top of the figure. All symbols in a vertical line represent the anchor force ratios of a single test. Their quantity depends on the number of anchors (2–5) in the specific configuration. In tests where two or more anchors have (almost) the same force ratios their symbols may overlap. Coded colors are assigned to the different anchor positions as illustrated at the top of the figure.
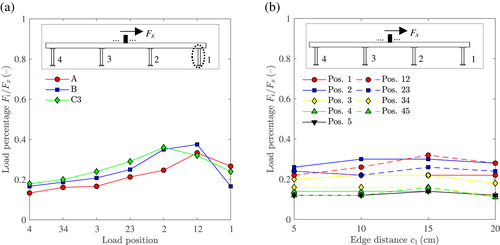
Following a specific color along the horizontal axis shows the influence of the load position (LP) on relative anchor forces. It can be seen that the maximum relative force in an anchor does not occur if the load is directly applied above. In general, the anchor force decreases with increasing distance from load application with the exception of the anchor directly below load application. The latter is not the most heavily loaded anchor, since it avoids the stress caused by eccentric load application. This trend can be seen for all configurations in Figure 12. The detail in Figure 13a highlights this trend for three representative tests (A, B and C3) with four anchors. It can be seen that the stress on anchor 1 is greatest when the bolt is placed between anchor 1 and 2 or above anchor 2.
A comparison of the test configurations with different numbers of anchors (C1 to C4 according to Table 2) shows that the relative anchor force decreases steadily if more anchors are involved. Since the total force (Fmax) is distributed on more anchors, the variance of the anchor forces decreases simultaneously. Moreover, the load portions on the maximum and minimum loaded anchors are reduced.
The anchor type has a significant influence on the load distribution, too (see Figure 12). With the same number of anchors, the results of I-shaped anchors in configurations D1 and D2 differ significantly from those of round anchors (configuration A, B and C3 with 4 anchors, C4 with 5 anchors). Although the channel type differs in these configurations, too, its impact is not as strong as that of the anchor type. This is concluded from comparison of the results related to A, B and C3 with 4 anchors and different channel types that show no differences. Since I-shaped anchors are welded to the profile, their connection is much stiffer than with round anchors, which are riveted to the profile. Another aspect that results in a higher stiffness is given by the surface area of the anchor, which is pressed against the concrete.29 The I-shaped anchors' surface is about two to three times bigger compared to round anchors, that might be used as an alternative. Thus, the much stiffer clamping to the concrete increases the load portions of anchors close to load application. More distant I-shaped anchors in configuration D2 receive much smaller load portions of less than 5% as configurations with round anchors (C4). There, even the least heavily loaded anchors receive bigger load portions. Thus, the results in configuration D2 also show higher scatter than in C4.
By contrast, the edge distance has no decisive influence on the load distribution. Figure 13b exemplifies on configuration C4 and load position 1 that the load portion hardly alters for different edge distances. With view on Figure 12 this can be confirmed for the other configurations, too. The edge distance has no influence on the load distribution because it does not affect the shear stiffness of the anchor. This was also shown by Grosser and Tian.29-31
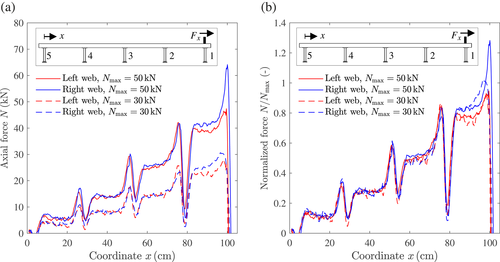
All observations and conclusions of these investigations apply only to concrete and anchor channels in the linear elastic domain. To double-check whether the results evaluated on the maximum load level also apply to lower load levels, Figure 14 contrasts the results on two load levels (30 kN and 50 kN) exemplarily on configuration C4. Already for the absolute forces the courses in Figure 14a qualitatively match well. If the results are normalized as shown in Figure 14b the agreement gets even stronger. Here the absolute forces are related to the maximum force Nmax. That means, the load distribution in the elastic range is proportional to the load level, as expected.
5 CONCLUSIONS
For the first time, the fiber-optic measurement technology enabled to investigate the load bearing behavior of anchor channels subjected to longitudinal shear and to assess the load distribution on the available anchors in-situ. It could be demonstrated that all anchors contribute to the load transfer from the profile to the concrete, which disproves the most recent load distribution models published in CEN9 and ICC-ES.10
Future load distribution models should consider the verified impact factors—bolt position, number of anchors and anchor type. The investigations confirm that up to five anchors contribute to the load transfer from the profile to the concrete. A trend that rests on investigations of anchor channels with two to five anchors suggests that further anchors would also contribute to the load transfer although more distant anchors would contribute less. However, no significant impact on the load portions on the anchors can be attributed to the distance of the anchor closest to the loaded edge.
It must be considered that these results are valid and proportional for the linear elastic domain of concrete only. They reflect the load distribution on the anchors that induces first cracks into the concrete and initiates concrete failure. It is expected, that stiffness alteration due to cracking at the anchor closest to the edge will redistribute loads to more distant anchors.32, 33 The extent to which cracks open and initiate concrete breakout at the edge, when the anchor closest to this edge is relieved, is decisive when judging the serviceability of the connection. In this context, the question arises if the usability of the connection is already impaired before the maximum bearing capacity is reached considering load redistribution. This question remains open so far.
ACKNOWLEDGMENTS
The authors would like to thank the whole team of the structural testing laboratory KIBKON at Ruhr University Bochum for their support in experimental testing.
Biographies

Dustin Konertz,
Institute of Concrete Structures,
Ruhr University Bochum,
Bochum, Germany.
Email: [email protected]

Georg Karl Kocur,
HALFEN GmbH, Research – Development – Engineering,
Anchoring Systems,
Langenfeld, Germany.
Email: [email protected]

Frank Häusler,
HALFEN GmbH, Research – Development – Engineering,
Anchoring Systems,
Langenfeld, Germany.
Email: [email protected]

Peter Mark,
Institute of Concrete Structures,
Ruhr University Bochum,
Bochum, Germany.
Email: [email protected]


