A 3D Opened Hollow Photothermal Evaporator for Highly Efficient Solar Steam Generation
Abstract
Herein, using hierarchical porous CuS–cellulose composite as photothermal materials, a 3D opened hollow photothermal evaporator is designed and fabricated to target high solar evaporation rates. Such a unique structure not only imparts the solar evaporator with an efficient water evaporation by minimizing energy loss, introducing cold evaporation surfaces for drawing additional energy from the bulk water and surrounding air, but also fully activates evaporation on both inner and outer evaporation surfaces, thus delivering superior evaporation rates compared to the enclosed evaporators. Moreover, under convective flow, this special structure effectively promotes the escape of vapor inside the evaporator to avoid the vapor accumulation, further enhancing the evaporation on inner evaporation surfaces, thus improving the evaporation rate up to11.911 kg m−2 h−1 under a convective flow rate of 4.0 m s−1 and 1.0 sun irradiation. The operability of the as-prepared solar evaporator under natural environmental conditions is examined by outdoor evaporation tests. The obtained solar evaporator is demonstrated to be applicable for generating clean water from model seawater and dye wastewater. An impetus for promoting practical application of solar steam generation in seawater desalination and wastewater purification is provided.
1 Introduction
As population growth, industrialization, and climate change exacerbate global water scarcity, how to solve this intractable issue becomes a hot topic around the world.[1, 2] In fact, there is a large reserve of undrinkable water resources on the earth, such as seawater and wastewater, which can be purified to circumvent the freshwater shortages via the dominant membrane-based separation technologies. However, these technologies have unignorable environmental impacts originated from the high energy consumption, membrane cleaning, and system maintenance.[3, 4] Alternatively, interfacial solar-driven steam generation is emerging as a promising and environmentally benign way to produce clean water since this strategy has the advantages of high energy efficiency, sustainability, and low cost, thereby attracting extensive research interests.[5-9] Compared to traditional solar evaporation which runs in a bulk water heating pathway, interfacial solar steam generation has much higher energy efficiencies.[10-17] In an interfacial solar evaporation system, photothermal materials generally float at water–air interfaces, where the heat converted from incident sunlight is localized and concentrated for steam generation, thus delivering extremely high evaporation rates.[18-20]
Generally, the performance of interfacial solar evaporation system is closely related to two key elements, that is, photothermal materials and evaporator configuration.[21-23] While photothermal materials determine the light absorption and solar-to-heat conversion, the structure of solar evaporator mainly affects the energy nexus and efficiency. To date, various photothermal materials have been synthesized and successfully applied in solar steam generation, such as plasmonic metals,[24-27] semiconductors,[19, 28, 29] polymers,[30-32] and carbon-based materials.[33-36] Many of them have exhibited excellent light absorption ability (>95%) across the solar spectrum. Therefore, developing photothermal materials itself has reached a bottleneck for further improving the performance of solar evaporator because it has a little room to further enhance light absorption.
Recent research has pointed to an alternative and effective strategy to significantly improve the evaporation rate, that is, optimization of the structure of solar evaporator for enhanced energy input.[37-39] Particularly, the shift from 2D to 3D structured solar evaporators not only increases the overall evaporation surface area at the same footprint, but also extends the energy input channels. For instance, a cylinder-like 3D photothermal evaporator composed of solar evaporation surface (SES) and cold evaporation surface (CES) can simultaneously harvest sunlight and additional energy from surrounding environment due to the lower surface temperatures on the CESs induced by cooling effect of nature evaporation (i.e., dark evaporation).[40, 41] By rational design of the 3D structures, the evaporator can also lower the radiation and convection energy loss on SES, extract energy from bulk water, and recycle latent heat released from vapor condensation to significantly enhance the solar evaporation.[42, 43] Therefore, it is imperative to develop innovative 3D photothermal evaporator for further advancing its high evaporation performance.
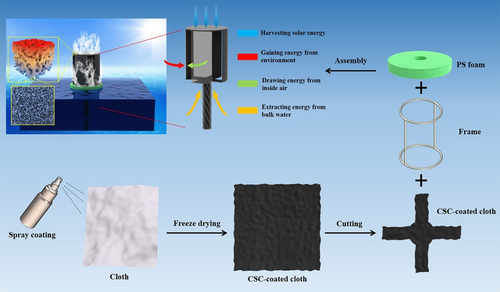
Herein, a 3D opened hollow cylinder-like solar evaporator (OHCE) was constructed using hierarchically porous CuS–cellulose composite (CSC) as light absorber. Although various CuS nanostructures have been prepared and utilized as photothermal materials for solar evaporation,[44-48] porous structured CuS has not been explored for fabricating 3D photothermal evaporators. The CSC-coated sheet (Figure S1, Supporting Information) was tailored and wrapped on a steel frame to fabricate an OHCE with four slots on its side evaporation surfaces (Figure 1). During solar evaporation, the top surface is exposed to solar light and implements solar evaporation, while the side surfaces without light illumination perform dark evaporation and harvest extra energy from the surrounding air to contribute to the overall evaporation. More importantly, hollowed structure allows water evaporation on both outer and inner sides of the evaporation surfaces, while the opened slots on the side evaporation surfaces facilitate the escape of water vapor inside the hollowed evaporator, rendering higher evaporation rates compared to the enclosed hollow evaporator. In addition, this OHCE can take advantage of convective flow to fully activate the water evaporation on the inner surfaces to dramatically boost the evaporation rate to 11.911 kg m−2 h−1 under 1.0 sun and a convective flow rate of 4.0 m s−1, which is very promising for practical water evaporation.
2 Results and Discussion
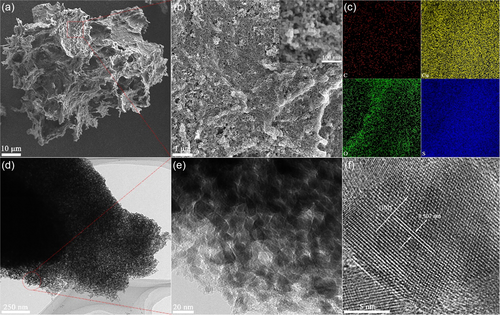
CSC was synthesized and utilized as photothermal material for the OHCEs. The composition of the as-synthesized CSC was determined by X-Ray diffraction (XRD) pattern (Figure S2, Supporting Information), which presented characteristic diffraction peaks corresponding to hexagonal CuS (JCPDS 06-0464). Two additional diffraction peaks at 14.8° and 22.6° could be assigned to the typical cellulose I structure, confirming the coexistence of CuS and cellulose in the obtained composite.[49] The 2,2,6,6-tetramethylpiperidine-1-oxyl radical (TEMPO)-oxidation-derived cellulose nanofibrils have abundant surface hydroxyl and carboxyl groups which could form strong complexation with Cu2+ ions,[50, 51] thus inducing the gelation of cellulose suspension. The following release of S2− ions by thermal decomposition of thioacetamide enabled the in situ growth of CuS nanoparticles on intertangled cellulose nanofibrils patches. As anticipated, the obtained CSC was in the form of patches as displayed in a scanning electron microscopy (SEM) image (Figure 2a). Large pores were observed in these CSC patches. The cellulose acted as the skeleton to support the macroporous matrix of CSC. The magnified SEM image (Figure 2b) of the framework of a single CSC patch showed that many ultrasmall CuS nanoparticles with an average size of 17.6 ± 3.3 nm (the inset in Figure 2b) were densely stacked on the framework. The formation of these small particles can be ascribed to the inhibited crystal growth by the confined effect of the cellulose matrix where nucleation and growth of CuS took place. The elemental mapping of the CSC demonstrated the presence of C, O, Cu, and S across the entire scanned area (Figure 2c), indicating a relatively even distribution of CuS on the cellulose substrates. Transmission electron microscopy (TEM) image with a low magnification (Figure 2d) showed that the framework of the CSC was porously textured. Such a porous-like structure with a pore size of 19.4 ± 7.7 nm was attributed to the voids between CuS nanoparticles grown on the cellulose matrix (the inset in Figure 2b,e). The macropores in the patch and the microporous voids between CuS nanoparticles in the wall resulted in the hierarchical porous structure in the CSC patch. High-resolution TEM (HRTEM) image (Figure 2f) of one CuS nanocrystal showed a clear lattice fringe of 0.307 nm corresponding to the (102) plane of CuS, indicating its good crystallinity. Further high-angle annular dark-field scanning TEM (HAADF–STEM) imaging and the corresponding elemental mapping analysis of the small microporous structure showed a clear distribution of Cu and S, while the signals of C and O were much weaker due to low content of cellulose (Figure S3, Supporting Information). The hierarchical porous structure of CSC patch could enhance the light absorption via the multiple reflections of the light within the pores,[52-54] while the small CuS nanoparticles and their uniform distribution on cellulose matrix could benefit the exposure of photothermal CuS to sunlight irradiation, thus enhancing the solar-to-heat conversion. This structured–enhanced light absorption and photothermal effect were further demonstrated by the faster temperature rise of CSC compared to that of the pure CuS powders synthesized without cellulose under 1.0 sun irradiation (Figure S4, Supporting Information).
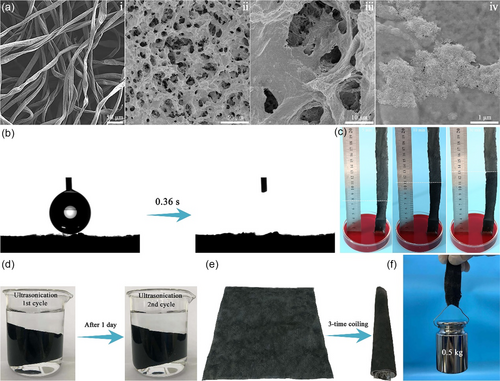
The synthesized CSC was coated on a piece of cloth to form the photothermal sheet. The pristine cloth is composed of randomly arranged yarns that are formed by bundling fine fibers together (Figure 3ai). The interspace between fibers in yarns could promote water absorption by capillary effect. After deposition of CSC by using agarose as the binder, the cloth was completely covered by porous CSC–agarose composite (Figure 3aii). Large pores were clearly displayed in the magnified SEM image (Figure 3aiii), where a patch of small CuS nanoparticles could be observed on the wall of the pores (Figure 3aiv). Such a porous structure benefits both water transportation and vapor escape. A water droplet (3 μL) could be adsorbed by CSC-coated cloth within only 0.36 s (Figure 3b), suggesting its excellent hydrophilicity and water absorption ability. The vertical water wetting height was measured by inserting a stripe of CSC-coated cloth into 0.01 m methyl orange (MO) solution (Figure 3c). A water wetting height of 6.5 cm was achieved after 5 min, and the height was increased to 10 cm after 10 min and finally reached 12.0 cm after 30 min. The binding strength of CSC on cloth was tested by immersing a piece of CSC-coated cloth in water for two cycles of 5 min ultrasonication (120 W, 40 kHz), where the water phase was kept transparent and no detachment of black CSC was observed (Figure 3d), indicating the firm attachment of CSC on the surface of cloth. Furthermore, after 20 cycles of drying–wetting–drying treatment (Figure S5a, Supporting Information) and 15 cycles of scratching (Figure S5b, Supporting Information), no CSC was peeled off the surfaces of the cloth. In addition, the CSC-coated cloth was kept unchanged after immersing in the model seawater (SW) for 8 h (Figure S6a, Supporting Information). The CSC was still densely attached on the surfaces of cloth (Figure S6b,c, Supporting Information). The flexibility of cloth was retained after deposition of CSC as the CSC-coated cloth could be easily coiled by 3 times (Figure 3e). Furthermore, the obtained CSC-coated cloth could withstand a pulling strength of 0.5 kg weight (Figure 3f), implying its robust mechanical property.
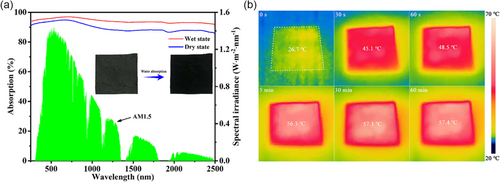
The light harvesting ability of CSC-coated cloth was examined using ultraviolet–visible–infrared (UV–Vis–IR) spectrophotometer. The double-layered CSC-coated cloth in the dry state exhibited a high light absorption (αdry) of 92.4% in the range of 250–2500 nm (Figure 4a). Once being wetted by water, the light absorption of CSC-deposited cloth was enhanced across the whole range, and the overall optical absorption efficiency (αwet) was further increased to 95.6%, indicating a strong light absorption ability at wet state, which aligns well with actual state during solar steam generation. This special dry-to-wet light absorption transition property of CSC-deposited cloth was accompanied by its detectable color change from blackish green in the dry state to dark black in the wet state (the inset in Figure 4a). The light absorption enhancement of the wet sample can be ascribed to the suppressed light reflection at wet state as water has an intermediate refractive index of 1.33 between those of air (1.00) and CSC (≈1.46).[55] The photothermal property of the CSC-coated cloth was further assessed by monitoring temperature change of the sample under 1.0 sun illumination in the air (Figure 4b). The surface temperature of the CSC-deposited cloth rapidly increased from initial 26.7 to 45.1 °C within only 30 s, and further increased to 48.5 and 56.3 °C after 60 s and 5 min, respectively. Then, the surface temperature reached the steady state at ≈57.3 °C after 30 min. Such a rapid increase in surface temperature within the initial 30 s and high steady temperature indicate an excellent photothermal conversion ability of the CSC-deposited cloth.
The double-layered CSC-deposited cloth was tailored and assembled to build the 3D OHCE with a height of 9 cm and a round top surface of a diameter 4.2 cm for solar steam generation under 1.0 sun irradiation (Figure 1). The slot width on side evaporation surface was set as 0.30, 1.28, 2.19 cm, corresponding to total side evaporation surface area of 108, 72, 36 cm2, named as OHCE-3, OHCE-2, OHCE-1, respectively. The mass change of water (i.e., evaporated water) with time was recorded to evaluate the performance of solar evaporators (Figure 5a–c). For OHCE-3, an evaporation rate of 3.938 kg m−2 h−1 was achieved. Less water was evaporated when the slot width on side surface was increased to 1.28 cm (OHCE-2) and 2.19 cm (OHCE-1) (i.e., side evaporation surface area gradually decreased to 72 and 36 cm2), with evaporation rates of 3.461 and 3.024 kg m−2 h−1, respectively. Surprisingly, an enclosed hollow cylinder-like evaporator (EHCE) with the largest side evaporation surface (118.75 cm2) showed the lowest evaporation rate of 2.911 kg m−2 h−1, much lower than that of OHCE-3 (3.938 kg m−2 h−1). This was because the opened slots activated the water evaporation on inner-side evaporation surfaces. Although the enclosed hollow structure had the largest side evaporation surfaces, only outer-side evaporation surfaces worked during solar evaporation, while the inner-side evaporation surface was not active due to the saturated vapor and high humidity inside the enclosed hollow evaporator. When there are slots on the side evaporation surfaces, the accumulated vapor inside the OHCE could escape to lower the humidity inside. Therefore, the water evaporation on the inner-side evaporation surface of OHCE-3 was activated, realizing higher evaporation rate with less evaporation surface area.
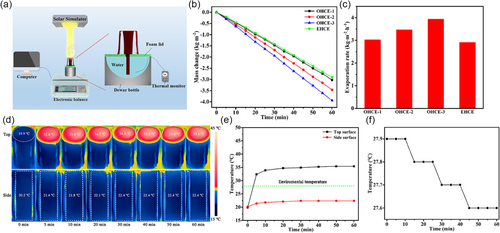
Thus, the total energy input (Etotal) for OHCE-3 was 2.75 W, which is much greater than the sole incident solar energy of 1.39 W.
For the open-structured OHCE-3, there is still a room to further improve its energy conversion efficiency (η) if the energy loss on the top evaporation surfaces can be fully eliminated during solar evaporation. An effective pathway to realize this is to lower the surface temperature below the environmental temperature during solar evaporation. Thus, a series of lower light intensities (0.4, 0.6, and 0.8 sun) were used to illuminate the top surface of OHCE-3. As anticipated, the evaporator showed a lower steady average temperature of 32.1 °C on its top surface under 0.8 sun (Figure S11a,b, Supporting Information). The outer- and inner-side surfaces also had lower steady temperatures of 22.2 °C (environment 28.0 °C, Figure S11a,b, Supporting Information) and 19.3 °C (inside air 22.4 °C, Figure S12a,b, Supporting Information), contributing to an increased extra energy gain (Enet) of 1.48 W from the environment and bulk water (Ewater = 0.07 W due to a decrease of 0.3 °C for bulk water temperature within 1 h as shown in Figure S13a, Supporting Information) compared to that under 1.0 sun (Enet = 1.42 W). Therefore, although the incident solar energy (Ein) was decreased by 20% from 1.0 to 0.8 sun, the apparent evaporation rate was only decreased by 12.6% from 3.938 to 3.508 kg m−2 h−1 (Figure S14a,b, Supporting Information) due to the more efficient energy harvesting from the environment under 0.8 sun (Enet = 1.48 W, Etotal = 2.54 W). An energy efficiency (η) of 165.8% was achieved for 0.8 sun illumination, which is slightly higher than that of 1.0 sun (162.7%). As the light intensity was further weakened to 0.6 and 0.4 sun, the average top surface temperature at steady state was further decreased to 29.2 (Figure S15a,b, Supporting Information) and 26.8 °C (Figure S16a,b, Supporting Information), respectively, while the steady average temperature of the outer-side surface was kept at 21.9 (Figure S15a,b, Supporting Information) and 21.6 °C (Figure S16a,b, Supporting Information), respectively. The steady temperature of the inner-side surface was measured to be 18.7 (inside air 21.8 °C, Figure S17a,b, Supporting Information) and 18.6 °C (inside air 21.7 °C, Figure S18a,b, Supporting Information) under 0.6 and 0.4 sun, respectively. Especially for 0.4 sun, cold evaporation occurred on all the surfaces of OHCE-3 as both top and side surfaces exhibited lower temperatures than the environment temperature (28.0 °C). The energy gained (Enet) from the environment and bulk water (Ewater = 0.07 W due to a decrease of 0.3 °C for bulk water temperature, Figure S13b,c, Supporting Information) was increased to 1.60 and 1.70 W under 0.6 and 0.4 sun, respectively. Likewise, due to the enhanced energy harvesting from the environment under 0.6 and 0.4 sun, although the incident solar energy was significantly decreased by 40% and 60%, the decrease in total energy input (Etotal = 2.39 W under 0.6 sun and Etotal = 2.23 W under 0.4 sun) and the decrease in apparent evaporation rate (3.084 and 2.689 kg m−2 h−1, Figure S14a,b, Supporting Information) were much smaller. The energy conversion efficiencies (η) under 0.6 and 0.4 sun were calculated to be 172.0% and 189.8% respectively. A highest η of 189.8% was achieved when the light intensity was decreased to be as low as 0.4 sun, under which all the surfaces of OHCE-3 became CESs to extract additional energy from environment for steam generation. For this strategy, although the energy gain from the environment increased with the decrease in incident light intensity, the actual evaporation rate decreased which is detrimental to the practical clean water output.
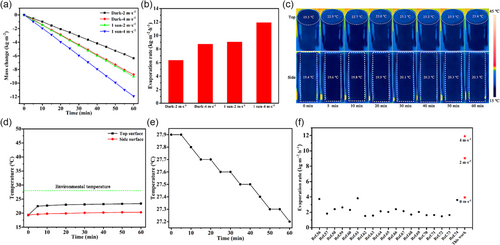
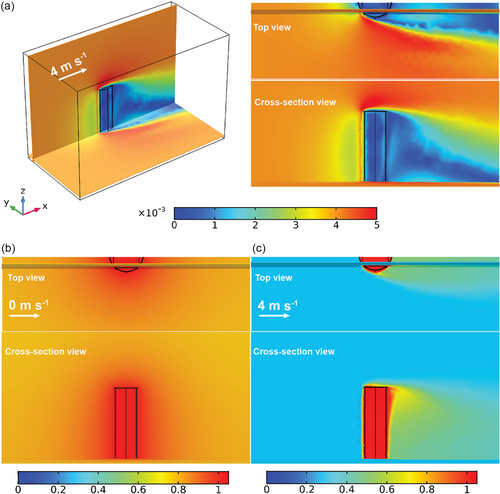
To circumvent this issue, convective flow was introduced to enable all cold-surface evaporation over OHCE-3 and significantly improve its evaporation rates under 1.0 sun. Convective flow could also effectively remove generated vapor from the evaporation surfaces to ensure continuous highly efficient water evaporation.[39] For instance, at a convective flow rate of 2.0 m s−1, much higher evaporation rate of 9.044 kg m−2 h−1 under 1.0 sun was achieved by OHCE-3 (Figure 6a,b). Under dark condition, the evaporator showed a high evaporation rate of 6.347 kg m−2 h−1 (Figure 6a,b), which is also higher than the evaporation rate without convective flow under 1.0 sun (3.938 kg m−2 h−1). IR images showed that under 1.0 sun and 2.0 m s−1 convective flow, both top and side evaporation surfaces had lower temperatures than the environmental temperature (Figure S19a,b, Supporting Information). The temperature tended to be steady at 24.0 °C on top surface and 20.6 °C on outer-side surface after 10 min, which were lower than the ambient temperature of 28.0 °C, and the inner-side surface also exhibited a lower steady temperature of 19.6 °C compared to inside air (23.9 °C, Figure S20a,b, Supporting Information), thus enabling all cold-surface evaporation. Meanwhile, bulk water (200 g) had a greater temperature decrease of 0.6 °C (Figure S21, Supporting Information) after 60 min compared to the evaporation without air flow (0.3 °C), meaning more energy being transferred from bulk water to the evaporator (Ewater = 0.14 W). By summarizing the energy extraction from the surrounding and inside air, bulk water, and the solar energy input, a significantly increased total energy of Etotal = 3.53 W was harvested by OHCE-3 through applying convective flow (2.0 m s−1) under 1.0 sun, contributing to the achieved extremely high evaporation rate (9.044 kg m−2 h−1). The energy conversion efficiency (η) was calculated to be 184.5%, which was still maintained to be higher than the theoretical energy limit 100%. When the convective flow rate was increased to 4.0 m s−1, an ultrahigh evaporation rate of 11.911 kg m−2 h−1 was achieved (Figure 6a,b). If solar irradiation was removed, the evaporator still could deliver a high evaporation rate of 8.738 kg m−2 h−1 (Figure 6a,b), resulting in a net evaporation rate of 3.173 kg m−2 h−1. The strengthened convection flow (e.g., 4.0 m s−1) could provide a better cooling effect to further lower the temperatures on both top (23.1 °C) and side surfaces (20.1 °C) during solar steam generation (Figure 6c,d), far below the ambient temperature of 28.0 °C (Figure 6d). The temperature difference between top and side evaporation surfaces was only 3.0 °C, indicating the fast consumption of solar heat on the top evaporation surface by evaporation. The steady temperatures of inner-side surface and inside air were measured to be 19.8 and 24.2 °C, respectively (Figure S22a,b, Supporting Information). Simultaneously, more energy was extracted from bulk water by the evaporator (Ewater = 0.16 W) as evidenced by the increased temperature drop (0.7 °C) of the bulk water (Figure 6e). Ultimately, a total energy input as high as Etotal = 3.67 W was achieved by OHCE-3 under 1.0 sun and 4.0 m s−1 convective flow, resulting in the extraordinarily high evaporation rate of 11.911 kg m−2 h−1. A significantly improved energy conversion efficiency of η = 217.0% was achieved for steam generation under such condition. Therefore, applying a convective flow for solar steam generation can not only enable all cold-surface evaporation with zero energy loss but also guarantee an ultrahigh evaporation rate, which is superior to most of the reported 3D solar evaporators (Figure 6f).[56-74] In addition, convective flow can also fully activate the water evaporation on inner-side evaporation by efficiently removing the vapor accumulated inside OHCE-3. In contrast, the enclosed evaporator (EHCE) exhibited much lower evaporation rates under both dark condition (4.017 and 6.094 kg m−2 h−1) and 1.0 sun irradiation (6.260 and 8.735 kg m−2 h−1) with convection flow rates of 2.0 and 4.0 m s−1, respectively (Figure S23a,b, Supporting Information). Numerical simulations were conducted to gain in-depth picture of the air flow and humidity distribution around OHCE-3 with and without convective flow during solar evaporation (Figure 7 and S24–26, Supporting Information). As shown in Figure S27, Supporting Information, when the external convective flow rate was 0 m s−1, there is no obvious air flow both inside and outside OHCE-3. Therefore, the vapor generated was accumulated around the evaporator, leading to high local humidity (Figure 7b). In contrast, when the external convective flow rate was 4.0 m s−1, the air flow velocity distribution around OHCE-3 was significantly changed. Air flow both inside and outside OHCE-3 was observed (Figure 7a). As a result, the vapor near the evaporation surfaces and inside the evaporator was effectively removed (Figure 7c), leading to the lowered humidity level around OHCE-3 and thus a higher evaporation rate.
Based on the previous experimental results, the excellent solar evaporation performance of OHCE-3 can be ascribed to its unique 3D opened hollow structure. During solar steam generation, water is continuously pumped up along the side surfaces of the evaporator via capillary force and finally reaches the top evaporation surface. The top evaporation surface harvests the incident solar light and implements solar evaporation, while the side surfaces act as CESs to harvest extra energy from the surrounding air and bulk water, resulting in a significantly increased total energy input for water evaporation. The generated vapor inside the hollow system can easily escape to the surrounding environment via the slots on side evaporation surfaces of OHCE-3, thus activating the evaporation on inner surfaces and enhancing the overall solar evaporation. By applying a convection flow, this rational designed 3D evaporator could further significantly enhance the solar evaporation performance due to the promoted vapor escape from the evaporator and extra energy harvesting.
To test the applicability of the developed solar evaporator under real-world condition, outdoor evaporation test was implemented over OHCE-3 for 9 h between 8:00 am and 17:00 pm (Figure S28a, Supporting Information). The environmental conditions, such as light intensity, air flow rate, temperature, and humidity, were recorded during outdoor tests (Figure S28b,c, Supporting Information). Light intensity was initially increased from 0.42 to 1.14 sun and then decreasing to 0.71 sun during the day, while convective flow rate was fluctuated between 0.96 and 1.96 m s−1. As a consequence, the evaporation rate varied with the weather conditions as shown in Figure S28d, Supporting Information. A maximum evaporation rate of 11.626 kg m−2 h−1 was achieved. After 9 h of continuous water evaporation, a cumulative evaporation mass flux of 89.779 kg m−2 was realized. This outdoor evaporation experiment demonstrates the excellent performance of the as-fabricated solar evaporator in water evaporation under natural environmental conditions.
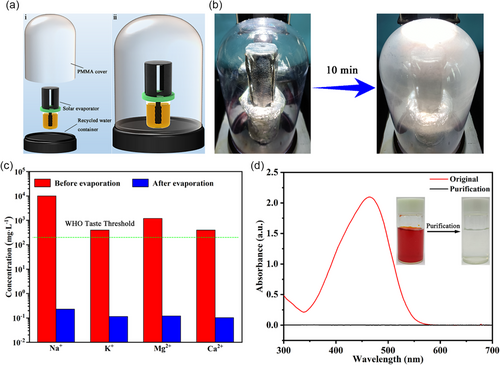
Because the quality of the clean water generated by solar evaporation is an important factor determining its practical application, the vapor produced by OHCE-3 in this work was condensed using a transparent device (Figure 8a,b) to measure the water quality. A model SW (Na+, 10 000 mg L−1; K+, 400 mg L−1; Mg2+, 1200 mg L−1; Ca2+, 400 mg L−1) was utilized for the desalination test over OHCE-3 under 1.0 sun. The collected condensed water contained a substantially decreased concentrations of Na+ (0.228 mg L−1), K+ (0.114 mg L−1), Mg2+ (0.121 mg L−1), and Ca2+ (0.103 mg L−1) (Figure 8c), which met the standard of drinkable desalination water defined by the world health organization (WHO). Moreover, OHCE-3 was also applied to purify dye wastewater as exemplified by 0.01 m MO solution. As observed in UV–Vis absorption spectra (Figure 8d), the characteristic absorption peak of MO at 464 nm disappeared in the condensed water, indicating the efficient removal of MO by solar evaporation. An obvious color change from red MO solution to transparent condensed water was also observed (the inset in Figure 8d). Furthermore, a continuous solar evaporation of SW (8 h) was carried out to test the stability of OHCE-3. Within the initial 4 h, there was no salt formed on the evaporation surfaces. After that, some white salt crystals were observed on the top surface (Figure S29a, Supporting Information). However, the evaporation surface can be readily recovered by dropping a small amount of SW to re-dissolve the deposited salt. In comparison, the side evaporation surfaces were kept unchanged during the 8 h of solar evaporation. The evaporation rate was relatively stable at 10.667–11.529 kg m−2 h−1 during initial 5 h, and then slightly decreased to 8.755 kg m−2 h−1 after 8 h due to the salt fouling (Figure S29b,c, Supporting Information). However, the average evaporation rate over the 8 h solar evaporation was still as high as 10.448 kg m−2 h−1, showing great potential for practical application in seawater desalination. For the continuous solar evaporation of 0.01 M MO solution, the evaporation rate remained stable in the range of 11.313–11.723 kg m−2 h−1 (Figure S30a,b, Supporting Information), no noticeable deterioration in evaporation performance was observed, suggesting the robustness of the solar evaporator for dye wastewater purification.
3 Conclusion
In summary, a 3D opened hollow photothermal evaporator has been fabricated for highly efficient solar steam generation. This special structure not only allows an efficient water evaporation by minimizing energy loss and introducing CESs for harvesting additional energy from the bulk water and surrounding air, but also provides side slots to enable the evaporation on both inner and outer evaporation surfaces, thus significantly promoting the solar evaporation. Compared to the enclosed hollow evaporator, this new opened hollow evaporator could deliver a much higher evaporation rate with fewer materials consumption. By introducing a convective flow, cold evaporation occurred on all the surfaces of the solar evaporator, resulting in a remarkably increased energy harvest for solar evaporation system. The evaporation on the inner-side evaporation surfaces was also fully activated. An ultrahigh evaporation rate of 11.911 kg m−2 h−1 was achieved for OHCE-3 under an air flow rate of 4.0 m s−1 and 1.0 sun irradiation. Moreover, the outdoor tests confirmed that as-prepared solar evaporator was operable under natural conditions. In addition, OHCE-3 also demonstrated the excellent performance in seawater desalination and dye wastewater purification. This work provides an impetus for pushing forward the practical application of solar steam generation into clean water production.
4 Experimental Section
Synthesis of CSC and Pure CuS
0.5 g of copper (II) acetate monohydrate (Cu(CH3COO)2·H2O) and 0.565 g of thioacetamide were used as copper source and sulfur source, respectively, and were sequentially dissolved into 40 mL of 0.1 wt% cellulose nanofibrils suspension to form a homogeneous blue solution, which was kept in the water bath with 80 °C for 1 h under stirring condition. The as-synthesized sample was washed with water via centrifugation and redispersion into water for three times. The resultant CSC was freeze-dried at −50 °C overnight. The synthesis of pure CuS was similar to that of CSC, except that no cellulose nanofibrils were added.
Fabrication of Solar Evaporator
CSC powders were dispersed into 1 wt% hot agarose solution via homogenization at 35 000 rpm for 3 min to prepare CSC suspension with a CSC concentration of ≈22 mg mL−1. Then, the obtained CSC suspension was immediately sprayed onto the cotton nonwoven cloth, followed by freeze drying at −50 °C for 24 h. The double-layered CSC-coated cloth was cut and assembled with a steel frame to fabricate 3D opened hollow solar evaporator with a round top surface (diameter −4.2 cm).
Characterization
Solar Steam Generation
Numerical Simulation
Acknowledgements
Y.C. and Y.W. contributed equally to this work. This work was financially supported by the startup fund of Wuhan Textile University (Grant nos. 195027, 205016, and 215110), the National Natural Science Foundation of China (Grant nos. 22002112 and 21673167), the scientific research project from Hubei Provincial Department of Education (Grant no. Q20211705), the open project fund from Key Laboratory for New Textile Materials and Applications of Hubei Province (Grant no. FZXCL202109), and Australian Research Council (Grant nos. FT190100485 and PD220100583).
Open access publishing facilitated by University of South Australia, as part of the Wiley - University of South Australia agreement via the Council of Australian University Librarians.
Conflict of Interest
The authors declare no conflict of interest.
Open Research
Data Availability Statement
The data that support the findings of this study are available from the corresponding author upon reasonable request.


