A Novel Synthesis Yielding Macroporous CaFe2O4 Sponges for Solar Energy Conversion
Abstract
Phase-pure and highly crystalline CaFe2O4 with a sponge-like macroporous structure is synthesized for the first time via facile solution-based microwave reaction and subsequent short thermal treatment. The formation mechanism of the orthorhombic phase (Pnma) and the pore network is investigated in detail and reveals a complex formation of this p-type semiconductor. Superconducting quantum interference device (SQUID) magnetometry and Mössbauer spectroscopy confirm the phase changes by altered magnetic properties. Furthermore, the optical and photoelectrochemical properties of the material were investigated. The material has a bandgap of 1.9 eV and sufficient band positions for water splitting. Valence-to-core X-ray emission spectroscopy is used to support the band positions obtained from Mott–Schottky analysis. Photocathodes prepared from macroporous CaFe2O4 generate photocurrents under illumination with light of up to 600 nm.
1 Introduction
Renewable energies, especially solar and wind energy are predicted to make up the largest share of our future energy mix.1 Those techniques are, however, completely dependent on environmental conditions because photovoltaic cells and wind plants cannot generate power during the night and in times of no wind, respectively. The generated power has to be stored in large quantities, and the available techniques suffer from specific drawbacks. For example, storage systems based on compressed air or pumped hydroelectricity require special geological formations, whereas the use of Li ion cells is expensive and other battery types suffer from lower efficiencies and short lifetimes.2 To circumvent those problems, scientists are searching for alternative ways to harvest and store solar energy. Photocatalysis and photoelectrochemistry using semiconductors are a promising way to directly convert sunlight into chemical energy. For example, the splitting of water to form hydrogen for the use in combustion engines or fuel cells is considered a tempting way to store solar energy without the emission of carbon dioxide.3-5 Furthermore, some achievements have been made in the chemical reduction of CO2, and the resulting base chemicals can be used as a building block for chemical compounds or transformed into fuels such as methanol.6-8
Nearly half a century has passed since photoelectrochemical water splitting was first demonstrated on a TiO2 electrode.9 To this day, TiO2 remains the most used and best investigated photocatalyst. Due to its wide bandgap (>3 eV), TiO2 is however not suited for an efficient and large-scale conversion of solar light. Alternative visible light absorbers, which are at the same time affordable and stable, are therefore sought after. With reported bandgaps of around 2 eV, ferrites with the molecular formula AFe2O4 (A = Ca2+, Co2+, Cu2+, Mg2+, Mn2+, Ni2+, Zn2+, and so on) are promising candidates because they comprise only elements that are inexpensive and readily available.10 Among them, CaFe2O4 stands out because unlike most other known ferrites it does not crystallize in a cubic spinel structure. Instead, due to the larger ionic radius of Ca2+, which is too large to allow the incorporation into the tetrahedral sites of a face-centered cubic oxygen lattice of a spinel, CaFe2O4 exhibits a stretching of the unit cell that leads to the formation of an orthorhombic crystal system.11 As a consequence, CaFe2O4 has some considerable advantages regarding the application in solar energy conversion. While having a bandgap that is comparable with that of many spinel ferrites, the reported conduction band potential is located more cathodic than the hydrogen reduction potential, making CaFe2O4 a candidate for photocatalytic hydrogen evolution.12, 13 Furthermore, CaFe2O4 is antiferromagnetic and therefore does not interfere with magnetic components—a fact that can be of critical importance in applications where magnetic stirring is required.14 In contrast, the distorted crystal structure of CaFe2O4 makes its synthesis more demanding. Although numerous syntheses yielding nanostructured spinel ferrites are known, the synthesis of CaFe2O4 usually requires high annealing temperatures above 1000 °C and long reaction times of 24 h and more, which leads to the formation of dense, microscale crystallites.15 Only few pathways leading to nanostructured CaFe2O4 are known. In 2010, Šepelák et al. were able to produce nanocrystalline CaFe2O4 by mechanochemical synthesis using a ball mill and CaO/α-Fe2O3 as starting materials.16 However, as the authors stated themselves, the obtained nanocrystals exhibited a large number of defects, and only the core of the particles was crystallized in an ideal orthorhombic crystal structure. As crystal defects act as recombination sites for photoexcited charge carriers, such defect-rich materials are expected to perform weakly in photocatalysis. A solution-combustion synthesis yielding CaFe2O4 with a high surface area of 79 m2 g−1 was presented by Zhang and Wang.17 The reaction conditions however can be considered harsh, and exact reproducibility is problematic as small explosions during synthesis were reported. Furthermore, the reported magnetism indicates that another crystal phase might be present apart from the orthorhombic CaFe2O4. In 2017, the synthesis of CaFe2O4 nanofibers by electrospinning and subsequent annealing at 800 °C was reported. No indications for by-phases were found and the authors could demonstrate that nanostructuring of phase-pure CaFe2O4 is possible using a soft-chemical bottom-up approach,18 but the applicability of the material for water splitting was not investigated. Recently, we reported on the preparation of hierarchical porous CaFe2O4 photocathodes at even lower temperatures, but the synthesis turned out to be very delicate regarding the temperature control for a phase-pure synthesis.19
Therefore, we developed a quick, facile, highly reproducible, and scalable synthesis route yielding phase-pure CaFe2O4 structures with crystallite sizes way below 100 nm. This could be achieved by a microwave-assisted approach that required subsequent calcination. The obtained material was thoroughly characterized regarding phase purity, porosity, and optical and electronic properties. Furthermore, the applicability as hydrogen evolution and water splitting photocatalyst and as photoelectrode material was investigated.
2 Results and Discussion
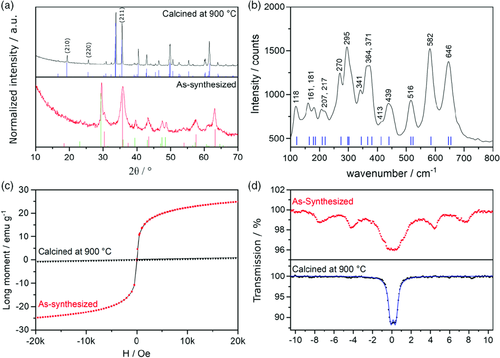
Synthesis of macroporous CaFe2O4 was performed by microwave-assisted decomposition of Ca(OAc)2·H2O and Fe(NO3)3·9H2O in 1,4-butanediol and subsequent temperature treatment of the obtained brown intermediate powder. A microwave temperature of 300 °C and an elevated pressure of 20 bar, as well as a slight stoichiometric Ca2+ excess of 10% were necessary to ensure the correct stoichiometric Ca:Fe ratio of 1:2 in the intermediate powder, as shown by energy-dispersive X-ray spectroscopy (EDX; Figure S1, Supporting Information). Only if the Ca:Fe ratio was carefully adjusted, the conversion to CaFe2O4 could be achieved without the formation of any by-phases. After calcination of the intermediate powder at 900 °C for only 1 h, X-ray powder diffraction (XRPD; Figure 1a) confirms the formation of phase-pure, orthorhombic (Pnma) CaFe2O4 with an average crystallite size of 49 nm (determined via Scherrer equation, assuming a shape factor of 0.94). The given value is averaged from the evaluation of the (210), (220), and (211) reflections. The intermediate powder consists of a mixture of calcium carbonate and a spinel phase (Figure 1a, as-synthesized). Claims about the existence of a cubic spinel CaFe2O4 phase can be found in the literature, but were disregarded as improbable.20, 21 The presence of the unknown spinel phase is instead attributed to the formation of magnetite (Fe3O4, ICDD no. 01-075-0449). Due to similar unit cell parameters, the X-ray diffraction pattern of Fe3O4 hardly differs from that of other spinel ferrites, especially when the reflections are broad due to nanosized crystallites. Transmission electron microscopy (TEM; Figure S2, Supporting Information) reveals the presence of CaCO3 in close contact with Fe3O4 nanorods in the as-synthesized sample. The anisotropic rod-like morphology is reflected in the XRPD pattern, e.g., the (440) reflection at 63.2° 2θ is sharper and has a higher intensity compared with the reference pattern. Nevertheless, the homogeneous distribution of calcium- and iron-containing phases in the intermediate powder ensures short diffusion pathways for the conversion to CaFe2O4. A calcination temperature of 900 °C is still necessary to obtain phase-pure CaFe2O4, due to the complex phase diagram of the CaO/Fe2O3 system, which predicts the formation of different calcium iron oxides in this temperature regime.11, 22 The necessary reaction time could however be significantly reduced, compared with solid-state reaction (SSR), as phase-pure CaFe2O4 is already obtained after 1 h (heating rate: 10 K min−1).
An in situ XRPD (Figure S3, Supporting Information) study reveals that the CaCO3/spinel system is stable up to a temperature of 600 °C. The calcium carbonate is then rapidly decomposed upon further temperature increase, which leads to the disappearance of the reflection at 29.6° 2θ, and results in a mass loss of roughly 10%, observable by thermogravimetric analysis (TGA; Figure S4, Supporting Information). Decomposition of CaCO3 leads to the formation of Ca2Fe2O5, which crystallizes in the orthorhombic brownmillerite structure (ICDD 00-018-0286). Stoichiometry dictates that iron oxide phases are present at the same time. This is observed as broad background features in the respective diffraction patterns (Figure S2, Supporting Information) and confirmed by TEM images still showing the presence of the nanorods (Figure S5, Supporting Information). In the temperature range between 600 and 900 °C, the two phases merge. Differential scanning calorimetry displays a positive heating current over the whole temperature range, whereas thermal gravimetric analysis shows no mass loss, indicating continuously ongoing changes of the phase composition. XRPD confirms a reorientation of the phases because reflections belonging to the calcium-deficient phase Ca4Fe14O25 (ICDD no. 00-13-343) emerge between 700 and 800 °C. Growth of this phase happens presumably at the grain boundaries between Ca2Fe2O5 and the iron oxide. Increasing the temperature to above 800 °C results in the formation of CaFe2O4 (ICDD no. 01-074-2136) and at 900 °C, no by-phases can be detected.
The phase purity of the sample calcined at 900 °C is confirmed by Raman spectroscopy (Figure 1b). The positions of the Raman bands are in very good agreement with the literature and no indication for the presence of any by-phase is found.23 The transition from the as-synthesized powder toward CaFe2O4 strongly alters the magnetic properties of the sample. A magnetic response of the as-synthesized powder is clearly evidenced by superconducting quantum interference device (SQUID) magnetometry (Figure 1c) and zero-field Mössbauer spectroscopy (Figure 1d). The magnetization curve of the as-synthesized powder shows no hysteresis, indicating a superparamagnetic sample, in good agreement with the presence of ferrimagnetic Fe3O4. The absence of the hysteresis is explained by the nanocrystalline nature of the particles.24 Indeed, when the magnetization curves are collected at 10 K, which is below the blocking temperature of the Fe3O4 nanorods, a hysteresis curve can be observed (Figure S6, Supporting Information). After thermal treatment, the magnetization curve of the sample shows no superparamagnetic response anymore, which is in accordance with the antiferromagnetic nature of orthorhombic CaFe2O4 and a verification for the complete conversion of any magnetic intermediate species. The room-temperature magnetic moment was determined to be μeff = 5.13 at 293 K.
In the zero-field, room-temperature Mössbauer spectra, a sextet can be observed for the as-synthesized powder suggesting a permanent magnetic moment of the sample, which is a further confirmation for the presence of Fe3O4. The relatively weak intensity and the very broad lines of the magnetic sextet are a consequence of the small particle size and the differences between the Mössbauer parameters of the iron centers on the surface and in the core of a particle. The two individual sextet spectra that would be expected for Fe3O4 could therefore not be resolved.25 For the sample calcined at 900 °C, the Mössbauer spectrum shows one doublet with a chemical shift of δ = 0.367(4) mm s−1 and a quadrupole splitting of ΔEQ = 0.497(6) mm s−1, which is typical for iron(III) in the HS state for CaFe2O4.26
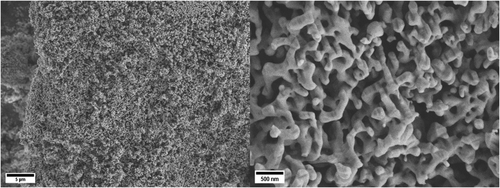
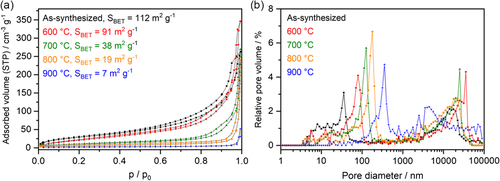
Scanning electron microscopy (SEM) images reveal that the calcined, phase-pure CaFe2O4 exhibits a sponge-like, porous macrostructure with walls that are several hundred nanometers in diameter (Figure 2). This is interesting because the use of high calcination temperatures and the various changes of the crystal structure were expected to facilitate the formation of larger, sintered structures. SEM images taken of samples calcined at lower temperatures (600, 700, 800 °C) indicate that the pore system is formed from a network of small aggregated particles that are sintered together upon thermal treatment (Figure S5, Supporting Information). The changes in morphology upon calcination were investigated in greater detail using nitrogen physisorption and mercury intrusion porosimetry (MIP). The growth of a macropore structure from agglomerations of nanoparticles is reflected by the nitrogen physisorption isotherms of samples annealed at different temperatures (Figure 3a). The as-synthesized material shows a type IVa isotherm, whereas the hysteresis loop could be assigned to type H3, indicating the presence of interparticular voids between nanoparticles, or even incompletely filled macropores.27 With increasing temperature, sintering effects lead to the formation of larger pores from those cavities, which cannot be detected by nitrogen physisorption anymore. This is in accordance with the specific surface areas that were determined from the physisorption data using the Brunauer–Emmet–Teller (BET) model. The as-synthesized sample exhibits a high specific surface area of 112 m2 g−1 as a consequence of the nanostructuring. After annealing, the surface area is decreased with each temperature step. The surface area of the final product CaFe2O4 is only 7 m2 g−1, which is however still higher than that reported for samples obtained by conventional SSR.17 MIP (Figure 3b) reveals a continuous increase in the average pore diameter with higher calcination temperatures. For the phase-pure CaFe2O4, a total pore volume of 1.4 cm3 g−1 was determined after calcination at 900 °C (Figure S7, Supporting Information). Roughly 40% of the total pore volume can be attributed to the macropore system, which is reflected in a broad pore size distribution between 100 and 1000 nm, with an average macropore diameter of 393 nm. Pores with diameters of several micrometers that are visible in the pore size distribution are attributed to larger cavities between agglomerated macroporous particles.
The macroporous structure of the material is expected to be beneficial for photoelectrochemical and photocatalytic applications because the diffusion lengths for excited charge carriers are kept short, whereas at the same time high crystallinity decreases the amount of defect recombination sites in the bulk. The optical absorption spectrum shows that CaFe2O4 is able to absorb visible light of all wavelengths below 650 nm (Figure 4). An indirect optical bandgap of 1.92 eV was determined by Tauc plot construction, which is in excellent agreement with published literature.12, 28 Valence-to-core X-ray emission spectroscopy (VtC-XES) was used to determine the valence band maximum of CaFe2O4. The VtC-XES spectrum shows that the maximum of the Fe Kβ2,5 emission signal is clearly shifted toward a higher photon energy compared with that of hematite which was measured as a reference. This suggests a cathodic shift of the valence band maximum by 0.7 V in relation to hematite, whose conduction and valence band edges are located at +0.34 and +2.37 V versus reversible hydrogen electrode (RHE), respectively (assuming a bandgap of 2.03 eV, which was determined by absorption spectroscopy in diffuse reflectance).29 This shift suggests that the band potentials of CaFe2O4 enclose the water splitting potentials (Figure 4d). With –0.25 V versus RHE, the overpotential provided by CaFe2O4 for the hydrogen reduction half-reaction is comparable with that of anatase TiO2.
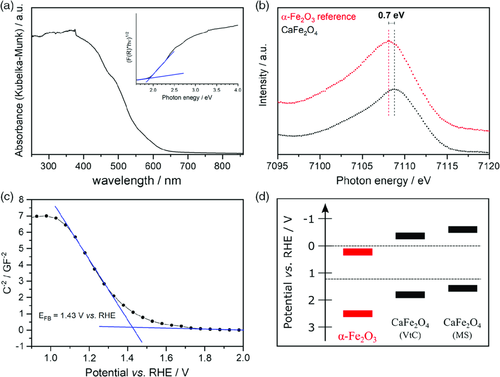
The Mott–Schottky (MS) plot obtained from electrochemical measurements of electrodes prepared by spray coating macroporous CaFe2O4 onto fluorine-doped tin oxide (FTO) coated glass shows a flatband potential of 1.43 V versus RHE. Similar to examples in the literature, the negative slope of the MS plot indicates p-type semiconducting behavior.12 Assuming that the flatband potential is equal to the valence band maximum, the determined valence and conduction band potentials are located slightly more cathodic than the VtC-XES measurement suggests. They are however considerably more anodic than the previously reported flatband potential of sol–gel derived, mesoporous CaFe2O4 thin films.19 It has to be kept in mind that the flatband potential does not exactly represent the valence band maximum but is located slightly more cathodic in the case of a p-type semiconductor. Furthermore, a capacitor-based equivalent circuit was assumed for the calculation of the MS plot, which might not be an ideal model for porous electrodes and might be the reason for an overestimation of the band potentials. Therefore, the results obtained by VtC-XES are considered more reliable. Nevertheless, both techniques suggest that CaFe2O4 is a candidate for photocatalytic hydrogen evolution and even overall water splitting. To the best of our knowledge, only one example can be found in literature where hydrogen was evolved from CaFe2O4 suspended in a MeOH/H2O under bias-free conditions.30 In our experiments, no such activity could be observed. Overall water splitting after deposition of a RhCrOx cocatalyst was also attempted, but yielded neither hydrogen nor oxygen. The lack of activity might be a consequence of the p-type semiconducting nature of the material. The band bending that occurs at the semiconductor–electrolyte interface as a consequence of space-charge-layer formation hinders the accumulation of holes, which is needed to drive the kinetically challenging water oxidation half-reaction. It has been shown that p-type semiconducting can also negatively influence hydrogen evolution in the presence of a sacrificial agent.31 The available overpotential of 0.44/0.2 V for water oxidation (depending on the method of determination) might therefore be insufficient to facilitate such reactions. Furthermore, cocatalyst studies might be necessary to investigate the performance of CaFe2O4 in photocatalytic water splitting.
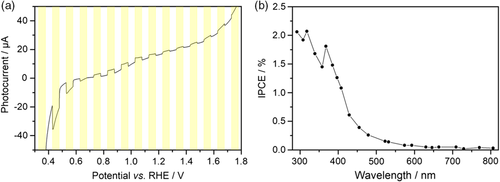
In photoelectrochemical measurements, the formation of a space charge layer can be prevented by application of an external bias. Experiments with H2O2 as a sacrificial agent revealed that the material indeed shows a photocurrent response (Figure 5a), but no photocurrent response was detected without H2O2. A cocatalyst might be necessary to facilitate charge transfer to the electrolyte, which will be investigated in the future. Interestingly, the direction of the photocurrent switches at an external potential of +0.7 V versus RHE. This phenomenon is explained by the chemical nature of the sacrificial agent H2O2, which can act both as hole scavenger or as electron scavenger. Depending on the applied bias, the type of reaction that occurs at the semiconductor–electrolyte interface is changed.32 Incident photon-to-current efficiency (IPCE) displays the generation of a photocurrent upon illumination by light with wavelengths below 600 nm. This is in good agreement with the absorption spectrum of CaFe2O4 and confirms that photons with energies slightly above the bandgap are utilized for the generation of a photocurrent. The absolute photocurrents that were measured decreased at least partly as a consequence of the spraying technique that was used to prepare the photoelectrode. This immobilization technique facilitates a weak contact with the back electrode and between individual CaFe2O4 grains, and has to be improved in the future. Nevertheless, the IPCE results display that most of the absorbed photons in CaFe2O4 can be utilized for photocurrent generation.
3 Conclusions
Phase-pure CaFe2O4 with a bandgap of 1.9 eV was synthesized by a facile microwave-assisted route. The result is a macroporous, high-temperature stable mixed oxide ceramic exhibiting a sponge-like macroporous structure with high porosity and highly crystalline walls that are several hundred nanometers in diameter. The conduction and valence band potentials were determined by two different techniques and the obtained results are in good accordance, suggesting that the material is able to split water. IPCE spectroscopy revealed an efficient utilization of incident photons when an external bias was applied, indicating that the p-type semiconducting nature might be responsible for the lack of the ability to evolve hydrogen in dispersions. The material nevertheless remains a very interesting candidate for other photocatalytic applications and as photocathode material. For example, the applicability in the reduction of carbon dioxide remains to be investigated. The activity of CaFe2O4 photoelectrodes will be further increased in the future by surface modification and optimization of the immobilization on the substrate.
4 Experimental Section
All chemicals were used without prior purification or drying. In a typical synthesis approach for CaFe2O4, 97 mg (0.55 mmol; 10% stoichiometric excess) of Ca(OAc)2·H2O (ROTH, ≥99%) and 404 mg Fe(NO3)3·9H2O (Acros Organics, ≥99%) were dissolved in 15 mL of 1,4-butanediol (ROTH, ≥99%). The solution was transferred to a borosilicate reaction vessel and closed with a PTFE-coated silicon seal. The precursor solution was quickly heated to 300 °C in 2 min, using an Anton Paar Monowave 400 laboratory microwave. After reaching the target temperature, the temperature was kept for 30 min, and then the solution was cooled down over 5 min using compressed air. During all microwave steps, the sample was stirred at 600 rpm using a magnetic stirring bar. The obtained suspension was transferred to 20 mL of acetone, centrifuged, and the solvent was removed from the sediment. The sediment was washed three times with a mixture of water/acetone (30/5 mL) and once with diethylether (25 mL). After drying at 80 °C for at least 12 h, a dark brown powder was obtained. Temperature treatment of this powder at 900 °C for 1 h (ramp: 10 K min−1) yielded phase-pure, macroporous CaFe2O4.
X-ray diffraction patterns were collected using a PANalytical EMPYREAN diffractometer equipped with a PixCel 1D detector using Cu Kα radiation (λ = 1.54060 Å). To eliminate the fluorescence background, the pulse-height discrimination (PHD) values of the detector were set to 8.05 and 11.27 keV for the lower and upper levels, respectively. For the in situ measurements, the diffractometer was equipped with a XRK900 high-temperature Bragg–Brentano geometry reaction chamber by Anton Paar. Data were collected in steps of 20 K and the temperature was kept constant during the measurements. The atmosphere in the reaction chamber was air.
Raman spectra were measured with a Bruker Senterra Raman microscope equipped with a 532 nm Nd:YAG laser. The spectral resolution was set to 9–15 cm−1 and the spectra were averaged from 50 individual spectra measured with an integration time of 3 s each.
SEM imaging and EDX spectroscopy were performed using a Zeiss LEO 1530 SEM equipped with Thermo Fisher Scientific NS7 UltraDry EDX detector. For imaging purposes, the SEM was operated at an accelerating voltage of 3 kV. The working distance was chosen between 6 and 7 mm and the aperture was set to 30 μm. For EDX measurements, the accelerating voltage, working distance, and aperture were raised to 15 kV, 8 mm, and 60 μm, respectively. TEM was performed in a JEOL JEM-2200FS energy-filtered transmission electron microscope with Schottky field-emission gun and in-column Omega energy filter, operated at 200 kV. For TGA and differential scanning calorimetry, a Netzsch STA 449 Thermal Analysis Setup was utilized. Data were recorded in a range from 25 to 1000 °C with a heating rate of 2 K min−1.
UV/vis diffuse reflection spectra were recorded in the range of 200–860 nm using a Perkin Elmer Lambda 750 UV–vis–NIR spectrometer equipped with a Harrick “Praying Mantis” mirror unit. The spectra were converted into absorption spectra by the Kubelka–Munk equation, and Tauc plots were constructed to determine the optical bandgap.
X-ray emission experiments at the Fe Kβ2,5 line were performed at the I20 scanning beamline at the Diamond Light Source synchrotron at Harwell Science and Innovation Campus in Oxfordshire, UK. The excitation energy was tuned to 7500 eV using a dual crystal “four bounce” monochromator, and the emission energy was selected using a Johann-type spectrometer with three spherically bent Si analyzer crystals and a Medipix 2D detector arranged around the sample in a Rowland circle of 1 m in diameter. Energy calibration was performed by aligning the Fe Kβ signal of an iron foil. The reference for the determination of the CaFe2O4 valence band potential was α-Fe2O3 (Acros Organics, 99 999%).
57Fe Mössbauer spectra were recorded in transmission geometry in constant-acceleration mode using a self-built Mössbauer spectrometer equipped with a 50 mCi57Co(Rh) source. Isomer shifts are given in relation to α-Fe foil. Magnetic measurements were collected using a SQUID MPMS-XL5 instrument from Quantum Design. The samples were cooled down without an external magnetic field. The field measurements at 10 and 300 K were performed from 100 Oe to 20 000 Oe to −20 000 Oe in the hysteresis mode, in steps of 500 Oe. The samples were prepared in gelatin capsules held in a plastic straw. The raw data were corrected for the diamagnetism of the sample holder.
The nitrogen physisorption measurements were performed using an Anton Paar QuantaTec ASiQ-MP-MP-AG. The samples were degassed for 12 h at 120 °C in vacuum prior to the measurements. The nitrogen physisorption isotherms were collected at 77 K. For the BET analysis,33 points between 0.05 and 0.3 p/p0 were chosen. MIP was performed in a pressure range of 0–400 MPa using a Thermo Fisher Scientific Pascal 140/440 porosimeter. 140° and 0.48 N m−1 were assumed as contact angle and surface tension of mercury, respectively. Data processing was performed with the Software Sol.I.D and the pore sizes were calculated according to the Washburn equation.
For (photo)electrochemical experiments, the CaFe2O4 powder was immobilized by spraying a suspension of 50 mg CaFe2O4 in 20 mL ethanol onto an FTO-coated glass, which was heated to 200 °C to allow quick evaporation of the liquid. A Zahner Zennium potentiostat was used for application of the external bias and for data collection. The photoelectrodes were measured in a three-electrode configuration against a Ag/AgCl reference electrode and a Pt wire acting as counter electrode. The electrolyte was 0.1 m Na2SO4 in water. For photocurrent measurements, 0.015 m H2O2 was added, and the electrolyte was degassed with Argon for 30 min. MS analysis was performed in the dark. For chopped light voltammetry (CLV) measurements, the sample was irradiated with a white light emitting diode (LED) emitting between 400 and 800 nm. The sweep rate in CLV measurements was 50 mV s−1 and the light was switched off and on in intervals of 5 s. For IPCE measurements, a commercial LED array by Zahner (TLS03) was used.
The applicability of CaFe2O4 for hydrogen evolution and water splitting was tested using a self-built, magnetically stirred slurry reactor that was operated with argon as carrier gas. Irradiation was performed from the top with an AM1.5G solar simulator (145 W). Hydrogen evolution tests were conducted in a 10% aqueous solution of methanol. For overall water splitting, Rh/CrOx was deposited prior to the photocatalytic test reaction using a procedure first reported by Maeda et al.34 Detection of the exhaust gas stream was performed by a Shimadzu GC-2014 gas chromatograph equipped with thermal conductivity detector.
Acknowledgements
We thank Christopher Simon (University of Bayreuth) for TEM measurements. Furthermore, we thank Rafael Meinusch and Felix Badaczewski (both University of Gießen) for MIP and Raman spectroscopy. We acknowledge Diamond Light Source for time on Beamline I20-scanning under proposal SP23538-1. A.B., J.T., and R.M. gratefully acknowledge financial support from the AiF within the program for promoting the Industrial Collective Research (IGF) of the German Federal Ministry of Economic Affairs and Energy (BMWi), based on a resolution of the German Parliament (project “QuinoLight”, 18904N1-5). H.K. gratefully acknowledges financial support from the Fonds der Chemischen Industrie.
Conflict of Interest
The authors declare no conflict of interest.


