Smart Photonic Indicator for Ethanol Detection via Pressure-Responsive Shape Memory Polymers
ABSTRACT
Smart photonic indicators (SPIs) offer a cost-effective and efficient way to monitor and control ethanol concentration, making them suitable for advanced digital informatics systems. The developed sensors can operate even after the removal of external stimuli, featuring exceptional optical memory and reconfigurable nanostructures, which will undoubtedly drive a revolution in colorimetric sensors. The SPI is prepared by polymerizing mixed monomers of poly(ethylene glycol) diacrylate (PEG600DA) and ethoxyethoxyethyl acrylate (EOEOEA) in a silica colloidal crystal template. SPIs contain periodically ordered interconnecting macropores via shape memory polymers (SMPs) that endow the films with structural colors. The evaporation of water can temporarily deform the initial periodic structure. The structure can then be restored by evaporating liquids with lower surface tension, such as water-ethanol solutions. The Laplace pressure generated during solvent evaporation competes with the elasticity of SMPs, driving nanoscale structural transformation. Consequently, the detection range of SPIs for ethanol concentration in water depends on the balance between these two driving forces. Adjusting the size of the macropores expands the detection range allowing differentiation of alcohol concentrations from 5% to 100%. SPIs with selectivity and high sensitivity hold promise for various applications, including information technology, inkless writing, and anticounterfeiting, enhancing the versatility of photonic materials.
1 Introduction
Alcohol is one of the most important organic solvents in daily life. They contain the hydroxy functional group (–OH) bonded to the carbon atom of an alkyl or substituted alkyl. Alcohols can be converted to and from many other types of compounds and are often used in the production of pharmaceutical preparations and organics [1]. However, selectively monitoring each alcohol is important. Detection of ethanol in high concentrations is important for process control and safety monitoring in industries that handle ethanol solutions, such as chemical manufacturing and fuel production [2]. Ethanol levels above 30 vol% are often used in these settings and sensors capable of accurately measuring high concentrations are crucial for preventing accidents such as fires or explosions, particularly in confined spaces or when the solution is heated. Efficient detection of ethanol concentration, especially below 40 vol%, is one of the keys to improving the efficiency of wine production [3]. In addition, water-alcohol mixtures have been actively studied due to the internal richness of physical and chemical processes [4]. In the case of methanol-water solutions, the refractive index, the diffusion coefficient, or the viscosity shows anomalies related to the segregation and clustering of water and methanol molecules at about 70 mol% water [5]. Ethanol–water mixtures show similar anomalies in the refractive index and viscosity at about 40 mol% water and 75 mol% water, respectively. Refractometry is one of the classical methods to estimate the alcohol content in water and offers physical hints about the molecular evolution in water-alcohol systems [6]. Nevertheless, the nonmonotonic dependence of the refractive index of water-ethanol or water-methanol creates inaccuracies, especially at concentrations above 50 vol% alcohol in water. Although UV-Vis spectroscopy, liquid chromatography [7], and Fourier transform infrared spectroscopy [8] have been used to measure ethanol concentration, their reliance on expensive equipment and longtime detection limits their practicality and convenience. Portable and rapid colorimetric detection of ethanol concentration is the definitive trend in development [9-11].
Structural color arises from the interaction of light with specific micro- or nanostructures rather than from pigments or dyes. A bright example of a structural color are photonic crystals (PCs). These are spatially periodic dielectric nanostructures that exhibit photonic band gaps in the electromagnetic wave spectrum [12, 13]. The concept of using PCs as colorimetric sensors originated from the pioneering work of the Asher group [14, 15]. The primary operation of most colorimetric sensors relies on two mechanisms. The first is refractometric, which involves changes in the effective refractive index of a PC due to the filling of its structural voids with the analyte [16-19]. This approach is appealing because of the predictable relationship between the analytical signal and the refractive index. The second mechanism, which we refer to as “chemical” involves the potential for material swelling or compression, which can lead to changes in the PC's lattice parameters [14, 15, 20-26] (more references available in recent review papers [27-31]). Both mechanisms influencing the spectral position of the photonic band gap can operate simultaneously [32-38]. However, all these sensors operate while submerged in the analytes. There is also another type of colorimetric sensors that operate based on the PC surface's wettability [3, 9, 39]. However, PC sensors quickly return to their initial configurations once the liquids are removed that limits their applicability. Therefore, designing next-generation PC colorimetric indicators with structural memory that can fix temporary configurations is highly timely, considering the rapid advancements in automation technology and artificial intelligence.
Shape-memory polymers (SMPs) are polymers capable of memorizing one or several temporary deformed states and returning to their original shape or certain intermediate states under external stimuli [40, 41]. A programming step traditionally involves heating the material above a specific transition temperature (Ttrans) (“hot” process). For polymeric materials, this is often the glass transition temperature (Tg) of the polymer. Conversely, if the programming step includes deforming the structure through pressure or cooling the sample at low temperatures, it is referred to as “cold” programming. López and colleagues were first to report heat-programmable photonic nanostructures based on SMPs [42]. Combining SMPs with PCs, which provide cold programmable structural colors, relied on the pioneering works of Jiang's group [43, 44]. Shape-memory photonic crystals (SMPCs) exhibit variable structural colors and respond to external stimuli [45-52]. As a result, SMPCs can function as porous carriers with innovative sensing capabilities for ethanol monitoring [10, 11, 53]. However, these intelligent sensors also operate in permanently infiltrated state with the tested liquids, and corresponding color changes are associated with changing effective refractive index plus swelling of polymers. Liquid evaporation during measurement creates challenges related to the instability of optical signals. New smart photonic indicators (SPI) based on SMPCs, which can retain the final color even when the testing liquid has completely evaporated, is exciting and expands its applications in portable colorimetric sensors. The operation principle of such SPIs is similar to that of litmus paper.
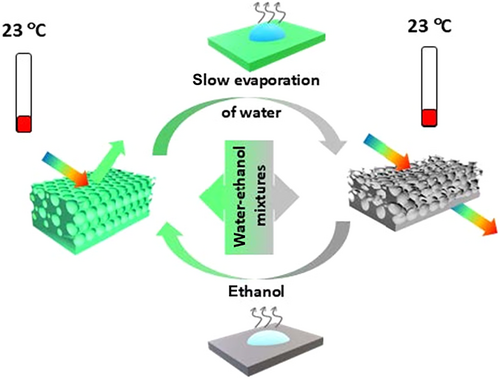
Herein, we present novel smart indicators developed at the intersection of PCs and SMPs. Ethoxyethoxyethyl acrylate-co-polyethylene glycol diacrylate (EOEOEA-co-PEGDA) copolymer was structured on an inverse opal lattice to realize intelligent optical sensing. These sensors maintain their initial state while also being able to be fixed in intermediate states. The low glass transition temperature of the copolymer allows for two distinct structural configurations in the rubbery state: an initial periodic structure with PC properties and a deformed structure without such property, as illustrated in Figure 1. The colorimetric sensing mechanism involves the orderly recovery of collapsed macropores induced by water-ethanol solutions. Structural transitions occur at room temperature via the evaporation of ethanol and water, driven by Laplace pressure competing with the elasticity of the SMP. The active range of this pressure defines the detection range for ethanol concentrations, which can be tuned by varying macropore size. Additionally, these portable SPIs demonstrate high selectivity. This study introduces an efficient method for real-time ethanol concentration detection in aqueous solutions, establishing a foundation for evaporation studies, reversible swelling/shrinking, cold-reprogrammable structural color, liquid printing, and anticounterfeiting technologies.
2 Experimental Section
2.1 Materials and Reagents
Tetraethyl orthosilicate (TEOS, ≥ 99.0% [GC], Sigma Aldrich), Ethanol (≥ 99.5% [GC], Sinopharm Chemical Reagent Co. Ltd.), Propanol (AR, 99%, Innochem), Isopropanol (AR, 99.5%, Sinopharm Chemical Reagent Co. Ltd.), Methanol (LR, ≥ 99.6%, Sigma-Aldrich), Ammonia water (~28%, Sinopharm Chemical Reagent Co. Ltd.), Hydrofluoric Acid (~49% solution in water, Adamas-Beta LTD), 2-hydroxy-2-methylpropiophenone photoinitiator (≥ 98.0%, Adamas-Beta LTD). Ethoxyethoxyethyl acrylate (EOEOEA) and Polyethylene Glycol (600) diacrylate (PEG600DA) were purchased from Yinchang company. Double-sided strong sponge foam tape (thickness ≈ 1 mm) was received from the 3M company. Menzel-Glaser glasses coverslips of 22 mm × 22 mm × 0.4 mm were purchased from Thermo Scientific.
2.2 Fabrication of Macroporous SPI Films
Highly monodispersed silica microspheres with average diameters ranging from 200 to 400 nm were synthesized using a modified multistep Stöber method [54]. Then, monodispersed silica nanoparticles with an average size of 280, 325 and 350 nm self-organized into the face-center cubic (fcc) structure by a vertical deposition method [55]. The silica colloidal crystal on the glass substrate was covered by another glass substrate with a ~1 mm-thick double-sided adhesive tape. The space between the glasses was filled with a mixture of monomers consisting of EOEOEA (acrylate monomer, molecular weight 188 g/mol, viscosity 3–10 cps at 25°C, refractive index 1.436 and Tg = ‒56°C) and PEGDA (acrylate monomer, molecular weight ~700 g/mol, viscosity 80–120 cps at 25°C, refractive index 1.469 and Tg = ‒41°C). The ratio of monomers varied from 1:1 to 1:10 volumetric ratios. After 10 min of polymerization by ultraviolet radiation (UV lamp with λ = 365 nm, ZF-7A, Kesheng Instruments) and removal of the glass plates, the silica opal was selectively dissolved within 1 min in a 5 vol% aqueous solution of hydrofluoric acid. The resulting thin inverse opal film was positioned on the surface of a thick, structureless layer from the same copolymer, which served as a substrate. The films were then washed with water and ethanol, followed by air drying.
2.3 Measurement of Sensory Prope
The SPI films, each measuring 1 cm × 1 cm, were placed between two glass slides measuring 25 mm × 45 mm × 1 mm, with the upper slide featuring a 10 mm × 10 mm × 0.8 mm recess with an 8 mm diameter central hole. Next, 10 μL of the analyte was dropped into the hole and evaporated completely under laboratory conditions (23°C and 40% relative humidity). The reflection spectrum was measured at a normal incidence angle. The water-ethanol solutions used in this study were prepared by mixing the components in volumetric ratios.
2.4 Characterization
The microstructure of SPI samples was investigated using an AmScope optical microscope (ME580T-PZ-2L) and on a Zeiss Gemini 500 field emission scanning electron microscope (SEM) at an accelerating voltage of 0.5−1.0 kV, with an aperture of 20 μm and a working distance of 7−8 mm (Everhart–Thornley secondary electron detector). Before scanning, no conductive layer was deposited on the surface of samples. Atomic force microscopy (AFM) imaging was performed using a Cypher VRS (Oxford Instruments Asylum Research) with X, Y scanning range 30 μm and 9 ± 2 nm tip radius (AC160TS-R3, Olympus) to characterize the topography and surface roughness of macroporous SPI films. The specular reflection spectrum from 200 to 1000 nm at eight degrees was recorded using a Lambda 1050 spectrophotometer (PerkinElmer) with the help of a Universal Reflectance Accessory of the same equipment. The registration step was 1 nm and the incident beam size on the sample was around 2 mm × 2 mm. Time-resolved reflection spectra at normal-incidence angle were obtained using a visible-near infrared Thorlabs CCS200 spectrometer with a stabilized tungsten halogen light source (SLS201L) and 200-μm quartz optical Y-shape fiber (RP20, Thorlabs) at the room temperature (23°C). Then, all spectra were normalized on the reflectance from silver mirror (Thorlabs, PFR10-P01). The recording spectral range was 190–1050 nm, with a resolution of less than 2 nm, a registration step of 0.2 nm and an integration time of 5 ms updated every 200 ms. The evolution of normal reflection spectra during droplet evaporation was observed and analyzed within the 400–900 nm spectral range. Differential scanning calorimetry (DSC) measurements were performed from −80°C to 20°C at a heating rate of 10°C/min using a Mettler-Toledo instrument (Switzerland). The SDC-200SH device was used to measure the contact wetting angle of the analytes on the surface of the macroporous SPI films. The software's calculating accuracy for the wetting angle is ±0.1.
3 Results and Discussion
3.1 Characterization of the SPIs
Monodisperse silica particles with average diameters of 280, 325, and 350 nm were used to prepare opal templates (see Supporting Information S1: Figures S1 and S2). Using these templates, we fabricated SMPs with inverse opal lattices labeled as SPI-280, SPI-325, and SPI-350. The initial structural colors of these samples were blue, green, and red, respectively (Supporting Information S1: Figure S3). We identified a specific ratio of liquid monomers that optimizes the optomechanical properties of SMPCs. The EOEOEA-co-PEGDA copolymer with a ratio of 1:7 exhibited the most notable shape memory behavior among the various compositions tested for all three samples. In other words, this ratio is optimal because if it falls below this proportion, our indicators will degrade their detection limit. Conversely, if it exceeds this ratio, we cannot cold-program our SPI-350 sample by evaporation of water. A vital advantage of these monomers is their sufficiently low viscosity, which enhances efficiency across all stages of SMPC fabrication. First, the monomers mix easily at room temperature, and second, they infiltrate the silica opal template without the need for additional force. The tensile strength of the EOEOEA-co-PEGDA composite copolymer showed deterioration as compared to the pure PEGDA polymeric matrix if the percentage of EOEOEA was lower than 12 vol% and its average Young's modulus decreased from ∼20 to ∼18 MPa (Supporting Information S1: Figure S4).
Transition between glassy and rubbery states managed by the glass transition temperature (Tg). DSC was used to determine Tg, as shown in Figure 2A, revealing a uniform Tg of approximately ‒43°C. This uniformity confirms that the cross-linked copolymer is a homogeneous mixture of its components. Furthermore, the absence of crystallization peaks in the temperature range of ‒80°C to 20°C confirms the amorphous nature of copolymer within this range. Below Tg, the material exhibits solid behavior, retaining its temporary shape. Above Tg, it transitions into a flexible polymer capable of recovering its original shape through the relaxation of internal stresses and rearrangement of molecular chains. Since we are working at room temperature, our copolymer is rubbery. Additionally, solvent evaporation from the macroporous structure induces significant Laplace pressure, which can transform the structural morphology. The competition between Laplace pressure and the elasticity of the copolymer is discussed in detail in Section 3.2.1.
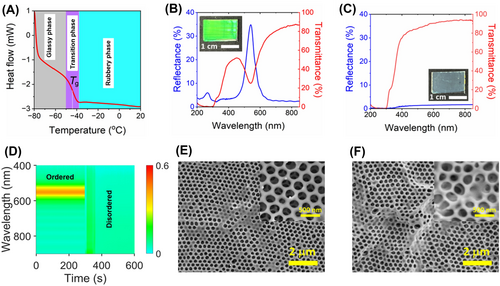
As an example, Figure 2B shows the reflection and transmission spectra of the green SPI fabricated from EOEOEA-co-PEGDA copolymer. It presents a uniform green color (see the inset of Figure 2B) and has strong and sharp reflection and transmission peaks at 542 nm with a full width at half maximum (FWHM) of ∼55 nm. It is the first photonic stop band (PSB). Another small peak is noticeable in the short wavelength region at 266 nm, associated with the second stop band. Oscillations in the long-wavelength regions are generated from the thickness of the SMPC.
In inverse opal lattice, the position of the PSB is determined by the void size, which, in turn, depends on the size of the spherical silica nanoparticles in the template. This confirmed the preservation of the 3D-ordered structure of the original silica colloidal crystal. Interestingly, the macroporous PC's vibrant colors vanished when water evaporated from the film, turning translucent with a faint white appearance (Figure 2C,D; see also Video S1). Transmission and reflection spectra revealed that the film became a transparent color (see the inset of Figure 2C) after evaporation of water, and the initial PSB peak disappeared. The noticeable decline in light intensity below 350 nm is associated with the absorption of light by the copolymer. The time-resolved reflection spectrum (Figure 2D) demonstrates that the initial stop band peak remained stable before the arrival of the water droplet (up to 300 s). However, the peak disappeared immediately upon contact with water. A slight reflection (∼20%) observed within 50 s after the water's arrival corresponds to the droplet's evaporation. By 350 s, the water had evaporated entirely, and consistently low reflection was observed afterward. Upon evaporation of the water droplet, the reflection coefficient approaches near zero, indicating that the PC properties vanish, and the material becomes transparent. This loss of PC properties occurs when the long-range periodicity is disrupted or destroyed. Previous studies have shown that evaporation of a liquid with high surface tension from a macroporous SMPC film can significantly deform or even collapse the structure [43, 52]. This process was referred to as cold programming [43]. Surface SEM images of the SPI-325 film confirmed the findings observed in the spectroscopy analysis. The initial microstructure, as shown in Figure 2E, exhibited a regularly periodic hexagonal arrangement of macropores throughout all layers of the inverse opal lattice. However, the surface SEM image of the same sample after water evaporation (see Figure 2F) shows that the lower layers adhered to the upper ones and shifted from their original positions, that is, collapsed the initial periodic structure. The structural configuration of SPI has temporarily changed to a disordered state, characterized by randomly spaced void cavities.
3.2 Detection Mechanism of Ethanol in Water Through Microstructure Analysis
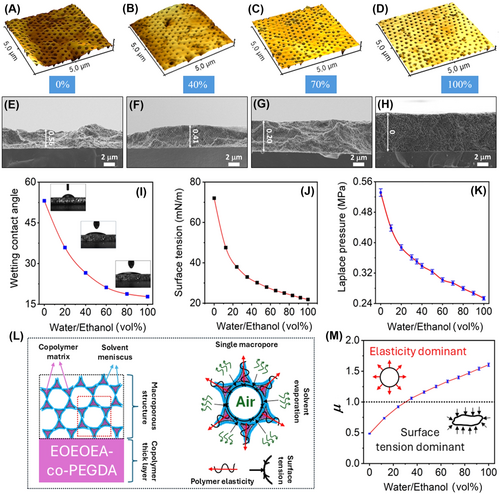
where γ is the liquid/vapor surface tension; r is the radius of the void cavity in the macroporous structure; and θ is the contact angle of the liquid at the porous surface. In the cases of ethanol and water (γ: 22.39 vs. 72.75 mN/m at 20°C) [59], the minimum Laplace pressure (PL) at the end of the evaporation, where r equals the macropore radius (r = 162.5 nm for the SPI-325 sample) is estimated from Equation (1) to be 0.25 and 0.53 MPa, respectively. The contact wetting angle (θ) decreases as the ethanol concentration in the water increases (see Figure 3I). The contact angle of ethanol–water solution with a high concentration is < 25°. So, the mixed solution can completely wet the macroporous structure [60]. Figure 3J shows the dependence of surface tension on the composition of water-ethanol mixtures and the corresponding Laplace pressure calculated using Equation (1) for the SPI-325 sample (Figure 3K). The lower γ value yields the lower PL, which appears insufficient to transform elastic macroporous films into disordered state in the case of pure ethanol. Previously known studies have shown that cold programming caused by water evaporation can be attributed to water's high surface tension, overpowering the polymer's elasticity [43, 44, 48, 52]. When solvent molecules are absorbed into the polymer network, they induce a plasticizing effect that relaxes physically entangled macromolecular chains [61, 62], increasing their mobility and decreasing the polymer's elastic modulus. During shape memory recovery, entropic elasticity drives the stretched polymer chains back to their original, thermodynamically preferred arrangements after removing the applied stress. However, prior studies have not fully explained the mechanism underlying strain fixation. Water surface tension, which corresponds to the high Laplace pressure, serves as the driving force for deforming the macroporous structure. If the surface tension of liquid surpasses the elasticity of the polymer, it drives the collapse of the ordered macropores. Most water molecules evaporate from the hydrophilic polymer network during the subsequent strain fixation stage. Secondary intermolecular forces, such as van der Waals interactions between the entangled polymer chains, “freeze” the polymer network in its deformed state. Consequently, some elastic energy remains stored in the deformed/semideformed polymer chains. This strain fixation mechanism, functioning as a molecular switch, in combination with Laplace pressure-induced deformation of the macroporous structure, underpins the unique shape memory effect observed in SPI. As ethanol is added to water, reducing the solvent's surface tension, the Laplace pressure decreases and is gradually overcome by the polymer's elasticity. As a result, the structure reverts to its original shape.
3.2.1 Competition Between Polymer Elasticity and Capillary Laplace Pressure
3.3 Monitoring Ethanol Detection Using Optical Spectroscopy
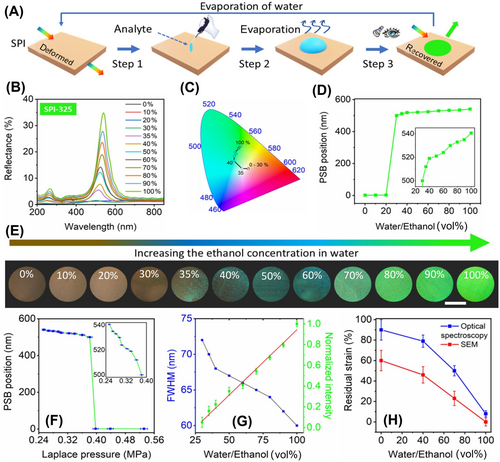
Two different approaches were used to characterize the stored strains in semi-deformed SPIs. The first straightforward approach was based on morphology imaging (SEM and AFM). Another nondestructive and informative method is optical spectroscopy, particularly reflectivity measuring. Sample preparation for optical measurement or exploitation of our SPI involve three steps: first, drop the analyte onto the surface of the disordered SPI film (step 1 in Figure 4A); second, allow the liquid to evaporate at room temperature (step 2 in Figure 4A); and finally, observe the resulting color under white light (step 3 in Figure 4A). This color appeared brightly when the ethanol concentration increased in the water. Figure 4B displays the reflection spectra of the SPI-325 sample measured at an angle close to normal incidence after the evaporation of water-ethanol mixtures. As observed, the SPI-325 remains transparent following the evaporation of pure water or mixtures with ethanol concentrations up to 35%, as the Laplace pressure dominates over the elasticity of the polymer. This observation aligns with the data presented in Figure 3M. The corresponding reflection spectra are mapped onto the color diagram in Figure 4C, where the trajectory direction indicates the color changes as the ethanol concentration in the water increases. Actually, the small first peak of the PSB appeared at 499 nm at ∼30% ethanol (Figure 4D) and then increased monotonously with the ethanol concentration, reaching 100% (see inset Figure 4D). The monotonous increase in the PSB peak is a significant advantage for sensors, as it eliminates the issue of signal ambiguity at high concentrations, which is common in refractometric sensors [19]. The corresponding changes in structural colors are vividly demonstrated in Figure 4E. The dependence of the PSB position on the Laplace pressure is shown in Figure 4F. As observed, the PSB peak remains suppressed up to a pressure of 0.39 MPa. Below this pressure, the peak begins to appear and increases monotonously as the pressure decreases. This indicates that, at lower liquid pressures, the material's elasticity is sufficient to restore the structure to its original shape. Variations in the ethanol concentration affect the surface tension of the solvent, which in turn alters the Laplace pressure exerted on the macroporous structure of the SPI. These changes are reflected in the stop band characteristics, such as a shift in spectral position, variation in FWHM, and changes in intensity as the water-ethanol mixture composition evolves (Figure 4G). As the ethanol concentration in water increases, the photonic-crystalline characteristics improve, with peaks narrowing and intensifying. The SEM and optical spectroscopy data allow us to evaluate the residual strain of our SPI. As shown in Figure 4H, both data sets reveal the same trend: as the ethanol concentration increases, the residual strain decreases, indicating that the structure is returning to its original shape.
The SPI templated from 325 nm silica particles could not detect an ethanol concentration below ∼30%. To enable detection at lower concentrations, it is necessary to reduce the Laplace pressure or increase the elasticity of the copolymer. Without altering the copolymer composition, we achieved this by varying the size of the macropores. As a proof, we used SPIs templated from 350 to 280 nm silica nanoparticles. According to Equation (1), increasing the macropore diameter reduces the Laplace pressure, thereby shifting the active range of pressure to a lower concentration range. Conversely, decreasing the macropore size shifts the sensitivity to a higher concentration range. The data in Figures 5 confirm this fact. Figure 5A shows the reflection spectra after evaporation of water-ethanol mixtures from SPI templated from 350 nm silica particles, while Figure 5B corresponds to 280 nm. For SPI-350, ethanol concentrations as low as 5% were detectable, whereas for SPI-280, detection began at 50% ethanol concentration. Sensors with a detection limit of ∼5% indicate that this resolution is acceptable for closed-loop air-fuel ratio control in flex-fuel engines [63]. However, this limit can be lowered by adjusting the copolymer ratio or slightly increasing the pore size from 350 nm. Figure 5C shows the spectral position of the PSB as a function of ethanol concentration in water for SPI-350 (red curve) and SPI-280 (blue curve). The SPI-350 sample demonstrates higher sensitivity at low ethanol concentrations, with a steeper curve up to 20% (∼1.85 nm/vol%), while SPI-280 exhibits lower sensitivity (∼0.5 nm/vol%) at concentrations above 60% (see insets in Figure 5C). These sensitivity values are higher than those of pure refractometric sensors [16-19] and are comparable to macroporous inverse opal films made from non-SMP materials [20, 25, 33, 37]. The sensitivity of the PSB signal varies due to its nonlinear dependence on concentration. In the first linear range of 0–40 vol%, the sensitivity is ∼0.5 nm/vol%, as noted by Ashurov et al. [37]. In contrast, in the range of 60–100 vol%, the sensitivity decreases to about 0.12 nm/vol% [37]. However, in Huang et al. [25] a linear dependence was established across the entire range of ethanol concentrations in water, with a single sensitivity of ∼1 nm/vol%. Our sensors provide adjustable detection ranges, offering several advantages over previously known sensors regarding stability after analyte removal, sensitivity, and selectivity (see Supporting Information S1: Table S1).
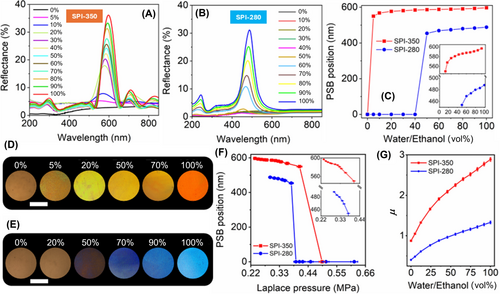
The evolution of reflective colors observed under the optical microscope for SPI-350 and SPI-280 is presented in Figure 5D,E, respectively. However, the PSB signal increases monotonically for both samples with increasing ethanol concentration. Figure 5F shows the dependence of the spectral position of the PSB peak on the Laplace pressure for these two indicators. For the SPI-350 sample with larger macropores, the first color signal of the PSB was detected at 0.4 MPa, while for the SPI-280 sample, it appeared at 0.37 MPa. For the previously discussed SPI-325 sample, this threshold was 0.39 MPa.
These pressure thresholds for structural color formation are close, differing by about 10%. This variation may stem from the assumption that the elasticity of the copolymers and the wetting contact angle are constants, whereas, in reality, these parameters may also depend on the macropore size. The calculated results seem to be inconsistent with the observed phenomena of ethanol evaporation-induced recovery and water evaporation-induced collapse. In both cases, the Laplace pressure is less than 1 MPa. This inconsistency can be explained by the fact that during the initial stages of solvent evaporation, the radius of the gas core is much smaller than the effective radius (rethanol and rwater). As a result, the pressure PL is much greater than the elasticity of polymer (Epolymer), which is ∼7.8 MPa. Consequently, the macropores easily collapsed due to the excessive pressure, leading to the storage of elastic potential energy during the initial stage. At the same time, the competition parameter μ for these samples, calculated using Equation (2), is shown in Figure 5G. For the SPI-350 sample, the curve is predominantly shifted to the region where μ > 1, except at 0% ethanol concentration. In contrast, for the SPI-280 sample, approximately half of the curve falls into the region where μ < 1, indicating that the surface tension of the liquid dominates over the elasticity of the copolymer.
Previously, we have focused on the optical spectra after the complete evaporation of liquids and the stabilization of the PSB signal. However, it would be interesting to monitor the dynamics of liquid evaporation and observe the evolution leading to the final color. The measurement of reflectance spectra of SPIs begins from the deformed state which was activated by water. In Figure 6A–C, the time-resolved reflection spectra of SPI-325 are shown for droplets of 0%, 60%, and 100% ethanol in water, respectively. During the first 50 s, SPI remains stable in the deformed state. When a droplet of the analyte contacts the surface of SPI, a reflection peak of about 20% appears due to the droplet's presence.
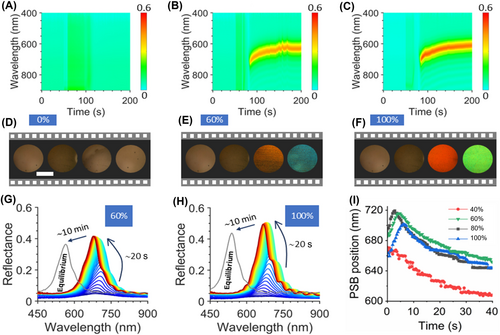
In Equation (4), nvoid is the refractive index of filling liquid; nSMPs ≈ 1.5 is the refractive index of our SPI-325 (calculation details could be found in the Supporting Information S1: Figure S7); and fSMPs = 0.26 is the volume fraction of SMPs in the inverse opal structure. The dependence of n on the composition of water-ethanol mixtures at 293 K is shown in Supporting Information S1: Figure S8. According to Equations (3) and (4) for 60% (n = 1.3625 at 20°C) [59], 80% (n = 1.3655 at 20°C) [59] and for 100% ethanol (n = 1.3614 at 20°C) [59], the redshifts of the stop bands would be 742.7, 743.9 and 742.3 nm, respectively. However, these values do not coincide with the maximum of the redshifts in all cases. This discrepancy suggests that compression of the macroporous structure still occurs during the evaporation of these solvents. This was confirmed when we tested our SPIs with other alcohols, which better restored the structure (see details in Section 3.4). The analysis of the evaporation process through the reflection spectra allows us to make the following conclusion: PSB shifts are influenced by simultaneous changes in the PC's lattice parameter and effective refractive indices. However, the final spectral position of the PSB is determined by the liquid's surface tension after their evaporation. Moreover, copolymer swelling causes the deformed macropores to temporarily recover their shape, creating additional negative pressure and absorbing more water to fill the enlarged space [58]. The larger the degree of deformation, the larger the neck angle (), which is a more minor scale effects that determine the fluid physics [66], such as capillary wetting and evaporation at the nanoscale [67, 68]. The larger neck angle facilitates water infiltration within the macropore [3].
3.4 Stability and Selectivity of the SPIs
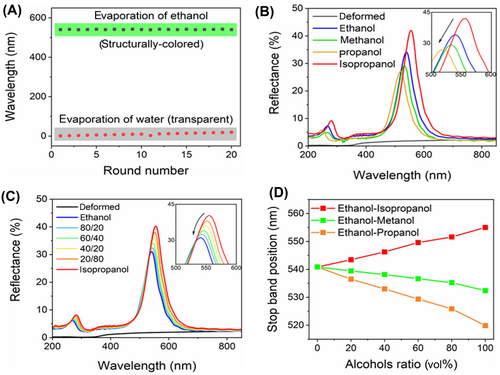
The SPIs showcase excellent physical stability. They quickly return to their original shape after ethanol evaporation and revert to their deformed state once water evaporates. Figure 7A shows that SPI-325 could be recovered and deformed over 20 times at room temperature. In addition, even after 10 months, their reflectance spectrum did not change much (Supporting Information S1: Figure S9). The SPIs also showed no changes in their physical properties. Our sensor operates based on changes in surface tension, giving it an advantage over refractometric sensors. Commonly used alcohols, such as methanol, propanol, and isopropanol, have similar refractive indices but significantly different surface tensions (see Supporting Information S1: Figure S10). This allows easy differentiation between various alcohols. In Figure 7B, the reflection spectra of SPI-325 after evaporation of various alcohols are shown. The inset highlights noticeable stop-band shifts resulting from differences in surface tensions. For instance, isopropanol, with the lowest surface tension (20.93 mN/m at 25°C) [59], restores the photonic structure from the deformed state most effectively, as evidenced by the intensity and shift of the stop band. In contrast, propanol, which has a higher surface tension (23.32 mN/m at 25°C) [59], does not fully restore the deformed structure. Investigating the properties of alcohol mixtures would provide valuable insights. Given the significant shift in the stop band between ethanol and isopropanol, we attempted to detect their mixture (see Figure 7C). Our observations indicate that when a small amount of isopropanol was added to ethanol, the reflectivity of the SPIs improves, that is, the stop band shifts to the red region and increases in intensity. This suggests that the surface tension decreases as the concentration of isopropanol in ethanol increases. The λmax of SPI-325 in mixed alcohol solutions was also studied in an ethanol solution with different amounts of other alcohols such as methanol and propanol (Figure 7D). When we mix ethanol with two types of alcohol—one with lower surface tension (isopropanol) and the other with higher surface tension (propanol), we can observe two distinct trends. In the case of isopropanol mixtures, we observe a redshift, while in propanol mixtures; there is a noticeable blue shift of the stop band. It means that the isopropanol mixture restores the photonic structure more effectively than the propanol mixture due to its lower surface tension. In ethanol-methanol mixtures, a moderate redshift in the PSB was observed as the concentration of methanol increased. Because these alcohols have similar surface tension (γ: 21.97 vs. 22.07 mN/m at 25°C) [59]. When the surface tension of liquids is similar, the contact angle of wetting probably begins to influence Laplace pressure. For instance, the contact angle for ethanol is ∼18°, while for methanol, it is ∼8° (see Supporting Information S1: Figure S11). However, certain compositions of methanol-isopropanol solutions could exhibit the same PSB signal as pure ethanol. Fortunately, these liquids did not damage or dissolve our sensors, making them suitable for use in a variety of media. The dry SPIs were stored in a desiccator with a continuous N2 flow (∼1 L/min) to avoid humidity fluctuations. We believe that increased humidity may lead to self-cold programming, which can cause structural deformation. Prolonged exposure to a deformed state could negatively affect the future restoration of the structure. Light availability, whether from lamps or natural sources, does not impact structural changes.
4 Conclusion
In summary, wearable SPIs are uniquely fabricated by bridging PCs with SMPs. Rubbery EOEOEA-co-PEGDA copolymers structured into inverse opal lattice initially exhibit bright structural colors. After the evaporation of water through their structure at room temperature, the SPIs can become transparent. The gradual recoloration mechanism of SPI is attributed to the change of surface tension of liquids, the elasticity of polymer, the shape memory effect, and light diffraction guided by PCs. The balance between the Laplace pressure created after evaporation and the elasticity of the copolymer dictates the detection range of SPIs for ethanol concentration. Varying the size of the macropores allow us to adjust the copolymer's sensitivity to a specific concentration range, effectively identifying ethanol-water mixtures with concentrations from 5% to 100%. The structures undergo fast and reversible changes in their structural colors and corresponding reflectance peaks in response to alcohol evaporation. The SPIs showcase high stability in alcohols, selectivity, and reversible structural transformations, enhancing their applicability across various fields. SPIs pave the way for intelligent colorimetric sensing of ethanol concentration. Furthermore, the developed SPIs could serve as a catalyst for fields such as information technology, inkless writing, and anticounterfeiting verification.
Acknowledgments
This study was supported by the Innovation Program for Quantum Science and Technology (2023ZD0300300), Foundation of China (XHD24A2401), Westlake University (102510036022301), and Key Laboratory for Quantum Materials of Zhejiang Province (10213004A092401). Authors are grateful to Prof. Alexey Kavokin for his supports during the initial stage of this study.
Conflicts of Interest
The authors declare no conflicts of interest.
Open Research
Data Availability Statement
The data that support the findings of this study are available from the corresponding authors upon reasonable request.


