Two-Dimensional Transition Metal Dichalcogenides Trigger Trained Immunity in Human Macrophages through Epigenetic and Metabolic Pathways
Abstract
Trained immunity is a recently described phenomenon whereby cells of the innate immune system undergo long-term epigenetic and/or metabolic reprogramming following a short-term interaction with microbes or microbial products. Here, it is shown that 2D transition metal dichalcogenides (TMDs) trigger trained immunity in primary human monocyte-derived macrophages. First, aqueous dispersions of 2D crystal formulations of MoS2 and WS2 are tested, and no cytotoxicity is found despite avid uptake of these materials by macrophages. However, when macrophages are pre-exposed to TMDs, followed by a resting period, this causes a marked modulation of immune-specific gene expression upon subsequent challenge with a microbial agent (i.e., bacterial lipopolysaccharides). Specifically, MoS2 triggers trained immunity through an epigenetic pathway insofar as the histone methyltransferase inhibitor methylthioadenosine reverses these effects. Furthermore, MoS2 triggers an elevation of cyclic adenosine monophosphate (cAMP) levels in macrophages and increased glycolysis is also evidenced in cells subjected to MoS2 training, pointing toward a metabolic rewiring of the cells. Importantly, it is observed that MoS2 triggers the upregulation of Mo-dependent enzymes in macrophages, thus confirming that Mo is bioavailable in these cells. In conclusion, MoS2 is identified as a novel inducer of trained immunity. Thus, TMDs could potentially be harnessed as immunomodulatory agents.
1 Introduction
Immunological memory is considered one of the defining features of the adaptive immune system, but activation of the innate immune system can also result in enhanced responses upon secondary challenges with microbes or microbial products. This process has been termed “trained immunity”.[1] Research in recent years has disclosed that the induction of trained immunity is shaped through epigenetic as well as metabolic reprogramming. Trained immunity explains the heterologous effects of vaccines, and the anti-cancer effect of the bacillus Calmette–Guérin (BCG) vaccine, but trained immunity is potentially maladaptive in the context of chronic inflammation.[2]
The fungal cell wall component β-glucan was one of the first described inducers of trained immunity.[1] Hence, microbial structures including β-glucan as well as certain live attenuated vaccines like BCG can boost antimicrobial function in myeloid cells by eliciting trained immunity. Indeed, it was recently suggested that the BCG vaccine or other live attenuated vaccines could play a role in controlling the COVID-19 pandemic.[3]
2D materials including the graphene-based materials (GBMs) have been studied extensively in recent years with respect to their potential impact on human health and the environment.[4] Moreover, emerging classes of 2D materials beyond graphene, including hexagonal boron nitride (also known as white graphene) and the family of transition metal dichalcogenides (TMDs), are also under close scrutiny.[5, 6] We and others have studied the interactions of graphene oxide (GO) and other GBMs with human and murine macrophages,[7-9] and a couple of reports are available on the potential impact of TMDs including MoS2 and WS2 on macrophages.[10-12] Surface functionalization profoundly affects the interactions of GO with immune cells.[13] Overall, however, GO was not found to be remarkably cytotoxic, and MoS2 and WS2 were shown in several recent studies to be fairly innocuous, unless the materials were applied at excessively high doses (i.e., 200 µg mL−1).[14] However, the preparation method and the physicochemical properties may certainly influence the outcome. For reduced GO and graphene, variable results have been reported with respect to cytotoxicity toward macrophages and other cells (reviewed in ref. [4]). Interestingly, a recent study provided evidence of trained immunity in murine bone marrow-derived macrophages exposed to “pristine” graphene exfoliated in endotoxin-free bovine serum albumin.[15] The latter study thus furnished an example of a non-microbial trigger of trained immunity. Interestingly, graphene flakes exfoliated in human serum tend to adsorb apolipoprotein A-1, and this was suggested to mediate the interactions of graphene with scavenger receptors on the surface of the human embryonic kidney cell line HEK-293T.[16] However, it remains unknown whether these ligand-receptor interactions play a role for the induction of trained immunity. Furthermore, there are no studies on other 2D materials and trained immunity. Here, we addressed the impact of TMDs previously shown to be biocompatible with respect to human lung (A549) and skin (HaCaT) cell lines[17] with respect to macrophage responses, and we asked whether TMDs triggered trained immunity. Using a PCR-based gene array, we monitored cells for expression of 84 common immune-related genes following a typical trained immunity protocol. The results were validated by enzyme-linked immunosorbent assays. We also assessed the role of epigenetic and metabolic reprogramming, and the role of cyclic adenosine monophosphate (cAMP) signaling. Our results shed new light on the interactions between transition metal-based 2D materials and the immune system.
2 Results
2.1 Characterization of 2D TMDs MoS2 and WS2
Water-based, stable, and defect-free 2D material dispersions were produced by liquid-phase exfoliation, using 1-pyrenesulfonic acid sodium salt as exfoliating agent (for details, refer to ref. [17]) (Figure S1A, Supporting Information). The materials have been fully characterized in previous studies.[17, 18] Representative Raman spectra and atomic force microscopy (AFM) data showing the lateral dimensions and height of the exfoliated nano-sheets are shown in Figure S1B–E, Supporting Information. Hence, the lateral size measured by AFM is ≈40 nm for MoS2 and ≈50 nm for WS2, while the average thickness is between 4 and 7 nm. Assuming a thickness of 1–1.5 nm for a single layer, and taking into account the adsorbed stabilizer on both sides of the nano-sheet,[19] the average number of layers is between 3 and 7. The use of endotoxin-free test materials is a prerequisite for any study using immune-competent cells. Both TMDs were found to be endotoxin-free using the TNF-α expression test (TET) (data not shown). The latter assay using human macrophages[20] circumvents the potential problem of assay interference that is observed when applying the conventional Limulus amebocyte lysate assay to GBMs.
2.2 Primary Human Macrophages Ingest TMDs
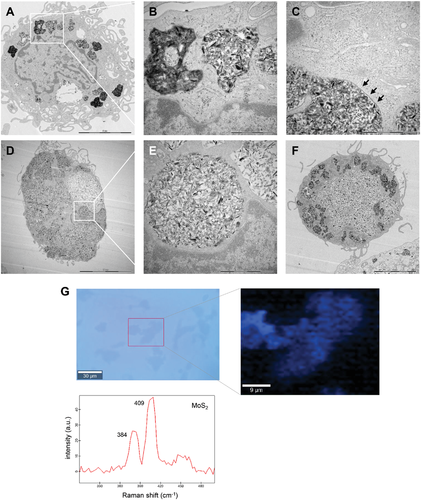
We exposed primary human monocyte-derived macrophages (HMDMs) to the 2D TMDs for 24 h and determined cellular uptake by transmission electron microscopy (TEM). The TMDs (25 µg mL−1) were readily internalized without ultrastructural signs of cell death. Specifically, WS2 nano-sheets were present in the cells as discrete, membrane-enclosed bundles (Figure 1A,B), with a clear demarcation between the foreign material and the cytosol (Figure 1C). We also noted abundant uptake of the MoS2 nano-sheets (Figure 1D,E). In some cases, the cells seemed to be entirely filled with MoS2 (Figure 1F). The latter is somewhat reminiscent of “cell-drinking” (i.e., macropinocytosis), an endocytic mechanism normally involved in fluid uptake.[21] To corroborate these findings, we performed Raman spectroscopy on macrophages after incubation for 24 h with MoS2 (25 µg mL−1) (Figure 1G). As a reference, Raman mapping was also conducted on the MoS2 nano-sheets deposited on a silicon substrate (Figure S2A,B, Supporting Information). The MoS2 nano-sheets displayed characteristic Raman spectra consistent with previous reports,[22] and the same characteristic spectrum was detected in cells following Raman mapping of sonicated samples (Figure S3, Supporting Information) and in intact cells (Figure 1G). Furthermore, to quantify the uptake of MoS2, we applied ICP-MS. To this end, cells were exposed for 2 h to MoS2 (25 µg mL−1) and an equimolar concentration of sodium molybdate (Na2MoO4). To gauge the potential role of actin-dependent uptake mechanisms, cells were preincubated with cytochalasin D (10 µg mL−1). As shown in Figure S4A, Supporting Information, significant uptake of MoS2 occurred which was partially reduced in the presence of cytochalasin D. However, no uptake of Mo was observed in macrophages exposed to Na2MoO4. The Mo fraction in the extracellular medium is shown in Figure S4B, Supporting Information.
2.3 No Cytotoxicity or Pro-Inflammatory Responses
To confirm the biocompatibility of the TMDs, we performed a cell viability test in which macrophages were exposed for 24 h to the 2D materials at a range of concentrations (1–100 µg mL−1). The cells were maintained in standard cell culture medium supplemented with 10% fetal bovine serum (FBS). Cell surface markers were analyzed to confirm the macrophage identity of the cells (Figure S5A,B, Supporting Information). We did not record any cytotoxicity for any of the materials tested, as evidenced by using the lactate dehydrogenase (LDH) release assay (Figure S6A,B, Supporting Information). Next, we exposed macrophages to the 2D materials for 24 h at 25 µg mL−1 and collected the cell supernatants for cytokine and chemokine profiling. To this end, we applied multi-plex assays for the detection of cytokines (IFN-γ, IL-1β, IL-2, IL-4, IL-6, IL-8, IL-10, IL-12p70, IL-13, and TNF-α) and chemokines (Eotaxin, Eotaxin-2, Eotaxin-3, IL-8, IP-10, MCP-1, MCP-2, MCP-3, MCP-4, MDC, MIP-1α, MIP-1β, and TARC). LPS (0.1 µg mL−1) was included as a positive control. Overall, the responses elicited by the 2D materials were very modest. The expression of selected cytokines (IL-1β, IL-6, IL-10, and TNF-α) is shown in Figure S7A, Supporting Information. The positive control (LPS) triggered macrophage production of all four cytokines. The 2D materials elicited a minor albeit non-significant effect on IL-10 and TNF-α (Figure S7B, Supporting Information). This effect was not prevented by polymyxin B (10 µm) demonstrating that the effect was not due to endotoxin contamination of the 2D materials (data not shown). Overall, the 2D materials were found to be non-cytotoxic toward primary human macrophages and did not provoke significant pro-inflammatory effects in these cells.
2.4 TMDs are Novel Inducers of Trained Immunity
Given the fact that the 2D materials failed to trigger acute effects, we then asked whether any long-term effects might occur. Specifically, we sought to address whether 2D materials are capable of triggering trained immunity, potentially through epigenetic and/or metabolic reprogramming of the cells. Recent work has shown that graphene can “train” bone marrow-derived macrophages.[15] Therefore, we focused our attention on the two TMDs, WS2 and MoS2. The most common in vitro model system of trained immunity is the training of human peripheral monocytes, in which the cells are exposed to a stimulus (training period) for a short period of time, typically 24 h.[1] The cells are then incubated for 5–7 days in cell medium without further stimulation. This is known as the resting period. If the initial training stimulus (for instance, β-glucan) has evoked epigenetic rewiring of the cells, a heightened response to secondary stimuli will occur.[1] We adopted the same protocol, but we differentiated the monocytes to macrophages first, to ensure that the cells would be capable of ingesting the 2D materials. Then, cells were exposed to WS2 or MoS2 (or β-glucan) for 24 h (Figure 2A). The exposure medium was then removed and cells were washed with phosphate-buffered saline (PBS) and maintained in cell medium for 5 days. The cell medium was replenished after 3 days. The cells were then challenged with bacterial LPS (50 ng mL−1) for 24 h. Our pilot studies showed that if the cells were challenged with a higher concentration of LPS (100 ng mL−1), this resulted in a dampening of cytokine responses (data not shown). This phenomenon—known as immune “tolerance”—is well described for LPS.[1]
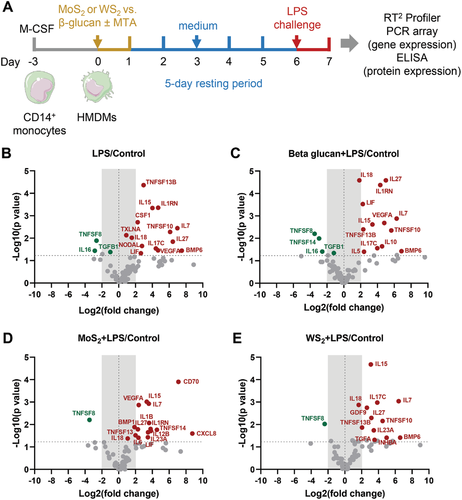
To evaluate whether TMDs induced trained immunity, we performed pathway-focused gene expression profiling by using qRT-PCR. To this end, we applied the RT2 Profiler PCR Array System covering 84 common human cytokine genes, as described in the Experimental Section (and refer to Table S1, Supporting Information for a complete list of genes). The experiment was performed using HMDMs from three different adult donors. The gene expression in each group was first normalized to untreated controls (Figure 2B–E). Significantly up- and downregulated genes are marked in red and green, respectively. Based on the fold regulation of gene expression in LPS, β-glucan, MoS2, and WS2 pre-treated groups compared to untreated controls, CXCL8 was found to be the most strongly upregulated gene in the panel although the changes were not significant; this appeared to be an LPS effect and not due to trained immunity, as the same response was seen in LPS-challenged samples without prior training (data not shown). Moreover, TNSF8 (encoding CD30 ligand) was found to be significantly downregulated in all the groups while IL15 was upregulated in all the groups, again suggesting that this could be an effect of LPS (Figure 2B–E). However, several other gene expression changes were noted indicating that cells primed with β-glucan, MoS2, and WS2 responded differently to re-challenge with LPS. It is notable that CD70 displayed one of the highest fold changes (fold change = 138, p = 0.0001) in the MoS2 pre-treated group compared to untreated controls (Figure 2D). This upregulation of CD70 expression was not seen for the β-glucan and WS2 pre-treated groups.
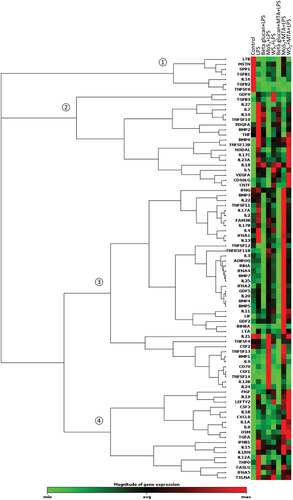
To provide an overview of the gene expression results, we performed non-supervised hierarchical clustering analysis (Figure 3). We identified four main nodes defined largely by gene expression changes occurring in 1) control (untreated) samples, 2) β-glucan-trained samples, 3) MoS2 pre-exposed samples, and 4) WS2 pre-exposed samples. Interestingly, the node that is defined by MoS2-induced gene expression changes could, in turn, be divided into two main nodes or clusters of genes of which one is defined by genes (including CD70 and TNFSF14) that are upregulated in cells trained with MoS2 followed by re-challenge with LPS, while the other is defined by genes such as INHBA that are upregulated in cells pre-exposed to MoS2 in the presence of the histone methyltransferase inhibitor methylthioadenosine (MTA) (discussed below). Overall, the results showed that pre-exposure of macrophages to TMDs did not simply mimic the effect of β-glucan, a known trigger of trained immunity. Moreover, the effects of MoS2 and WS2 (followed by re-challenge with LPS) on gene expression were not identical.
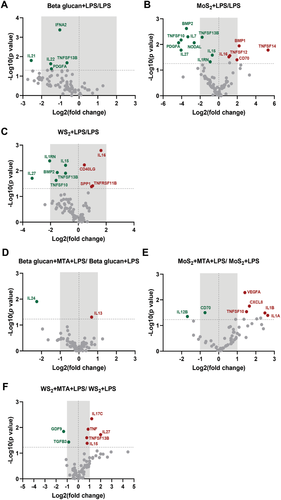
The gene expression changes in β-glucan, MoS2, and WS2 pre-treated groups compared to LPS-challenged samples (without any prior training) are shown as volcano plots in Figure 4A–C. Significantly up- and downregulated genes are marked in red and green, respectively. We observed several significant changes including upregulation of CD70 in cells trained with MoS2 followed by re-challenge with LPS (versus control samples) (Figure 4B). Additionally, a pronounced upregulation of TNFSF14 (encoding LIGHT) in MoS2 pre-treated samples, and a downregulation of IL27 in both MoS2 and WS2 pre-treated samples (versus cells treated with LPS only) was noted (Figure 4B,C). These gene expression changes were not seen in the β-glucan trained samples (Figure 4A). Thus, TMDs were found to trigger trained immunity as shown by the gene expression changes in response to re-challenge with a low dose of LPS.
2.5 Role of Epigenetic Events in Trained Immunity
Trained immunity evoked by exogenous (β-glucan) and endogenous agents (oxidized low-density lipoprotein) has been suggested to be mediated through epigenetic mechanisms.[23, 24] To understand whether the effects triggered by TMDs were due to epigenetic regulation, we applied the histone methyltransferase inhibitor MTA (Figure 2A). Thus, macrophages were pre-incubated with MTA prior to exposure to β-glucan, MoS2, and WS2 for 24 h. Then, cells were rested for 5 days and collected after restimulation with LPS for 24 h for analysis using the RT2 Profiler PCR Array System, as described above. The results of the gene expression analysis in β-glucan or TMD-trained groups with or without MTA are shown as volcano plots in Figure 4D–F. Only genes with statistically significant changes are plotted, and up- and downregulated genes are marked in red and green, respectively. MTA was found to impact on the expression of IL24 in β-glucan trained samples. Moreover, the expression of CD70 was upregulated in MoS2 trained samples (Figure 4B), and this effect was reversed by pre-exposure to MTA (Figure 4E), indicating that this gene was subject to epigenetic regulation. Conversely, the expression of IL27 was downregulated in WS2 trained samples (Figure 4C), and this, in turn, was reversed by MTA (Figure 4F). To validate the PCR array results, the release of cytokines following trained immunity using macrophages from three individual donors (Figure 2A) was determined by ELISA. The cytokines were selected on the basis of fold regulation of gene expression. CD70 (also known as CD27 ligand) was produced in cells trained with β-glucan and MoS2 and this effect was reversed by MTA (Figure S8A, Supporting Information). Furthermore, LIGHT (TNFSF14) was induced in cells trained with MoS2 and this was reduced in the presence of MTA (Figure S8B), Supporting Information, while CSF-1 was induced in MoS2-trained cells, but the effect of MTA was not significant (Figure S8C, Supporting Information). We also investigated genes which were shown to be downregulated in MoS2 and WS2 trained cells and could verify that IL-27 was downregulated in both MoS2 and WS2 trained cells, in accordance with the gene expression results (Figure S8D, Supporting Information). We also investigated activin A (encoded by INHBA) as INHBA was shown to be upregulated 165-fold in MoS2-exposed cells versus untreated cells. We could thus confirm that MoS2 triggered the secretion of activin A while MTA caused MoS2-trained cells to re-express activin A (Figure S8E, Supporting Information), in line with the PCR array results. Collectively, MoS2 and WS2 were found to induce trained immunity in human macrophages, with evidence for epigenetic regulation of gene expression.
2.6 Bioavailability of Molybdenum in Macrophages
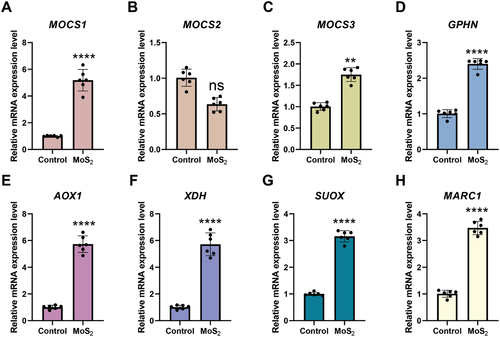
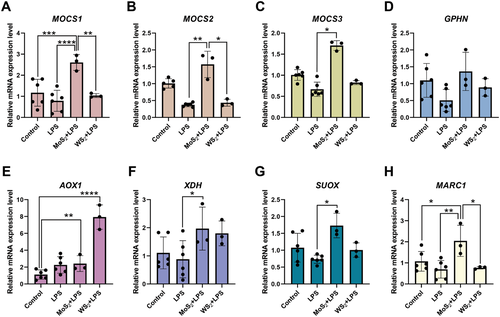
Unlike tungsten (W), molybdenum (Mo) is an essential trace element that is bioavailable as molybdate (MoO42−). There are four mammalian Mo-dependent enzymes, each one harboring a Mo cofactor (Moco) in its active site.[25] Cao et al.[26] reported in a recent study that the biotransformation of MoS2 nanodots in mice leads to incorporation of Mo into Mo enzymes, thereby increasing the activities of aldehyde oxidase and xanthine oxidoreductase in the liver. The authors used X-ray absorption near-edge spectroscopy to show that MoS2 was oxidized in the liver, with molybdenum being chemically transformed from Mo(IV) to Mo(VI).[26] To assess the bioavailability of Mo in macrophages, we determined the expression of the MOCS1, MOCS2, MOCS3, and GPHN genes involved in the Moco biosynthetic pathway by RT-qPCR in macrophages that were exposed to MoS2 for 24 h. We found that MoS2 triggered the upregulation of MOCS1, MOCS3, and GPHN mRNA while MOCS2 was not significantly affected (Figure 5A–D). Furthermore, we studied the expression of the four mammalian Mo-dependent enzymes, AOX1, XDH, SUOX, and MARC1. We found that all four genes were significantly induced by MoS2 (Figure 5E–H). This suggests that Mo is bioavailable upon uptake of MoS2 (cf. Figure 1; Figure S4, Supporting Information). For comparison, we also studied the expression of genes involved in the Moco biosynthetic pathway and the genes encoding the Mo-dependent enzymes following the trained immunity protocol described in Figure 2A. Here, we compared the outcome of exposure to MoS2 and WS2 followed by re-challenge with LPS (50 ng mL−1) versus LPS alone without any prior “training” of the cells. MoS2, but not WS2, triggered the upregulation of MOCS1, MOCS2, and MOCS3 mRNA (Figure 6A–C). GPHN was not significantly affected (Figure 6D). Furthermore, AOX1 was induced in cells pre-exposed to WS2 while XDH, SUOX, and MARC1 were all induced in cells pre-exposed to MoS2 (Figure 6E–H). MARC2 was not affected (data not shown). We also monitored the expression of genes involved in the Moco biosynthetic pathway as well as genes encoding Mo-dependent enzymes following a trained immunity protocol in which cells were first exposed to Na2MoO4 then rested for 5 days and re-challenged with LPS, but no changes were noted (data not shown).
2.7 Role of cAMP Signaling in Macrophages
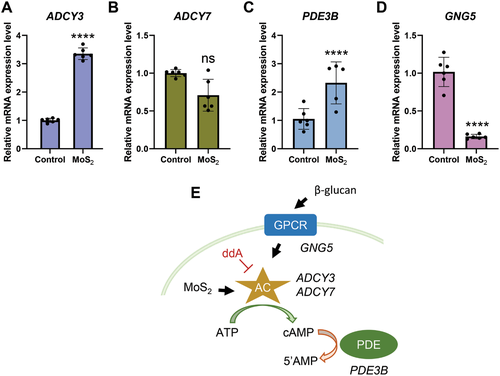
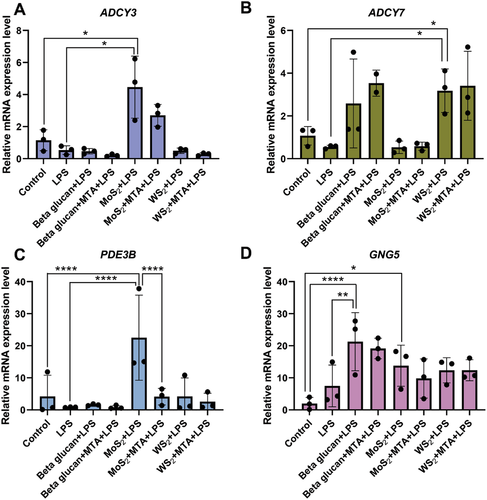
Recent work has shown that the inhibition of cAMP generation blocked trained immunity induced by β-glucan in vitro and prevented the protective effects of trained immunity in vivo in a model of Candida albicans infection.[27] Interestingly, molybdate (but not chromate or tungstate) was previously shown to activate adenylate cyclase in rat liver plasma membranes, though the mechanism remained obscure.[28] Nevertheless, this prompted us to investigate the possible impact of MoS2 on the cAMP pathway. To this end, we determined the gene expression of key enzymes involved in cAMP signaling as well as intracellular cAMP levels. We first investigated the expression of ADCY3 and ADCY7 encoding different isoforms of adenylate cyclase,[27] as well as PDE3B (encoding the cAMP-degrading phosphodiesterase) and GNG5 (encoding the G-protein gamma 5 subunit that is involved in cAMP signaling). MoS2 was found to significantly induce the expression of ADCY3 (but not ADCY7) and PDE3B while GNG5 expression was downregulated following exposure for 24 h (Figure 7A–D). Moreover, MoS2 exposure resulted in a significant, dose-dependent increase of intracellular cAMP levels in macrophages (Figure S9, Supporting Information). Importantly, the specific inhibitor of adenylate cyclase, 2′5′-dideoxyadenosine (ddA),[27] suppressed the induction of cAMP, indicating that MoS2 was acting directly on adenylate cyclase in cells. We then asked whether MoS2 affected the cAMP signaling pathway in “trained” macrophages. Indeed, a significant upregulation of ADCY3 (but not ADCY7) and PDE3B was observed in MoS2-trained cells, but not in WS2-trained cells (Figure 8A–C). The expression of GNG5 was not affected by TMDs but was significantly upregulated in the β-glucan-trained macrophages when compared to LPS alone (Figure 8D). It is also notable that MTA reversed the effects of MoS2 on cAMP signaling genes, indicating an interplay between the epigenetic and metabolic pathways in MoS2-trained cells. Taken together, these findings provide evidence that MoS2 is rendered bioavailable upon uptake and that MoS2 exerts effects on cAMP signaling in macrophages (refer to schematic in Figure 7E).
2.8 Evidence for a Role of Metabolic Signaling
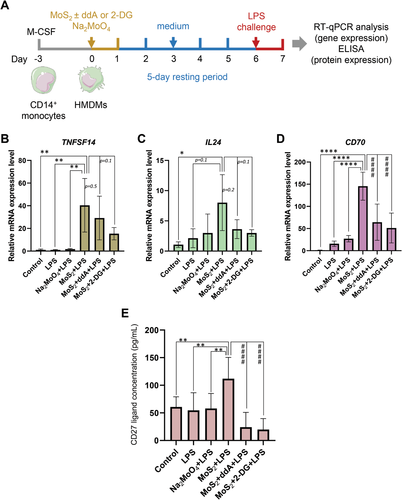
It is well established that increased glycolysis is a hallmark of β-glucan-trained monocytes[29] and that BCG induction of trained immunity of monocytes also is accompanied by a strong increase in glycolysis.[30] We therefore decided to address whether trained immunity triggered by MoS2 also involved glycolysis. We used the same trained immunity protocol as before, but instead of comparing MoS2 with WS2, we included soluble molybdate ions (Na2MoO4) as a control (Figure 9A). The experiment was performed using primary human macrophages from three independent donors. To address whether cAMP signaling or glycolysis contributed to trained immunity, the training process was conducted in the presence or absence of the adenylate cyclase inhibitor ddA and 2-deoxy-D-glucose (2-DG), respectively. We monitored trained immunity by RT-qPCR analysis of genes selected on the basis of the previous PCR array results. We could show that MoS2-trained cells displayed a significant upregulation of TNFSF14, IL24, and CD70 upon re-challenge with LPS (Figure 9B–D). Notably, these effects were reversed in the presence of ddA and 2-DG, and the most significant effects were observed for CD70 (Figure 9D). For comparison, the soluble molybdate ions did not exert any significant effects on the selected genes. Finally, we monitored the production of CD27 ligand (encoded by CD70) using an ELISA. We found that MoS2-trained cells secreted CD27 ligand and that this was abrogated in the presence of ddA and 2-DG, thus validating the PCR results (Figure 9E).
3 Discussion
Using a well-established trained immunity protocol, we showed herein that 2D TMDs elicit trained immunity in primary human macrophages. We also provided evidence for a role of epigenetic and metabolic signaling in macrophages trained with 2D nano-sheets of MoS2, in accordance with previous studies on trained immunity elicited by microorganisms and microbial products or endogenous factors such as oxidized low-density lipoprotein and heme.[23, 24, 29-31] Furthermore, we showed that MoS2 acts on the cAMP signaling pathway which, in turn, was found to contribute to the trained immunity response. The latter findings are in line with the important role of cAMP-dependent signaling for the protective effects of trained immunity in a mouse model of disseminated candidiasis.[27] The fact that the 2D TMDs are capable of eliciting trained immunity in HMDMs thus expands the repertoire of biocompatible, exogenous agents that evoke “memory” responses in cells of the innate immune system.[1] It should not come as a surprise that metals exert biologically relevant activities. Indeed, aluminum salts (“alum”) remain the most commonly used adjuvants for human vaccines,[32] while manganese salts were also shown to act as adjuvants.[33] The present study suggests that Mo-containing nanoparticles (i.e., 2D nano-sheets) may also evoke relevant effects in innate immune cells and further studies using in vivo (animal) models are required to assess whether this could be harnessed in the clinical setting.
The 2D materials tested here were previously shown to display excellent biocompatibility toward human cell lines,[17] and the present results confirmed that the materials were non-cytotoxic toward primary human macrophages up to 100 µg mL−1 (however, all subsequent trained immunity experiments were conducted at 25 µg mL−1). The TMDs were prepared using a pyrene-assisted exfoliation method.[19] However, while the amount of pyrene adsorbed cannot be easily quantified as there is also a small amount of free pyrene in water, it did not impart any toxicity to the 2D inks. We also documented cellular uptake of the 2D materials as shown by TEM and confirmed by Raman confocal mapping as well as ICP-MS (for the MoS2 nano-sheets). Several previous studies have addressed the uptake of 2D materials such as GO using primary macrophages or macrophage-like cell lines, but with divergent results. Hence, some authors have suggested that macrophages are capable of internalizing mainly small GO sheets (i.e., with submicron lateral dimensions) while large GO sheets were shown to align with the cell surface (the so-called cell “masking” effect).[34] However, we and others have reported size-independent uptake of GO by HMDMs[8] and mouse peritoneal macrophages,[35] testifying to the fact that the latter cells are, indeed, professional phagocytes. On the other hand, cell surface interactions of GO (especially GO sheets with large lateral dimensions) have been documented in primary human neutrophils.[36] Using a panel of different cell lines, Linares et al.[37] found that macropinocytosis seemed to be a general internalization mechanism with respect to PEGylated GO. Less is known regarding the uptake of so-called “post-graphene” materials, but Zhu et al.[38] provided evidence that MoS2 nano-sheets are internalized through a combination of clathrin-dependent, caveolin-dependent, and macropinocytosis pathways, with caveolae-dependent endocytosis being the predominant mechanism. The latter study was performed using non-phagocytic cancer cell lines. Kurapati et al.[10] found that MoS2 nano-sheets were readily taken up by cancer cells (HeLa) as well as HMDMs. The present study confirmed that macrophages readily internalized MoS2 and WS2, and we found that cytochalasin D partially reduced the uptake of MoS2, suggesting an actin-dependent mechanism of uptake (phagocytosis or macropinocytosis) (refer to ref. [21]:). It is noted that we used M-CSF-stimulated (M2-like) human macrophages and these cells are known to be more prone to engulf nanomaterials than M1-polarized cells.[39, 40]
Using ICP-MS, we compared the cellular content of Mo in macrophages exposed to MoS2 and Na2MoO4. Thus, while we could confirm the uptake of MoS2, we did not detect a significant increase of intracellular Mo in cells exposed to the soluble salt. This, however, does not imply that macrophages are unable to take up physiological amounts (i.e., ppb) of Mo. It is commonly assumed that Mo is taken up by cells as molybdate, and Mo transporters have been characterized in the photosynthetic eukaryotes Arabidopsis and Chlamydomonas, but the nature of this transporter in humans is unknown, and the exact mechanism of Mo uptake remains to be clarified.[41, 42] The present study thus serves as an example of the so-called Trojan horse effect whereby a nanomaterial is taken up cells leading to a large intracellular “dose” of metal ions. This phenomenon is well described for other metal-based nanomaterials including Ag and CuO nanoparticles.[43, 44] It is important to point out that we have shown here that MoS2 is bioavailable following uptake of the 2D nano-sheets by macrophages, as proven by the upregulation of genes encoding Mo-dependent enzymes and genes involved in the Moco biosynthetic pathway. This is in accordance with a recent study on MoS2 nanodots complexed with albumin which were found to be internalized in liver cells after i.v. injection in mice leading to the activation of Mo-dependent enzymes.[26] It is also notable that while the MoS2 was found to trigger trained immunity, the soluble salt Na2MoO4 failed to do so, in line with the Trojan horse effect.
The effects of MoS2 were, overall, more pronounced when compared to WS2. Moreover, in cells trained with WS2, no changes were observed in genes involved in the Moco biosynthetic pathway, thus confirming that the changes in the latter pathway were specific for Mo. Indeed, while some prokaryotes are known to utilize tungsten (W), there is no known role for W in mammalian cells. On the other hand, we observed a significant increase in one of the four genes encoding Mo-dependent enzymes namely AOX1 in WS2-trained macrophages that had been challenged with LPS when compared to LPS alone. It is worth noting that W is utilized in enzymes within the aldehyde:ferredoxin oxidoreductase (AOR) family and in some other enzymes in the molybdoprotein family in certain prokaryotes including hyperthermophilic archaea. Indeed, molybdenum and tungsten enzymes show common structural features, with the metal being bound by the molybdopterin cofactor (aka Moco).[25] Further work to study whether W under certain conditions could displace Mo in mammalian cells may thus be of interest. Again, it is noted that the “delivery” of Mo or W into cells by way of a 2D material circumvents the need for a specific transporter for molybdate or tungstate ions.
Overall, 2D TMDs do not seem to exert strong cytotoxic effects using different cell lines.[45, 46] However, the type of exfoliating agent and their surface modifications may play an important role.[47, 48] Wang et al.[46] showed that aggregated MoS2 induced significant levels of pro-inflammatory cytokines including TNF-α and IL-1β in human lung-derived cells (BEAS-2B) and monocyte-macrophage-like cells (THP-1), while the effects were less pronounced for 2D MoS2 (i.e., MoS2 chemically exfoliated by lithium ion intercalation, or dispersed with the aid of the block copolymer, Pluronic F87). In the present study, we showed that the 2D materials exfoliated with 1-pyrenesulfonic acid sodium salt were endotoxin-free and did not trigger pro-inflammatory cytokine responses in primary human macrophages. It is important, however, to address not only acute responses but also to consider the possibility of long-term effects of 2D materials,[49] which is why we decided to explore trained immunity responses in the TMD-exposed macrophages. To this end, we performed pathway-focused gene expression profiling by real-time PCR, and we could show that MoS2 and WS2 elicited trained immunity in human macrophages. Interestingly, the genes affected by MoS2 and WS2 showed little overlap, and the positive control β-glucan also appeared to affect a different set of genes. Thus, while all the studied trained immunity inducers were shown to be affected by MTA, suggesting a role for epigenetic signaling, it is possible that TMDs and β-glucan affected different promoter regions (of cytokine genes). Next generation sequencing approaches including CHiP-seq (to identify binding sites for transcription factors and other proteins) and ATAC-seq (to study chromatin accessibility) may prove very useful in order to verify any epigenetic impact of the TMDs. We also provided evidence for a role of metabolic rewiring, based on the use of the glycolysis inhibitor, 2-DG. Overall, there appears to be an interplay between epigenetic and metabolic pathways in trained immunity.[2] Previous studies have shown that glycolysis is upregulated in β-glucan-trained monocytes,[29] and that metabolites from the latter pathway may act as co-factors for histone methyltransferases,[50] thus providing a potential mechanism for the integration of metabolic pathways and epigenetic reprogramming. Notably, we also provided evidence that MoS2 affected cAMP signaling insofar as the adenylate cyclase inhibitor ddA reversed the MoS2-trained responses. Furthermore, we could show that MoS2 activated adenylate cyclase in macrophages, and this was partially reversed by ddA, suggesting a direct effect on this key enzyme. We believe that these effects are due to the fact that Mo becomes bioavailable following the uptake of MoS2 (as shown in ref. [26] and the present study). However, it is possible that intrinsic enzyme-mimetic activities of MoS2 nano-sheets also come into play. Indeed, previous work implied that MoS2 possesses radical scavenging activities,[51] and a recent study published during the preparation of the present manuscript confirmed some but not all of these enzyme-mimetic properties.[52] At any rate, we may conclude that while MoS2 nano-sheets are non-toxic, they are not inert.
Our pathway-focused gene expression profiling allowed us to go beyond the most commonly studied genes such as IL-6, TNF-α, and IL-1β, which have all been shown to be upregulated in trained immunity, and IL-10, which has been found to be downregulated.[15] In fact, we identified several novel genes not previously known to be affected during trained immunity and we provided evidence that these genes were subject to epigenetic regulation. Hence, INHBA (encoding activin A) was upregulated 165-fold and CD70 (CD27 ligand) was upregulated 138-fold in cells trained with MoS2 followed by a re-challenge with LPS. We also observed a 40-fold upregulation of TNFSF14 (encoding LIGHT). Furthermore, a downregulation of IL27 was noted in both MoS2 and WS2-trained cells in response to LPS (i.e., almost 18-fold and almost 10-fold, respectively). Importantly, these findings were borne out at the protein expression level. We could also show that CD70 was under metabolic regulation, and this, too, was validated at the protein level. Hence, the present study identified CD70 (CD27 ligand) as a novel and robust marker of trained immunity evoked by 2D nano-sheets of MoS2. Activin A, a member of the TGF-β superfamily, was initially identified as a regulator of reproductive physiology. However, activin A also exerts a broad range of pro- and/or anti-inflammatory functions on innate immune cells, including macrophages, dendritic cells (DCs), and neutrophils, depending on the activation and maturation status of the cells.[53] LIGHT (TNFSF14), a member of the TNF superfamily,[54] was previously shown to be an essential mediator of airway fibrosis in a mouse model of asthma.[55] This is relevant as trained immunity has also been implicated in autoimmune and chronic inflammatory fibrotic disorders. Hence, in a recent study, low-dose LPS training was found to alleviate fibrosis in a mouse model of systemic sclerosis, whereas BCG-training exacerbated disease in this model.[56] It is tempting to speculate that LIGHT could also play a role in this context. However, LIGHT has also been invoked as a potential target in anti-tumor immunity.[57] IL-27, in turn, is an immunomodulatory cytokine that belongs to the IL-12 family and is known to curb T cell responses.[58] It is important to keep in mind that while macrophages are critical mediators of tissue homeostasis, they also orchestrate adaptive immune responses and control T cell immunity.[59] CD70 (CD27 ligand) is a so-called co-stimulatory molecule and a member of the TNF superfamily. Co-stimulatory molecules act to amplify or counteract the initial activating signals provided to T cells through the T cell receptor. The interaction of CD70 with its cognate receptor CD27 is required for generation and long-term maintenance of T cell immunity.[60] It is therefore of considerable interest that MoS2-trained macrophages upregulated and secreted CD70.
4 Conclusions
Considerable efforts have been invested to address the biological interactions of GBMs[4] and several other 2D materials are now coming to the fore including the TMDs.[61] The present study has demonstrated for the first time that MoS2 elicits trained immunity in macrophages. Furthermore, we showed that epigenetic and metabolic pathways are engaged in MoS2-trained cells and that cAMP signaling is involved. Our results also showed that Mo becomes bioavailable in macrophages that have taken up the MoS2 nanosheets as evidenced by the induction of Mo-dependent genes. Notably, the 2D materials were endotoxin-free and were found to be non-cytotoxic. Taken together, these findings open up new possibilities for the rational design of 2D materials such as MoS2 for biomedical applications. In fact, trained immunity may be a viable approach by which to achieve long-term therapeutic benefits in a host of immune-related human diseases.[62] Trained immunity using β-glucan, the most abundant building block of the fungal cell wall, was shown to confer an anti-tumor phenotype,[63] and in another recent study, so-called “nano-biologics” were shown to trigger anti-tumor effects resulting from epigenetic rewiring of bone marrow progenitors to overcome the immunosuppressive tumor microenvironment in a mouse model of melanoma.[64] The latter entities were generated from natural carrier molecules (phospholipids, cholesterol, and apolipoprotein A-1) functionalized with peptidoglycans which served as the actual triggers of trained immunity.[64] In contrast, we found that MoS2 could “train” macrophages without the need for functionalization, suggesting that transition metal-based 2D materials may be added to the arsenal of trained immunity triggers.
5 Experimental Section
Preparation of 2D Materials
Aqueous 2D crystal dispersions were prepared via liquid-phase exfoliation in water, following the methodology developed in ref. [17]. This approach was based on non-covalent functionalization of the nano-sheet, thus producing defect-free crystals, with surface chemistry determined by the type of stabilizer used.[65, 66] Briefly, bulk molybdenum (IV) sulfide powder (2 µm), bulk tungsten (IV) sulfide powder (2 µm), and 1-pyrenesulfonic acid sodium salt (PS1) were all purchased from Sigma Aldrich. For the preparation of the dispersions, 300 mg of bulk crystal powder was added to 100 mL of de-ionized water, in which 50 mg of PS1 was previously dissolved. The mixture was then sonicated at 600 W for 7 days using a Hilsonic bath sonicator. Subsequently, un-exfoliated bulk material was removed by centrifuging the solution at 3500 rpm for 20 min and then collecting the supernatant containing well-dispersed nano-sheets in water. The excess pyrene molecules were removed by a two-step centrifugation at 15 000 rpm for 60 min. After each centrifugation step, the supernatant was removed, and the sediment was re-dispersed in de-ionized water. To increase the concentration, a smaller volume of water was added after the last centrifugation. The final concentration of nano-sheets in the dispersion was determined by UV–vis spectroscopy[67] using a Perkin-Elmer l-900 UV–vis–NIR spectrophotometer. The nano-sheets were characterized by AFM and Raman spectroscopy as previously reported.[18, 19] Sodium molybdate (Na2MoO4) (CAS number: 7631-95-0) was purchased from Sigma. The stock solution was prepared at a concentration of 1.280 mg mL−1 (i.e., the equivalent amount of Mo present in 1 mg mL−1 MoS2) in endotoxin-free ultrapure water (EMD Millipore, MA). The working solution of Na2MoO4 (32 µg mL−1) was prepared from the stock solution directly in cell culture medium for the cell-based assays.
Primary Human Macrophages
Peripheral blood mononuclear cells (PBMCs) were isolated from buffy coats obtained from healthy adult blood donors with informed consent (Karolinska University Hospital, Stockholm, Sweden) by density gradient centrifugation using Lymphoprep (Axis Shield, Oslo, Norway), as previously described.[63] According to university guidelines (1-485/2013), no ethical committee approval is required for these experiments. PBMCs were then positively selected for CD14 expression using CD14 MicroBeads (Miltenyi Biotec, Sweden). To obtain HMDMs, CD14+ monocytes were cultured in RPMI-1640 cell medium supplemented with 2 mm L-glutamine, 100 IU mL−1 penicillin, 100 µg mL−1 streptomycin, and 10% heat-inactivated FBS, supplemented with 50 ng mL−1 recombinant M-CSF (PeproTech, UK) for 3 days and incubated in 5% CO2 at 37 °C.
Cell Surface Marker Analysis
The expression of cell surface markers was analyzed by flow cytometry.[39] CD14 positive monocytes harvested at day 0 were compared to 3-day-differentiated HMDMs (see above). In brief, flow cytometry staining buffer (BioLegend, San Diego, CA) was added to the cells and blocking was performed by adding 2 µL of FcR blocking reagent per 106 cells (Miltenyi Biotec, Sweden), followed by gently vortexing the samples, allowing the samples to settle at RT for 15 min. The cells were then incubated with the conjugated antibodies, FITC mouse anti-human CD14 (BD Pharmingen), FITC mouse anti-human CD86 (BD Pharmingen), and FITC mouse anti-human CD206 (BD Pharmingen), and the isotype-matched control antibody (mouse IgG2a and IgG1, Invitrogen), then vortexed, and incubated at RT for 30 min protected from light. The single cell suspensions were maintained by intermittent vortexing during the incubation. The cell pellets were resuspended in flow cytometry staining buffer for analysis using the BD LSRFortessa X-20 (BD Biosciences, San Jose, CA). Data were analyzed using FCS Express v. 7.0 software (DeNovo Software, Pasadena, CA).
Cytotoxicity Assessment
Cells were seeded in 96-well plates at a density of 60 000 cells per well and exposed to WS2 and MoS2 at the indicated concentrations or were maintained in cell medium alone (negative control) at 37 °C in a humidified 5% CO2 incubator. The LDH release assay[69] to assess the loss of plasma membrane integrity was performed using the CytoTox96 non-radioactive cytotoxicity kit (Promega). The samples were analyzed using the Tecan Infinite F200 plate reader (Männedorf, Switzerland). Experiments were performed with at least three biological replicates (i.e., cells from three individual human donors) and three technical replicates. Results were expressed as percentage cell viability versus maximum LDH release. To control for possible assay interference, the materials were maintained in cell-free medium and mixed with the reaction substrate reagent; no interference was observed.
Endotoxin Assessment
The 2D materials were assessed for endotoxin content as described previously.[20] In brief, HMDMs obtained as described above were exposed to the 2D inks (25 µg mL−1) or to bacterial LPS (Sigma Aldrich) in the presence or absence of the specific LPS inhibitor, polymyxin B (10 µm) (Sigma Aldrich), and TNF-α secretion was measured at 24 h with the Human TNF-α ELISA Kit purchased from MabTech AB (Sweden).
Cellular Uptake of 2D Materials
For TEM analysis, macrophages were exposed to 2D materials (25 µg mL−1) for 24 h. Then, the cells were fixed in 2.5% glutaraldehyde in 0.1 m phosphate buffer, pH 7.4 at room temperature for 30 min, and further fixed overnight in the refrigerator. Samples were rinsed in 0.1 m phosphate buffer and centrifuged. The pellets were then post-fixed in 2% osmium tetroxide in 0.1 m phosphate buffer, pH 7.4 at 4 °C for 2 h, dehydrated in ethanol followed by acetone and embedded in LX-112. Ultrathin sections (50–60 nm) were cut by using a Leica ultracut UCT/Leica EM UC 6. Sections were contrasted with uranyl acetate followed by lead citrate and examined using a Tecnai 12 Spirit Bio TWIN TEM (FEI Company) at 100 kV/Hitachi HT 7700. Digital images were taken using a Veleta camera (Olympus Soft Imaging Solutions).
ICP-MS Analysis
CD14-positive monocytes were seeded in 6-well plates (1 × 10⁶ cells per well) and differentiated with M-CSF (50 ng mL−1) as described above. To determine the intracellular uptake of MoS2, the cells were exposed to MoS2 (25 µg mL−1) for 2 h, while Na2MoO4 was added at the equivalent concentration of Mo. Cells were preincubated for 1 h with cytochalasin D (10 µg mL−1) to investigate the uptake mechanism. After exposure, the cells were washed thrice with PBS and harvested for the analysis of Mo content and cell supernatants were also collected to determine the extracellular Mo concentration. The samples were digested with 65% nitric acid (VWR, Sweden) for 48 h and diluted with 2% nitric acid before loading on the iCAP RQ ICP-MS Operator (ThermoFisher Scientific). Calibration standards of Mo were prepared using the single element standard (Spectrascan SS-1141). All samples were spiked with 5 ppb indium (Spectrascan SS-1135) as an internal standard with a range of recovery between 80% and 105%. The Mo concentration in each sample was calculated based on the standard curve.
Raman Confocal Mapping
To corroborate the presence of MoS2 in macrophages, Raman analysis was performed as previously described.[70] To this end, MoS2 was drop-casted onto a silicon wafer and Raman analysis was performed using a WITec Alpha 300 RAS system equipped with a 532 nm excitation laser and a 50X ZEISS LD EC Epiplan-Neofluar Dic 50x/NA 0.55 objective. All spectra were analyzed using WITec Project Plus 5.1 software. In the Raman microscopy mapping, a Raman spectrum was recorded on every image pixel. Then, Raman maps indicating MoS2 and SiO2 intensity distributions were reconstructed based on the evaluated corresponding average characteristic spectra for all measured pixels from each sample. The scan area for each sample was indicated. The cellular samples were prepared according to two different protocols: with sonication of exposed cells, or by mounting exposed cells on coverslips without prior sonication. In brief, macrophages were incubated with MoS2 (25 µg mL−1) for 24 h. Then, cells were washed with PBS, and harvested using trypsin-EDTA solution (0.25%). The cell pellets were collected by centrifugation and resuspended in PBS. The cells were then disrupted by probe sonication (150 W) (MSE Soniprep 150) for 1 min to obtain well-dispersed suspensions. Cell lysates were kept at −20 °C for further analysis. For the intact (non-sonicated) samples, CD14+ monocytes were seeded on coverslips for subsequent macrophage differentiation. MoS2 (25 µg mL−1) was added to macrophages for 24 h. Then, cells were washed with PBS and fixed with 4% paraformaldehyde for 30 min. The coverslips were mounted on glass slides and kept at 4 °C until further analysis.
Cytokine/Chemokine Profiling
The Meso Scale Discovery (MSD) (Rockville, MD) electrochemiluminescence assay was used to quantify cell supernatant concentrations of the specified cytokines and chemokines in cells exposed for 24 h to the different 2D materials. As a positive control, cells were exposed for 24 h to 0.1 µg mL−1 LPS. The V-PLEX Human Pro-inflammatory Panel 1 (10-Plex) Kit and U-PLEX Human Chemokine Panel 1 (13-Plex) Kit were used. The samples were processed according to the manufacturer's instructions and analyzed using the MSD MESO Sector S600 instrument (MSD, Rockville, MD). Experiments were performed with three biological replicates (i.e., cells from three individual human donors) and three technical replicates. The data were analyzed using the MSD Discovery Workbench 4.0 software.
Trained Immunity Protocol
The present study was based on the standard protocol for trained immunity.[1] However, monocytes were first differentiated to macrophages, as described above. Then, on day 4, cells were trained/stimulated with β-glucan (10 µg mL−1), WS2 (25 µg mL−1), or MoS2 (25 µg mL−1) for 24 h or left untreated (negative control). The supernatants were collected and stored at −80 °C for further analysis. The cells were rinsed gently with prewarmed PBS to remove the stimuli/nanomaterial and incubated in complete cell medium; the medium was replenished after 3 days in culture. On day 6, the cell medium was discarded and the cells were challenged with LPS (50 ng mL−1) for 24 h. Finally, the cells and the supernatants were harvested and stored at −80 °C until further analysis. The experiments were performed with cells obtained from three different human donors. Before “priming” with β-glucan, WS2, or MoS2, cells were pre-incubated or not for 1 h with the histone methyltransferase inhibitor MTA at 0.5 mm (Sigma Aldrich) to evaluate epigenetic effects. Furthermore, to investigate the role of cAMP signaling and glycolysis, the trained immunity protocol was repeated using cells from three independent human donors, and in this second experiment, preincubation was performed for 1 h with the adenylate cyclase inhibitor, ddA (1 mm) (Sigma) and the glycolysis inhibitor, 2-deoxy-D-glucose (2-DG) (10 mm) (Sigma), respectively. In contrast to the first experiment, cells were “trained” for 24 h with MoS2 (25 µg mL−1) or Na2MoO4 (32 µg mL−1, to achieve an equimolar concentration of Mo with respect to MoS2). Following the 24 h exposure, the exposure solution was removed, and the cells were rinsed with prewarmed PBS to remove the inducers and incubated in complete cell medium; the medium was replenished after 3 days in culture. On day 6, the cells were challenged with LPS (50 ng) for 24 h. The cell supernatants and cell pellets were collected and stored at −80 °C.
Real-Time PCR Array Analysis
Pathway-focused gene expression analysis was performed to monitor trained immunity responses. RNA extraction was performed using the RNeasy Mini Kit (QIAGEN). The concentration and quality of the RNA were determined using the NanoDrop spectrophotometer (ThermoFisher). RNA samples were stored at −80 °C for further analysis. Total RNA (500 ng) was used for cDNA synthesis using the RT2 First Strand Kit (QIAGEN). Real-time PCR was then conducted using the RT2 Profiler PCR Array for human common cytokines (QIAGEN, Cat. No. 330231 PAHS-021Z). The list of 84 genes is shown in Table S1, Supporting Information and is based on the information provided by the manufacturer. In addition to these target genes, five housekeeping genes (ACTB, B2M, GAPDH, HPRT1, and RPLP0) were also included. The data analysis was performed using the GeneGlobe Data Analysis Center available at QIAGEN (https://geneglobe.qiagen.com/us/analyze). The relative gene expression levels were calculated using the 2−ΔΔCT method. The log transformation was performed on fold change (log base 2) and p values (log base 10) for the volcano plots. The plots were generated in GraphPad Prism (version 8.2.0). Significantly up- and downregulated genes (p < 0.05) were identified in red and green, respectively. The threshold of twofold changes in gene expression was indicated in grey in each graph. Non-supervised hierarchical clustering was performed to identify co-regulated genes across the individual samples and groups. The clustering analysis was performed using the GeneGlobe Data Analysis Center. Specifically, the magnitude of gene expression was determined by calculating the 2−∆CT for each individual gene and normalizing to the average 2−∆CT of all genes across the samples. The distance metric was employed to convert data points into clusters, and the linkage method was used to join the clusters to form a tree.
RT-qPCR Analysis
For RT-qPCR analysis, the cDNA was synthesized from total RNA (500 ng) using the iScript Advanced cDNA Synthesis Kit (Bio-Rad, Hercules, CA). Transcription of target genes encoding key enzymes in the cAMP pathway and the Moco biosynthetic pathway, along with Mo-dependent enzyme-encoding genes, and cytokine-encoding genes, were quantified using a QuantStudio 5 Real-Time PCR System (Applied Biosystems, Santa Clara, CA). Reaction mixtures were formulated using Maxima SYBR Green/ROX qPCR Master Mix (ThermoScientific). Thermal cycling conditions were as follows: 95 °C for 10 min, 40 cycles of three-step amplification of 15 s at 95 °C, 30 s at 60 °C, and 30 s at 72 °C. The primer sequences for all the genes are provided in Table S2, Supporting Information. GAPDH was used as the house-keeping gene, and the relative mRNA expression level for each gene was calculated relative to control using the 2−ΔΔCT method.
Enzyme-Linked Immunosorbent Assay
To validate the PCR array results, the concentrations of selected cytokines in the cell culture supernatants collected at day 7 were determined by ELISA, using the human CD27 ligand (TNFSF7) ELISA kit (Invitrogen), human LIGHT (TNFSF14) ELISA kit (Invitrogen), human CSF-1 (M-CSF) ELISA kit (Invitrogen), human IL-27 ELISA kit (Invitrogen), and human Activin A ELISA kit (Invitrogen). The assays were performed according to the manufacturer's instructions. For each cytokine, the standards were prepared according to the manufacturer's introduction. The absorbance was read at 450 nm with a Tecan Infinite F200 plate reader (Männedorf, Switzerland). The concentrations were determined according to standard curves using recombinant cytokines.
cAMP Assessment
The intracellular cAMP levels were evaluated upon exposure to the indicated concentrations of MoS2 for 24 h. Cells were preincubated or not with the adenylate cyclase inhibitor ddA (1 mm) (Sigma). cAMP levels were determined with the cAMP-Glo Max Assay following the manufacturer's instructions (Promega). The luminescence was recorded with a Tecan Infinite F200 plate reader (Männedorf, Switzerland). cAMP levels were calculated according to the standard curve.
Statistical Analysis
Experiments were performed in at least three biological replicates and duplicate or triplicate technical replicates. Data shown are mean values ± S.D. Statistical analysis was performed by one-way or two-way ANOVA or Student's t-test as indicated using Prism 9.0.2 (GraphPad), with p < 0.05 (*p < 0.05, **p < 0.01, ***p < 0.001, and ****p < 0.0001).
Acknowledgements
This work was supported by the European Commission through the Graphene Flagship (Grant agreement no. 881603) and the Swedish Research Council (Grant no. 2021–04983). The authors thank Lars Haag, EM Core Facility at Karolinska Institutet, for expert assistance with the TEM analysis of macrophages, and Illia Dobryden, Research Institutes of Sweden (RISE) for excellent assistance with Raman analysis. [Correction added after publication 19 May 2022: The title was updated]
Conflict of Interest
The authors declare no conflict of interest.
Author Contributions
G.P. performed experiments, analyzed data, and drafted the paper; S.K. performed experiments, analyzed data, and drafted the paper; L.D. edited the paper; Y.S. prepared and characterized the test materials; C.C. supervised the work, analyzed data, and edited the paper; B.F. coordinated the study, supervised the work, analyzed data, and wrote the paper, and all the co-authors approved the final version of the paper.
Open Research
Data Availability Statement
The data that support the findings of this study are available from the corresponding author upon reasonable request.


