Wearable Bifocal Contact Lens for Continual Glucose Monitoring Integrated with Smartphone Readers
Abstract
Commercial implantable continuous glucose monitoring devices are invasive and discomfort. Here, a minimally-invasive glucose detection system is developed to provide quantitative glucose measurements continually based on bifocal contact lenses. A glucose-sensitive phenylboronic acid derivative is immobilized in a hydrogel matrix and the surface of the hydrogel is imprinted with a Fresnel lens. The glucose-responsive hydrogel is attached to a commercial soft contact lens to be transformed into a bifocal contact lens. The contact lens showed bifocal lengths; far-field focal length originated from the contact lens’ curvature, and near-field focal length resulting from the Fresnel lens. When tear glucose increased, the refractive index and groove depth of the Fresnel lens changed, shifting the near-field focal length and the light focusing efficiency. The recorded optical signals are detected at an identical distance far from the contact lens change. The bifocal contact lens allowed for detecting the tear glucose concentration within the physiological range of healthy individuals and diabetics (0.0–3.3 mm). The contact lens rapidly responded to glucose concentration changes and reached 90% of equilibrium within 40 min. The bifocal contact lens is a wearable diagnostic platform for continual biomarker detection at point-of-care settings.
1 Introduction
Measurement of glycated hemoglobin (HbA1c) is the conventional method for assessing glycemic control; however, this method does not provide information about intra- and interday glucose concentration changes when hyperglycemia or hypoglycemia may develop, and both are linked to micro/macrovascular compilations.[1] Continuous glucose monitoring (CGM) systems have emerged to obtain frequent measurements throughout the day. The CGM systems have revolutionized the way diabetes is managed, especially in type 1 diabetes. The first “professional” CGM system was approved by U.S Food and Drug Administration (FDA) in 1999.[2] The first non-invasive CGM, which allowed patients and providers to measure glucose concentration, was the “Glucowatch Biographer”, which was approved by the FDA in 2001; however, this device has been withdrawn from the market due to low clinical efficacy and irreproducibility of measurements.[3] An advanced real-time CGM system (Guardian) was introduced by Medtronic in 2004.[4] In 2006, Dexcom released its first real-time CGM which is called the Short-Term Sensor (STS).[5] FreeStyle Navigator by Abbott was released in 2008.[6] Dexcom introduced the G4 Platinum, G5, and G6 in 2012, 2015, and 2018, respectively, which allowed the glucose readings to be transmitted to the user's smartphone.[7] In 2016, Abbott released FreeStyle Libre Pro CGM which does not require frequent calibration and can be worn for 14 days.[8] In 2017, FreeStyle Libre, which could be worn for 10 days, with real-time user access was introduced.[9] However, the advances in CGM systems remained limited due to: i) they haven't been approved by the FDA for insulin dosing, and for use in hospitals and intensive care units, ii) high costs, iii) necessity for calibrations (at least twice a day) as a result of signal drift, and iv) regular replacement of the electrochemical sensor.[10]
Commercial CGM systems detect glucose concentration in the interstitial fluid, which requires the insertion of the electrochemical probe through the skin. On the contrary, tears are easy and minimally-invasively accessed, and could be used as a blood proxy for diagnosing cancer, Alzheimer's disease, Parkinson's disease, cystic fibrosis, systemic sclerosis, aniridia, glaucoma, and dry eye.[11-20] In this context, contact lenses-integrated sensors that sample and measure tears offer a minimally-invasive diagnostic platform to detect numerous biomarkers.[21, 22] The advances in electronics and microfabrication allowed for the miniaturization of the biosensors to fit in contact lenses without blocking the eye vision.
The contact lenses have been integrated with electrochemical, light diffraction, and fluorescent glucose sensors. The electrochemical sensors are enzyme-based and they have been successfully attached to contact lenses comprising polyethylene terephthalate (PET), and polydimethylsiloxane (PDMS).[23-27] Although the electrochemical glucose sensors incorporated in contact lenses provided many capabilities such as selectivity, high sensitivity, and rapid response; they are associated with a number of practical limitations.[28] Electrochemical sensors are based on enzymes which are unstable by nature and suffer degradation in a short lifespan. Furthermore, the operation conditions such as ambient oxygen, pH, temperature, and humidity influence the sensor's performance. Sterilizing the contact lens can denature the enzymes. Additionally, the hydrogen peroxide which is a byproduct due to glucose-enzyme interaction, reacts with tear's ingredients such as ascorbic acid interfering with the sensor's response.[29] The microfabrication of the electrochemical sensor on polymer substrates is also a challenge due to the limitations of the thermal and mechanical properties of the materials.[30] The electrochemical probes require a power supply to drive the chemical reaction, which makes fabricating contact lens sensors complex.
Fluorescent glucose sensors have been incorporated in contact lenses. They are based on fluorophores and glucose recognition agents, which can be trapped in hydrogel spheres or silica particles.[31] Such sensors have been embedded in soft contact lenses: polyvinyl alcohol (PVA), polyhydroxyethylmethacrylate (pHEMA), PDMS, and commercial daily disposal contact lenses.[32-34] However, the fluorescence-based molecular recognition agents are influenced by the ambient oxygen concentration and temperature while the fluorophores suffer low chemical stability due to the photobleaching.[35]
Due to ease of fabrication and simple readout, light diffractive glucose sensors (LDGS) incorporated in contact lenses became an attractive platform for CGM. Unlike electrochemical sensors, the LDGS rely on glucose-sensitive ligands such as phenylboronic acid (PBA) derivatives, which are covalently immobilized in a hydrogel matrix. The PBA binds with cis-diols in glucose leading to volumetric changes in the hydrogel matrix. Holographic, 1D grating, asymmetric microlens arrays, and 3D photonic crystal glucose sensors based on PBA derivatives were integrated with soft contact lenses to continuously monitor glucose concentration.[36-38] LDGS-based PBA exhibits high operation stability; however, the limit of detections (LODs) of these sensors did not allow for operating at low glucose concentrations in physiological range.[39]
A complication of diabetes is myopia, which progresses yearly with −0.5 diopter when the individual using the traditional monovision contact lenses. Bifocal contact lenses have been known for controlling myopia, decreasing its progression by 84% for individuals of ages 9–40 years.[40] Furthermore, bifocal contact lenses are prescribed for people who suffer age-related decline in near vision (presbyopes). Hence, it is highly desirable to develop a bifocal contact lens capable of control myopia, aid presbyopia sufferers, and monitor glucose concentrations. Here, bifocal contact lenses were developed to sense glucose concentration changes in tears under simulated physiological conditions. A hydrogel glucose sensor based on 3-(acrylamido) phenylboronic acid and Fresnel structure (concentric lenses) was attached to a soft contact lens. The wearable device showed bifocal lengths, which originated from the bending of the contact lens, and the Fresnel structure replicated on the hydrogel surface. Quantitative readouts were obtained by a smartphone and a photodetector through the measurement of the changes in the optical power reflected from the bifocal contact lens. The main advantages of the developed contact lens over previously developed technologies are that the present work combines easy and fast fabrication, offers a low LOD, employs a robust readout methodology, and may assist to manage myopia and presbyopia.
2 Results and Discussion
Bifocal contact lenses are produced to provide clear vision at near and far distances for people who suffer refractive errors and those who experience age-related decline in near vision called presbyopia.[41] Also, bifocal contact lenses showed to be very effective in controlling myopia.[40] The center region of the concentric bifocal contact lens is designed for far viewing and the middle zone is designed for near seeing. In this work, for near viewing zone, Fresnel lens (concentric rings/Fresnel structure) were replicated on soft contact lenses and the central zone of the contact lens was left bare for clear vision at a far distance (Figure 1a). The near viewing zone was made of a glucose-responsive hydrogel, which would influence the near viewing upon exposure to changes in glucose concentration of tears (Figure 1b). Glucose present in tears interacts with the Fresnel lens made of the glucose-responsive hydrogel leading to swelling of the Fresnel structure in the plane normal to the contact lens's surface. This subsequently decreases its refractive index modifying the focusing efficiency and focal length, which slightly influences the near vision and the recorded power at an identical distance (Figure 1b).
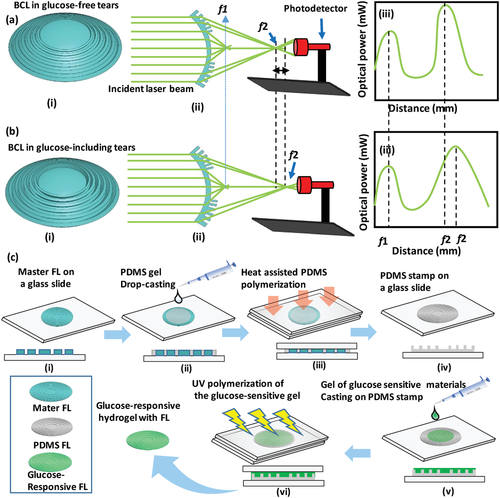
Contact lenses for CGM were developed based on optical transducers (holograms, light diffusive microstructures, 1D gratings) that were capable of monitoring the volumetric response of the glucose-sensitive hydrogel which was based on PBA derivatives immobilized in a polyacrylamide hydrogel matrix.[37, 38, 42, 43] However, these contact lenses could not function in the physiological glucose concentration range of tears. The developed contact lens in the present work functions in the low glucose concentration range of tears and the role of the optical transducer (Fresnel structure) may extend to control myopia, and assist presbyopes by providing clear near viewing, which make the developed contact lens favorable for patients who suffer from both diabetes and refractive errors.
For investigating the effect of swelling/shrinking of the glucose-responsive hydrogel and hence, the working principle of the sensor, the PDMS stamped with the FL-10 was replicated on a free-standing and glass substrate-constrained glucose sensors. Thereafter, optical microscopic images were recorded for both sensors in 40% relative humidity (RH) and full hydration conditions (Figure 3a,b, Figure S2a, Supporting Information). The free-standing sensor in the hydrated conditions defocused its surface under the microscope (20× objective lens). This confirmed changing its focal length. Upon refocusing the glucose sensor's surface, an expansion in the diameters of the concentric rings was observed, which was confirmed by analyzing the surface texture using Gwyddion software (Figure 3a). The grooves positions in the fully hydrated conditions were shifted outward compared to the case of 40% RH (Figure 3c). These results match with the literature that showed the modification of the focal length (f) of a Fresnel lens by exposing it to a mechanical strain.[46] The sensor's expansion resulted from water absorption as the hydrogels are well-known for their capabilities of retaining water.[47] On the contrary, diameters of the Fresnel structure of the glass-constrained sensor did not change under the hydration conditions, which was due to sticking the sensor onto the silanized glass substrate by covalent bonds (Figure 3b). This observation was confirmed by analyzing the surface textures of the sensor in 40% RH and in fully hydrated conditions, where the grooves’ positions completely matched in both conditions (Figure 3d). Additionally, the sensor did not show a significant defocusing under the microscope at fully hydrated conditions; however, the groove depth increased due to swelling the sensor in its unconstrained dimension (normal plane to the sensor's surface (NPSS)) (Figure 3b,d).
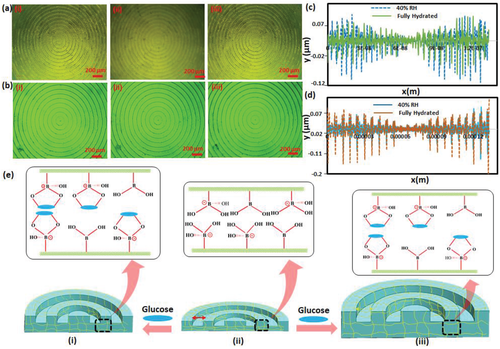
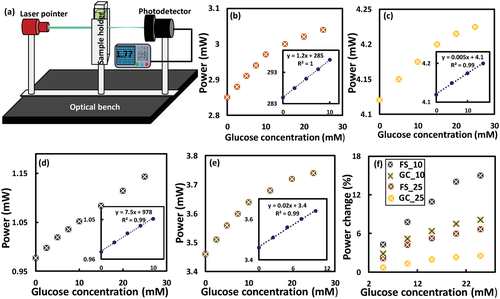
Four glucose sensors were fabricated: i) free-standing sensor with FL-25 imprinted on its surface (FS-25), ii) glass-constrained sensor with FL-25 replicated on its surface (GC-25), iii) free-standing sensor with FL-10 replicated on its surface (FS-10), and v) glass-constrained sensor with FL-10 replicated on its surface (GC-10). Imprinting both Fresnel lenses of different groove spacing 0.25 mm (f = 25 mm), and 0.1 mm (f = 10 mm) on the hydrogel sensors allowed for investigating the influence of the optical transducer's dimensions on the sensor's performance. To examine the sensors’ response, glucose concentrations (0–25 mm) were prepared in phosphate buffer saline (PBS) solutions (pH 7.4, ionic strength: 150 mm) and the sensors were equilibrated for 24 h in glucose-free PBS solution prior to testing. For each glucose concentration, the measurement was taken after 20 min of introducing the glucose solution into the sensor. Any changes in refractive index, groove spacing, and the number of concentric ring zones (m) resulting from the glucose-boronate interaction influences the optical performance of the Fresnel lens; focus efficiency, focal length, and subsequently, the optical power measured at an identical distance. The sensing was carried out in transmission mode by recording the optical power for the laser beam after passing through the sensor at a distance > f. Optical power detection was utilized instead of the changes in the focal length as it was favorable in terms of practicality, which rendered the readout methodology simple. In addition, according to the literature, the f changes would be slight, which may not allow accurate detection in sensing applications.[46] The FS-25 glucose sensor was immersed in glucose-free PBS (1 mL) and the optical power of the laser beam was detected at 25 cm away from the sensor. The measurements were repeated while the sensor was submerged in various glucose concentrations (0–10 mm) starting from low to high concentrations with an increment step of 2.5 mm glucose, and a step of 5 mm at a higher glucose range (10–25 mm). Upon introducing the glucose solution, the sensor swelled due to 1:1 glucose-boronate binding. PBAs have an affinity to reversibly bind with 1,2-diols such as glucose, and 1,3-diols forming either 1:1 complex or 2:1 crosslinking.[42] In 1:1 PBA-glucose complexation, Donnan potential is induced causing osmatic pressure, which swells the hydrogel matrix (Figure 3e(iii)). While 2:1 complexation leads to shrinkage of the hydrogel matrix due to the extra crosslinks resulting from boronate-glucose interaction.[48] The present sensor is designed to operate at the physiological pH (7.4), which is lower than the pKa of the utilized boronic acid, 3-(acrylamido)phenylboronic acid (pKa = 8.5) when it is incorporated in the polyacrylamide hydrogel. At low pH, PBA exists in an uncharged trigonal planar form that reacts with glucose forming cyclic ester of pKa less than the physiological pH, subsequently it dissociates into a hydrogen ion and a stable boronate anion (Figure S2b, Supporting Information). While at high pH>pKa, the trigonal configuration of PBA dissociates donating a proton to constitute a stable tetrahedral anion, which has high affinity and stability to bind with glucose (Figure S2b, Supporting Information). The FS-25 sensors expanded in 3D, decreasing the number of concentric ring zones (m) exposed to the laser beam, and consequently increasing the focal length (Figure 3c(iii)). Hence, the transmitted recorded optical power at a distance > f increased with glucose concentration (Figure 4a,b). Furthermore, the sensor's refractive index decreased when the hydrogel sensor swelled resulting from imbibing a more aqueous solution, which has lower refractive index than the hydrogel matrix. The sensor presented a linear response within the glucose range of 0–10 mm, that had a correlation coefficient R2 = 1. However, the sensitivity decreased with increasing glucose concentration (Figure 4b). The sensitivity of the sensor in the low glucose range (0–10 mm) was 12 µW mm−1. However, the change in the measured optical power with glucose concentration depended on the initial power that illuminated the sensor in glucose-free solution. It was more accurate to rely on the percentage change of the measured power which was found to be 0.42% mm−1 for FS-25 sensor and 0.13% mm−1 for the GC-25 sensor (Figure 4c–f). The sensitivity of the free-standing sensor was almost threefold that of its counterpart, the glass-constrained sensor (GC-25). This difference is attributed to swelling the sensor in the surface's paralleled plane, which allows for changing the diameter of the concentric rings, and hence the groove spacing. Additionally, the expansion of the free-standing sensor in 3D rendered the sensor capable of absorbing more aqueous solution and consequently, a more decrease in its refractive index was expected. The sensitivity of the FS-10 sensor in the low glucose concentration range (0–10 mm) was 0.77% mm−1 which was almost double the sensitivity of that of FS-25; however, both sensors were made of the same glucose-responsive hydrogel (Figure 4d–f). These results reflected the significance of the dimensions of the employed optical transducers for monitoring the dynamic volumes. It can be concluded that the tenuous volumetric changes could be detected by a minute or nanoscale transducer. Also, GC-10 sensor showed a sensitivity of 0.52% mm−1 which was higher than that of both FS-25 and GC-25 sensors in the same glucose range (0–10 mm) (Figure 4e,f). The decrease in the sensitivities of the four sensors at high glucose concentrations may be attributed to the limited boronate binding sites and decreasing elasticity of the hydrogel due to the volumetric swelling process.[37] Furthermore, at high glucose concentrations (10–25 mm), GC-25 sensors saturated; however, the GC-10 sensor was still capable of detecting the subtle volumetric shifts. These results indicate that dimensions of the optical transducer influence not only the sensitivity but also the detection range of the sensor. To confirm the sensing principle of the free-standing sensor, the surface of an FS-10 sensor was investigated under a microscope while the sensor was immersed in various glucose concentrations. The diameter of the central ring of the Fresnel lens replicated on the FS-10 sensor was measured with glucose concentration changes. The diameter increased with glucose, presenting a trend similar to the measured optical power, particularly the linear trend observed for the glucose range of 0–10 mm (Figure S3, Supporting Information).
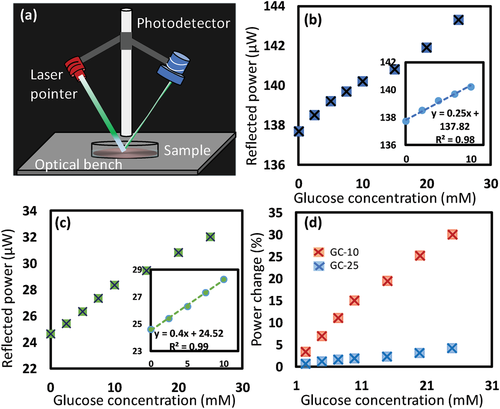
Further investigations were carried out for glass-constrained sensors, which were similar to the case when the sensors attached to contact lenses as the sensors are constrained on the contact lens’ surface and allowed to swell only in NPSS. The two glucose sensors; GC-25 and GC-10 were interrogated for glucose sensing in reflection configuration as a practical mode. A sensor was immersed in a Petri dish while the Fresnel structure facing up the incident laser beam, which hit the surface at an inclined angle of 45° and the reflected beam was collected at 45° from the other side (Figure 5a). The photodetector was fixed at 30 cm away from the sample's surface and the reflected signal was recorded continuously over time (Figure S4, Supporting Information). Both GC-25 and GC-10 sensors showed similar trends in response to the increase of glucose concentration (Figure 5b,c). When glucose concentration increased from 0 to 10 mm, the reflected optical power positively shifted by 1.8%, and 15% for the GC-25 and GC-10, respectively (Figure 5d). In contrast to the transmission mode measurements, the GC-25 sensor in reflection mode showed a response for low glucose concentration (2.5 mm), which could not be detected in transmission configuration, and the saturation response at a high glucose concentration range (10–25 mm) was not observed (Figure 5b). Furthermore, the sensitivity increased by ≈38% and 200% for the GC-25 and GC-10 sensors, respectively. These enhancements may be attributed to the advantages of the inclined incident angle of the laser beam in the reflection configuration setup. The literature showed a sensitivity of 7.5% for a glucose concentration range of 0–10 mm when asymmetric microlens arrays were used as an optical transducer for a glucose-responsive hydrogel made of the same monomer composition.[49] The superior sensitivity of the GC-10 sensor (15%) in the same glucose range might be attributed to the finer dimensions of the Fresnel lens (FL-10). In addition, the optical performance of the FL-10 was sensitive for subtle changes of its refractive index and groove depth. To show the capability of the GC-10 sensor to function at low glucose concentration at physiological range in tears, it was interrogated in the glucose concentration range of 0.0–3.3 mm. The sensor showed a linear response, sensitivity of 6.7% for the whole glucose range, and a low LOD of 0.51, which reflect its robust performance (Figure S5, Supporting Information).
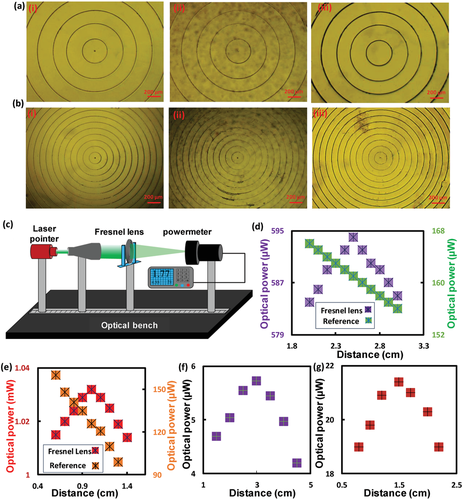
To show the utility of the developed sensors, the sensors imprinted with FL-10 and FL-25 were attached to commercial contact lenses, separately–yielding two glucose-sensitive contact lenses; CL-10 and CL-25, respectively. Photographs were taken for the sensor-integrated contact lenses fixed on the eye model and hold by forceps (Figure 6a,b). Cross-section image of the CL-10 was taken by the optical microscope. The influence of the developed contact lenses, in terms of refractive error corrections and vision clarity, were examined (Figure 6c,d). To confirm the bifocal lengths for the developed contact lenses and to test their refractive error corrections, focal length measurements were carried out (Figure 6c,d). The contact lens loaded with the glucose sensor imprinted with the FL-25 (CL-25) showed two focal lengths; f1 at 1 cm distance, which was resulted from the curved base of the contact lens, and f2 at 5 cm distance, which was induced by the Fresnel structure. On the other hand, the contact lens loaded with the glucose sensor imprinted with the FL-10 (CL-10) revealed two focal lengths; f1 and f2 at distances 1 and 3 cm, respectively. Both CL-25 and CL-10 presented an f1 at 1 cm distance, which confirmed that f1 resulted from the curved base of the contact lens as both commercial contact lenses used to load the sensors had the same specs. Also, the f2 induced by the Fresnel structure for the CL-25 was detected at 5 cm shifting by 2 cm than that for the GC-25 sensor, and the f2 for the CL-10 shifted 1.5 cm (Figure 2f,g). These discrepancies might be attributed to stretching the groove spacing of the Fresnel structure due to the curved surface of the contact lens. Particularly, the difference in the refractive indices of the substrates of the Fresnel structure played a role. In glass-constrained sensor, the substrate was a glass slide of refractive index, n = 1.5, whereas in CL-25 and CL-10, the contact lenses themselves played the substrate role having n< 1.5.
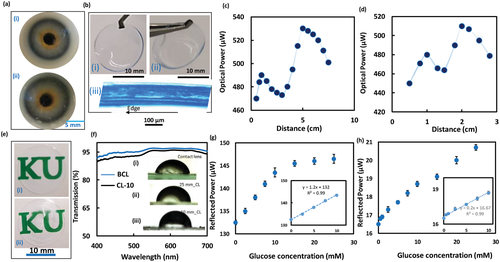
Photographs show the transparency of the CL-10 compared to the sensor-free contact lens is displayed in Figure 6e. Also the clarity of the contact lens loaded with the glucose sensor was tested by recording its transmission spectra and the results were compared to the spectra of the sensor-free contact lens (Figure 6f). The photographs and transmission measurements showed that the transparency of the contact lens slightly decreased upon attaching the sensor as the average transmission for the incident white light (400–700 nm) declined from 95% to 92% (Figure 6d). This decrease in the transparency may be due to the light scattering at the interface between the contact lens and glucose sensor, and light scattering at the sensor's rough surface. However, the clarity of the sensor-loaded lens could be increased by decreasing the sensor's thickness. Effect of attaching the glucose sensor on the wettability of the contact lens was investigated by measuring the static contact angle (Inset in Figure 6d). Far from the center zone of the lens, in regions where the glucose sensor is attached, the wettability decreased as the contact angles decreased from its pristine value 64.5° in the center region to 79.7° in the region where FL-25 was imprinted, and 82.6° in FL-10 zones. The outer surface of the contact lens was close to hydrophobic for wear comfort and preventing contact lens-related dry eye.[50] Dehydration of contact lenses is directly linked to contact lens-related dry eye, and induces discomfort which originates from changes in the lens fit, an increase of lid-lens interaction, or developing epithelial staining. Therefore, hydrophobic outer surface of the lens would reduce evaporation of the tear solution reducing the deposition of tear's proteins that cause eye dryness and discomfort.
The contact lenses loaded with the glucose sensors were tested for glucose detection in reflection configuration under physiological conditions (pH 7.4, ionic strength: 150 mm, 37 °C) (Figure 6g,h). The CL-25 was interrogated at 37 °C, showing a linear response for the glucose concentration range of 0–10 mm similar to the GC-25 sensor tested in reflection mode at room temperature (24°) (Figures 5b and 6e). However, at a high glucose concentration range (10–25 mm), the CL-25 saturated. This was indicated by the subtle shift in the detected signals as the measured power increased by 2.9 µW while for the low glucose range (0–10 mm) the power increased by 11 µW (Figure 6e). It can be concluded that at physiological temperature (37 °C), the sensitivity of the sensor significantly declined at high glucose concentrations (10–25 mm) than when the glucose test was carried out at room temperature (24 °C) (Figures 5b and 6g). The response of the CL-10 for glucose at 37 °C supported this conclusion as the sensitivity of the CL-10 for glucose concentration range of 10–25 mm was 10.7% compared to 13% for the GC-10 tested at 24 °C (Figures 5c and 6h). The LOD for the CL-25 was found to be 2.5 mm, which was above the range of glucose concentration in tears for healthy individuals (0–1.1 mm); however, glucose concentration for diabetic patients can increase up to 3.3 mm (Figure 6e).[51] In contrast, the CL-10 was able to detect glucose concentration in healthy people range showing a LOD 0.5 mm (Figure 6h). Utilizing Fresnel lenses of smaller groove spacing<0.1 mm can enable developing a glucose sensor with a lower LOD (≈0.1 mm).
To develop practical contact lens sensors, the CL-10 was examined under physiological conditions in reflection configuration using a smartphone photodiode (Figure 7a). The ambient light sensor in the smartphone was utilized to capture the reflected light at a distance of 15 cm and recorded its illuminance. An android app. (Smart Tools Box, Google app Store) was utilized. The trend of the response curve was quite similar to that one recorded by an optical power meter (Figure 6h). A linear response was recorded for the low glucose concentration range (0–10 mm) and a decline in the slope at the high glucose concentration range (10–25 mm) was observed. The sensitivity was 13.1% and 10.9% for the glucose ranges of 0–10 mm, and 10–25 mm, respectively. This behavior was comparable with the sensitivity values when the measurements were recorded by an optical power meter that were 13% and 10.7% for the same glucose concentration ranges, respectively (Figures 7a and 6h). These results indicated the possibility of using the smartphone as a portable reader for the developed contact lens-integrated glucose sensor. Practically, it is envisioned that the contact lens's reader would be a photodetector and a light source installed in a glasses frame to be worn when patients need to measure their glucose concentrations (Figure 7b). The light beam would hit the worn contact lens at an inclined angle and collected by the photodetector, and the recorded power would be received by the patient's smartphone via Bluetooth, and a smartphone application can correlate the received signals with glucose concentrations in tears.
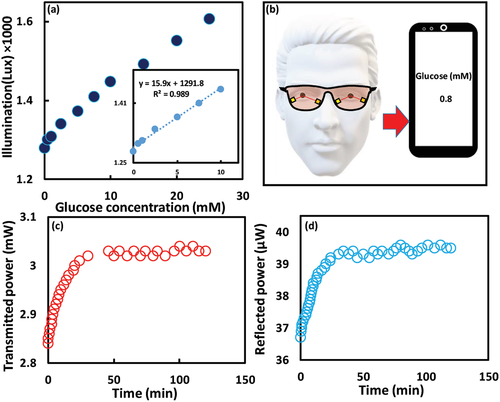
To test the complexation dynamics for the glucose molecules with the sensor, the CL-10 was exposed to 5 mm glucose solution and the response was recorded over time in both reflection and transmission configurations. The sensor responded immediately to glucose and reached to 90% of the equilibrium complexation in 40 min (Figure 7c,d). A holographic glucose sensor based on the same hydrogel matrix and the glucose recognition agent (3-APBA) reached to 90% of equilibrium in 50 min, which indicated that the developed optical transducer accelerated the complexation due to increasing the sensor’ surface-to-volume ratio, and the glucose diffusion rate.[42] On the other side, an optical glucose sensor made of the same hydrogel ingredients lasted 20 min to reach 90% equilibrium when an optical transducer, 1D grating of periodicity 1.6 µm was replicated on the sensor's surface.[37] The shorter equilibrium time of the 1D grating sensor than that of the developed sensor might be due to the finer dimensions of the 1D grating compared to the FL-10. The periodicity of the FL-10 was 100 µm compared to 1.6 µm for the 1D grating. The developed contact lens may not be used for a patient who suffers from glaucoma that increases the intraocular eye pressure. This may change the curvature of the worn lens, and hence the bifocal lengths change; subsequently, the recoded optical signals could alter. Furthermore, the developed lens is not advisable for patients who suffer from a disease that induces pH changes in tears as the sensor's sensitivity could be affected by pH changes.[38]
To investigate the reproducibility of the developed bifocal contact lens (CL-10), its response was recorded during four cycles (Figure 8a). The contact lens was examined for 20 min in 5 mm of glucose solution and then was rested in a buffer solution of pH 4.6 for 10 s and 20 min in glucose-free PBS buffer before the next cycle. The reflected power increased from 26±0.1 to 28±0.1 µW in each cycle, and by resetting, the power decreased to its pristine value of 26± 0.1 µW each time without hysteresis. The contact lens sensor exhibited reusability without hysteresis, and had comparable sensitivity for each cycle.
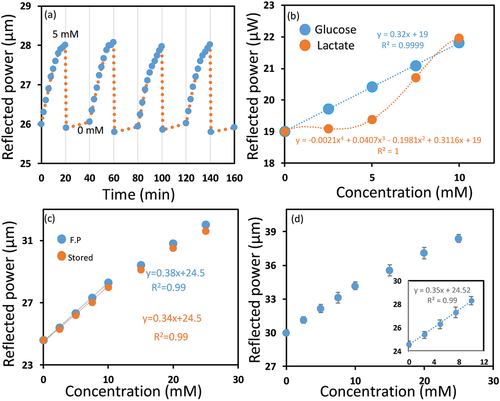
Boronic acid derivatives bind to saccharides present in tears such as galactose, and also bind to α-hydroxy acids such as lactic acid. However, galactose exists in tears at a low concentration (4 µm) compared to glucose (0.4 mm) for healthy individuals. Hence, glucose is dominant in concentration as compared to galactose. Hence, the excepted interference from galactose is tenuous. On the other hand, the average L-lactate concentration in tears is 2.5 mm which is quite high.[52] Therefore, the potential interference of lactate on the response of the developed contact lens (CL-10) was investigated. The lactate solutions were prepared in PBS buffer of pH 7.4 and the CL-10's response for lactate and glucose were recorded, separately at 37 °C to determine the potential interference of lactate in physiological conditions. The reflected optical power from the CL-10 increased significantly at high lactate concentrations, but a slight increase was detected at low lactate concentrations (<5 mm). In contrast, the reflected optical power from the CL-10 considerably increased at low glucose concentrations (<5 mm). At 2.5 mm lactate concentration, the output signal increased by 0.5% as compared to 3.75% increase for the same glucose concentration. Therefore, at a glucose concentration of 2.5 mm, the interference of the lactate according to its average concentration in tear would be 11%.
To test the long-term stability or the shelf life of the developed lenses, the response to glucose was detected for a CL-10, which was stored for three months and was compared with the response of a freshly prepared CL-10 (Figure 8c). The stored lens showed a similar response toward glucose to that of a freshly prepared lens, with a subtle decline in the sensitivity. A change of 14.9 in the output power was recorded for the freshly prepared lens (CL-10) compared to 14% achieved by the stored CL-10 in the same glucose concentration range (0–10 mm).
To confirm that the proposed bifocal contact lens (CL-10) can function in tears, it has been tested for glucose detection in artificial tears (Figure 8d). The response was similar to its response in PBS buffer with a slight decrease in sensitivity which may be due to the interference of tear ingredients. The increase in the output signal was 13.9% in artificial tears compared to 15% in PBS buffer, upon increasing glucose concentration from 0 to 10 mm.
The first bifocal contact lens pair which was based on Fresnel lenses, was developed and commercialized by Etchlon in 1989.[53] This category of contact lenses offered several advantages including reduced visual competition by the out-of-focus image and pupil-size independence.[54] In contrast, the image quality and the brightness of the conventional simultaneous bifocal vision lenses depend on the pupil size. For example, bifocal lens that has the near vision correction in the center will have a bias in favor of near vision in bright illumination while dim illumination with pupil dilation causes a bias toward distance vision. On the other side, the bifocal contact lens-based on Fresnel lens can be designed to be completely independent of pupil size. In this case, the entire phase plates contribute to the near and distance images as light can be split evenly between the two images based on the lens design. Consequently, pupil size variations will not alter the relative brightness of the distance or the near image. Fresnel lens-based bifocal contact lenses provide images with reasonable resolution because of the use of full aperture optics; however, the image formed is dimmer compared to conventional contact lenses. The incident light rays split between two images decreasing the contrast and a slight loss of acuity.[54] Early studies on Fresnel lens-based bifocal contact lenses found that the contrast sensitivity and vision acuity slightly decreased compared to that of spherical contact lenses; however, the contrast sensitivity and acuity were in the normal range of the subjects studied.[55] One of the other undesirable characteristics of the Fresnel lens-based bifocal CL is that it induces glare or halos around light at night; however, the wearers can adapt to this effect within 7–10 days. Shape, number, width, depth of the used Fresnel lens echelettes control the image quality, and by appropriate considerations for these parameters, optimum bifocal contact lens can be achieved.[56, 57] Furthermore, the adoption of the phase synchronization for the light passing through the Fresnel lens during the design, may overcome the limitation of usage Fresnel lenses in bifocal contact lenses.[57] Currently, Clerio Vision is developing Fresnel lens-based soft contact lenses for correcting myopia, presbyopia, hyperopia, astigmatism, and high order aberration. One of the advantages of the Fresnel lens is that its design allows large aperture and short focal length as compared to their counterparts.[58] The lens with the larger aperture is the wider the cone angle of the incident rays that focus in the image plane. Hence, the Fresnel lens may provide a wider visual field. Therefore, utilizing the Fresnel lens in the developed bifocal contact lens is expected to positively influence the visual field regarding vision acuity.
3 Conclusion
A bifocal contact lens was demonstrated for glucose sensing, which exhibited a robust performance under simulated physiological conditions. The Fresnel lens imprinted on the glucose sensor, which was attached to the contact lens, originated a new focal length for the contact lens. The focusing efficiency, and the focal length of the Fresnel lens was influenced by changing glucose concentrations in eye tear and consequently, the reflected power measured at an identical distance changed. The dimensions of the Fresnel structure used as an optical transducer governed the performance of the sensor in terms of sensitivity, LOD, and the detection range. A LOD of 0.5 mm was recorded for the CL-10, which is expected to decrease significantly when a Fresnel structure of nanoscale dimensions is utilized. The developed contact lenses offer practicality in the readout methodology, simple and fast fabrication process, in addition to the flexibility to achieve the desired sensitivity, detection range that could be controlled by selecting the appropriate Fresnel lens. This study could be a basis for minimally-invasive CGM system for diabetics as well as selectively detecting other ophthalmic biomarkers in tears.
4 Experimental Section
Materials
Dimethyl sulfoxide (DMSO), PBS, acrylamide (AA), N,N′-methylenebis(acrylamide) (BIS), 3-(acrylamido) phenylboronic acid (3-APBA), 2,2-diethoxyacetophenone (DEAP), sodium L-lactate, and β-D-(+) glucose were purchased from Sigma Aldrich and used without further purification. Two Fresnel lenses with groove spacing of 0.25 (focal length (f) = 25±1.25 mm) and 0.10 mm (f = 10±0.5 mm) were purchased from Thorlabs to be imprinted on the glucose-responsive hydrogel functioning as optical transducers.
Preparation of the Artificial Tear
Artificial tear was prepared by eye drops (Systane), which contained polyethylene glycol 400, boric acid, CaCl2, MgCl2, KCl, and NaCl. Nitrites/nitrates (120 µmol L−1) and standard protein (5 g L−1) were added to the drops. The pH of the tears was adjusted to be 7.4 by Trizma HCl and Trizma base.[59]
Preparation of the Hydrogel Glucose Sensor
The polyacrylamide hydrogel was synthesized by the free radical polymerization method. BIS was used as a crosslinker, and DEAP was the photoinitiator. The monomer solution was made of acrylamide (78.5 mol%), BIS (1.5 mol%), 3-APBA (20 mol%), and DEAP dissolved in DMSO. The mixture was stirred for 10 min at 24 °C. For synthesis of the free-standing glucose sensor, the monomer solution (150 µL) was drop-casted onto the Fresnel lens and a hydrophobic glass slide was placed on top of the gel to obtain a uniform thick layer and to prevent the oxidization. The photopolymerization was initiated by a UV lamp (black ray, 365 nm) for 15 min, and upon completing the polymerization, the sample was left in DI water for 2 h to be easy to be peeled off. Samples were washed three times by ethanol/DI water (50%, v/v) to remove the unpolymerized monomers, and stored in PBS solution (pH 7.4). For synthesis of the constrained glucose sensor, similar procedures for the free-standing sensor were followed except the amount of gel pipetted on the Fresnel lens was 20 µL and a silanized glass slide was placed on top of the gel instead of the hydrophobic glass. For fabricating the bifocal contact lens, commercial contact lenses (1-Day Acuvue Moist) were flattened on a glass slide and left to dry, then it was placed on top of 10 µL of the monomer solution drop-casted on the Fresnel lens. The grooves in the middle zone of the Fresnel lens were filled with polymers prior to the replication process to keep the central area of the contact lens free of the Fresnel structure.
Characterization of the Hydrogel Glucose Sensor
An optical microscope (Zeiss 20× objective lens) was used to investigate the surfaces of the master Fresnel lenses, PDMS, and the glucose sensor. The dimensions of the Fresnel lens replicated on the glucose sensor were investigated under the microscope in dry and hydrated (swelling/deswelling) conditions to determine the working principle of the sensor. An optical setup consisting of a laser pointer of 532 nm wavelength, a movable holder for the Fresnel lenses, and another movable holder for the photodetector, was used to measure the focal lengths and to interrogate the glucose sensor. A beam shape was used in the optical setup for the focal length measurements to accurately detect the focal length; however, for interrogating the glucose sensor it was excluded from the setup as it required large size samples (2 cm diameter) to be tested. Additionally, glucose detection tests relied on recording the optical power changes by picking up the zero-diffraction order as it is more practical than measuring the focal length changes. The ambient light sensor of a smartphone was exploited for detecting the sensor's signal by using a built-in app. for facilitating the readout methodology. Influence of the attached glucose sensor on the clarity of the used commercial contact lenses was examined by recording the transmission spectra by a UV–vis spectrophotometer (HL-2000, Ocean Optics) attached to an optical microscope (Zeiss, 20× objective lens). Transmission spectra of the contact lens’ central zone were recorded and were compared to the transmission spectra taken at the Fresnel structure zone. Effect of the attached sensor on the wettability of the contact lens was carried out by the sessile droplet method that was adopted to measure the static contact angle for the contact lenses in the central zones and at the edge, where Fresnel structure was imprinted. Drops of DI water (10 µL) were pipetted on central zones and edges of the flattened surface of the contact lens. Images for the drops were captured and the contact angles were deduced from their drawn tangents using ImageJ software.
Acknowledgements
The authors acknowledge Khalifa University of Science and Technology (KUST) for the Faculty Startup Project (Project code: 8474000211- FSU-2019-04) and KU-KAIST Joint Research Center (Project code: 8474000220-KKJRC-2019-Health1) research funding in support of this research. H.B. acknowledges Sandooq Al Watan LLC for research funding (SWARD Program – AWARD Ref. SWARD-F19-008). A.K.Y. thanks the Engineering and Physical Sciences Research Council (EPSRC) for a New Investigator Award (EP/T013567/1).
Conflict of Interest
The authors declare no conflict of interest.
Open Research
Data Availability Statement
The data that support the findings of this study are available from the corresponding author upon reasonable request.


