Explainable machine learning for phishing feature detection
Present address:
Department of Electrical, Computer and Biomedical Engineering, Università di Pavia, Via Ferrata, 5, I-27100, Pavia, Italy
Abstract
Phishing is a very dangerous security threat that affects individuals as well as companies and organizations. To fight the risks associated with this threat, it is important to detect phishing websites in a timely manner. Machine learning models work well for this purpose as they can predict phishing cases, using information on the underlying websites. In this paper, we contribute to the research on the detection of phishing websites by proposing an explainable machine learning model that can provide not only accurate predictions of phishing, but also explanations of which features are most likely associated with phishing websites. To this aim, we propose a novel feature selection model based on Lorenz Zonoids, the multidimensional extension of Gini coefficient. We illustrate our proposal on a real dataset that contains features of both phishing and legitimate websites.
1 INTRODUCTION
Phishing is a major security threat and one of the most commonly used attack vectors. For example, many ransomware attacks start with a phishing campaign against the victim companies or organizations. Similarly, data breaches frequently feature phishing.
Phishing campaigns are technologically simple to implement. Attackers need to create websites that look very similar to the legitimate counterparts they are trying to impersonate and spread the links using spoofed email messages or other communication channels. By leveraging advanced social engineering techniques, attackers manipulate their victims and convince them into clicking the links leading to malicious websites where these individuals are urged to reveal various types of sensitive data, such as account credentials, credit card or bank account details or other important financial or personal information.
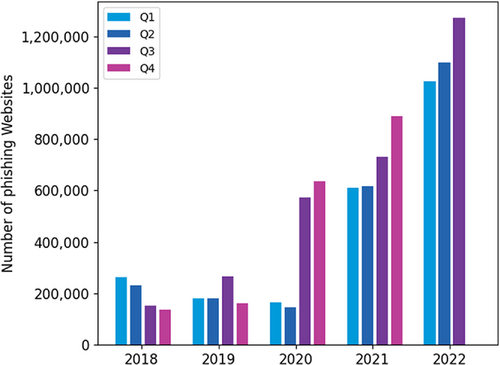
Despite their simple implementation, these fraudulent attacks are very dangerous and might lead to various types of damages, such as monetary losses, identity thefts, and reputation damages. As indicated in the Phishing Activity Trends Report1 published by Anti-Phishing Working Group (APWG) in December 2022, in total 1,270,883 phishing websites have been observed in the third quarter of 2022. As can be seen from the quarterly trend of phishing websites detected since 2018, shown in Figure 1, this number represents a new record, thus making this quarter the worst for phishing. This rise is partly due to the large numbers of attacks from persistent phishers against several specific targets.
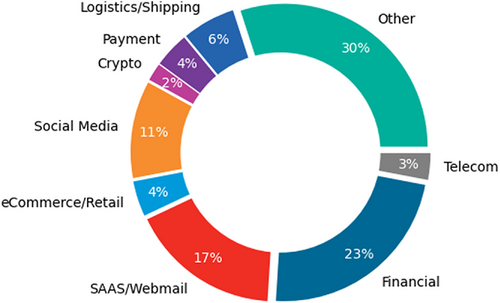
It is also interesting to analyze in Figure 2 the industry sectors targeted by attacks in the third quarter of 2022. The financial sector, which includes banks, was affected by the largest fraction of attacks, that is, 23%. Moreover, the phishing attacks against the logistics and shipping sector almost doubled since the first quarter of 2022 (i.e., from 3.8% to 6%), mainly because of the large increase of attacks against the US Postal Service.
To protect individuals from the risks deriving from phishing attacks, the detection of phishing websites is of paramount importance (see, for example, Zieni et al.1). Approaches based on machine learning are particularly suitable for classifying sites as either phishing or legitimate. Features are typically extracted from the links used to reach the websites, that is, the Uniform Resource Locators (URLs), and from the page source codes. These features have to take into account the characteristics that differentiate the two classes of websites as well as the strategies implemented by attackers to deceive individuals.
In this context, the explainability of machine learning models plays a fundamental role for understanding the decisions taken by machine learning algorithms. In this paper, we address these issues by proposing a methodology that allows us to identify the most important features that explain the model. This methodology is supported by an experimental application that considers a dataset consisting of phishing and legitimate URLs, each described by 74 features.
The rest of the paper is organized as follows. After a summary of the state of the art in the field of phishing detection, provided in Section 2, Section 3 formulates the methodology proposed to make machine learning models explainable. The setup of the experiments carried out to test this methodology is presented in Section 4, while the experimental results are discussed in Section 5. Finally, some concluding remarks are given in Section 6.
2 RELATED WORK
The detection of phishing websites is an important topic that received a significant attention by the research community. This topic has been investigated under different perspectives. Some solutions focus on the creation and maintenance of lists of phishing and legitimate websites, that is, blacklists and whitelists.2-7 Other solutions consider the textual and visual similarity of suspicious web pages and legitimate pages identified as potential targets of phishing attacks.8-13 Many other solutions are based on machine learning models.14-23
The main contributions offered by the literature are analyzed and discussed in a recent survey by Zieni et al.1 In the context of machine learning, the survey highlights that phishing detection approaches mainly differ for the features chosen to describe the properties of the websites and for the learning algorithms applied for the classification of the websites. The features considered in some papers24, 25 refer to the lexical and statistical properties of URL strings (i.e., URL-based features), whereas in other papers,26, 27 they refer to the content and visual appearance of a page (i.e., HTML-based features).
In general, URL-based features are fast to extract because they do not require any page download, thus allowing for a real-time detection of phishing websites and coping with the so-called zero-hour attacks. Nevertheless, these features are vulnerable to the link manipulation commonly performed by attackers to deceive individuals into believing that the link belongs to a well-known trusted party. On the contrary, HTML-based features are robust to the evasion strategies as well to the obfuscation and cloaking techniques implemented by attackers. However, the extraction of these features might introduce safety and security issues as well as delays related to the page download. It is important to point out that third-party services, such as search engines and DNS, have also been used to extract features.15, 24 These features complement and enhance the description of the websites, even though their extraction introduces significant delays. To classify websites as phishing or legitimate, a large variety of supervised machine learning algorithms has been considered in the literature.28 State-of-the-art traditional algorithms, such as Support Vector Machine, Random Forest, Logistic Regression, are commonly applied. It is interesting to outline that in many papers,14, 22 the performance of different algorithms is compared to identify the best one for the given set of features and dataset.
Although machine learning approaches have been extensively investigated, the explainability of the models has been addressed to a very limited extent29 as also suggested by recent surveys on cyber security attacks.30, 31
Our work tries to fill this gap by proposing a methodological approach to make the machine learning models implemented for detecting phishing websites explainable.
3 METHODOLOGY
In this section, we present our main methodological contribution: an explainable machine learning procedure to determine the most important features that make a website phishing.
It is well known that nonlinear machine learning models can lead to predictions that are more accurate than those obtained with classical regression models.
Phishing website detection is a predictive classification problem, for which most predictors are categorical, suggesting that an ensemble of tree models could be an appropriate machine learning model to consider.
Ensembles of tree models, such as Random Forests and Gradient Boosting, have shown good performance in many applications.28 A Random Forest model averages the classifications obtained from a set of tree models, each of which based on a sample of training data and of explanatory variables. In a tree, the explanatory variables determine the splitting rules, with stopping decisions determined by the need to significantly reduce within group variability (as measured by the Gini coefficient, for example).
By averaging the results from many trees, a Random Forest model increases predictive accuracy at the expense of explainability. To overcome this weakness, explainable Artificial Intelligence models need to be employed.32, 33
To cope with explainability, Random Forest models produce variable importance plots. A variable importance plot associates with each predictor the reduction in the Gini index determined by it, averaged over all tree models. Although useful from a descriptive viewpoint, the variable importance plot does not identify the most significant predictors. In this paper, we fill this gap by proposing a feature selection procedure based on Lorenz Zonoids, the multidimensional generalization of the Gini coefficient.
Lorenz Zonoids were introduced as a generalization of the Gini coefficient in a multidimensional setting.34 They were further developed by Giudici and Raffinetti35 who proposed a Lorenz decomposition approach that can be employed for model comparison purposes.
The key benefit related to the employment of the Lorenz Zonoid tool is the possibility of evaluating the contribution associated with any explanatory variable to the whole model prediction with a normalized measure that can be used to assess the (additional) importance of each variable.
Given a variable Y and n observations, the Lorenz Zonoid can be defined by the Lorenz and the dual Lorenz curve.34 The Lorenz curve for a variable Y—denoted with and obtained by re-arranging the Y values in nondecreasing order—has points whose coordinates can be specified as , for , where r and indicate the (nondecreasing) ranks of Y and its mean value, respectively. Similarly, the dual Lorenz curve of Y—denoted as and obtained by re-arranging the Y values in a nonincreasing order—has points with coordinates , for , where d indicates the (nonincreasing) ranks of Y. The area lying between the and curves corresponds to the Lorenz Zonoid.
A model comparison procedure can then be implemented by considering the term , which measures the additional contribution of a feature to the predictive accuracy of a model, thus evaluating its relative importance.
To decide the order in which to insert the variables in model comparison, various possibilities can be considered. For example, one possibility is to use the order determined by the variable importance plot.
4 EXPERIMENTAL SETUP
The setup of the experiments carried out to test the proposed methodology refers to the creation of a dataset of legitimate and phishing websites, the extraction of meaningful features describing the websites and the selection of the most relevant features. For this purpose, a Python script has been developed. The code as well as the dataset are available upon request to the authors.
In what follows, we present the details of the experimental setup. We outline that the features being extracted are related to the website URLs.
4.1 Data collection
To test the proposed approach, real data referring to the URLs of phishing and legitimate websites has been collected from two sources, namely, PhishTank 2 and Tranco 3. PhishTank is a community repository that provides information about phishing websites and enables anyone to submit, verify, share, or track phishing data. This data refers to URLs related to active phishing websites together with some details about these sites, such as submission time, whether the website is online and whether has been verified. The source of data for legitimate websites is Tranco, a research-oriented online service, which provides the top one million ranked domains.
In summary, we collected a balanced dataset consisting of 5000 URLs referring to phishing websites and 5000 URLs referring to legitimate websites.

4.2 Feature extraction
- Scheme, which specifies the protocol used for making the request;
- Authority, which specifies the Fully Qualified Domain Name of the server hosting the website and its two main components, that is, second level domain and top-level domain;
- Pathname of the resource being requested, that includes the folder as well as the filename;
- Optional parameters corresponding, for example, to a query.
It is worth mentioning that even though all URLs share the same structure, URLs of phishing websites are generally different from the URLs of legitimate websites. In fact, attackers craft the URLs of their sites to make them look as similar as possible to URLs of legitimate ones. Hence, the feature extraction process should take into account these differences and in particular, the tactics and strategies applied by attackers to deceive individuals.
-
Number of symbols
These features refer to the occurrence of 17 different symbols inside the entire URLs and in the identified components. In fact, an unusual number of symbols is a strong indicator of a phishing URL. For example, the domain name of a phishing URL often contains a larger number of dots with respect to its legitimate counterpart, which usually includes no more than three dots. Another example is represented by the use of dash symbol. This symbol is rarely used in legitimate URLs, while it is frequently used in phishing URLs to add a prefix or a suffix to the domain name, thus creating a domain name similar to the name of a known legitimate website.
-
Length
These features take into account the length, that is, the number of characters of the entire URL and of its individual components. In general, attackers tend to use long URLs to confuse individual and make them believe that the URL is legitimate.
-
IP address in the domain
This is a binary feature used to indicate the presence of an IP address instead of the Fully Qualified Domain Name inside a URL. In general, IP addresses are seldom used in legitimate URLs because names give webmasters a larger degree of flexibility in the deployment of their websites.
Additional features refer to the number of vowels in the domain name, the presence of an email address in the URL, the presence of the words, such as “server” or “client” in the domain name and the number of parameters.
| Feature | Description | Type |
|---|---|---|
| num_dots_url | Number of “.” symbols | Numerical |
| num_hyph_url | Number of “-” symbols | Numerical |
| num_undeline_url | Number of “_” symbols | Numerical |
| num_slash_url | Number of “/” symbols | Numerical |
| num_questionmark_url | Number of“?” symbols | Numerical |
| num_equal_url | Number of “=” symbols | Numerical |
| at_sign_url | Number of “@” symbols | Numerical |
| num_and_url | Number of “&” symbols | Numerical |
| num_exclamation_url | Number of “!” symbols | Numerical |
| num_space_url | Number of “ ” symbols | Numerical |
| tilde_url | Number of “~” symbols | Numerical |
| num_comma_url | Number of “,” symbols | Numerical |
| num_plus_url | Number of “+” symbols | Numerical |
| num_asterisk_url | Number of “*” symbols | Numerical |
| num_hashtag_url | Number of “#” symbols | Numerical |
| num_dollar_url | Number of “$” symbols | Numerical |
| num_percent_url | Number of “%” symbols | Numerical |
| num_tld_url | Top level domain length | Numerical |
| length_url | URL length | Numerical |
| email_in_url | Presence of an email in URL | Binary |
| Feature | Description | Type |
|---|---|---|
| num_dots_dom | Number of “.” symbols | Numerical |
| num_hyph_dom | Number of “-” symbols | Numerical |
| num_undeline_dom | Number of “_” symbols | Numerical |
| num_vowels_dom | Number of vowels | Numerical |
| length_dom | Domain length | Numerical |
| dom_in_ip | Domain in IP format | Binary |
| server_client_dom | Presence of “server” or “client” | Binary |
| Feature | Description | Type |
|---|---|---|
| num_dots_path | Number of “.” symbols | Numerical |
| num_hyph_path | Number of “-” symbols | Numerical |
| num_undeline_path | Number of “_” symbols | Numerical |
| num_slash_path | Number of “/” symbols | Numerical |
| num_equal_path | Number of “=” symbols | Numerical |
| at_sign_path | Number of “@” symbols | Numerical |
| num_and_path | Number of “&” symbols | Numerical |
| num_exclamation_path | Number of “!” symbols | Numerical |
| num_space_path | Number of “ ” symbols | Numerical |
| tilde_path | Number of “~” symbols | Numerical |
| num_comma_path | Number of “,” symbols | Numerical |
| num_plus_path | Number of “+” symbols | Numerical |
| num_asterisk_path | Number of “*” symbols | Numerical |
| num_percent_path | Number of “%” symbols | Numerical |
| length_path | Path length | Numerical |
| Feature | Description | Type |
|---|---|---|
| num_dots_file | Number of “.” symbols | Numerical |
| num_hyph_file | Number of “-” symbols | Numerical |
| num_undeline_file | Number of “_” symbols | Numerical |
| num_equal_file | Number of “=” symbols | Numerical |
| at_sign_file | Number of “@” symbols | Numerical |
| num_and_file | Number of “&” symbols | Numerical |
| num_exclamation_file | Number of “!” symbols | Numerical |
| num_space_file | Number of “ ” symbols | Numerical |
| tilde_file | Number of “~” symbols | Numerical |
| num_comma_file | Number of “,” symbols | Numerical |
| num_plus_file | Number of “+” symbols | Numerical |
| num_percent_file | Number of “%” symbols | Numerical |
| length_file | File length | Numerical |
| Feature | Description | Type |
|---|---|---|
| num_dots_param | Number of “.” symbols | Numerical |
| num_hyph_param | Number of “-” symbols | Numerical |
| num_undeline_param | Number of “_” symbols | Numerical |
| num_slash_param | Number of “/” symbols | Numerical |
| num_questionmark_param | Number of “?” symbols | Numerical |
| num_equal_param | Number of “=” symbols | Numerical |
| at_sign_param | Number of “@” symbols | Numerical |
| num_and_param | Number of “&” symbols | Numerical |
| num_exclamation_param | Number of “!” symbols | Numerical |
| num_space_param | Number of “ ” symbols | Numerical |
| tilde_param | Number of “~” symbols | Numerical |
| num_comma_param | Number of “,” symbols | Numerical |
| num_plus_param | Number of “+” symbols | Numerical |
| num_asterisk_param | Number of “*” symbols | Numerical |
| num_dollar_param | Number of “$” symbols | Numerical |
| num_percent_param | Number of “%” symbols | Numerical |
| length_param | Parameters part length | Numerical |
| tld_in_param | Presence of TLD | Binary |
| num_param | Number of parameters | Numerical |
4.3 Feature selection
The most relevant features are selected out of the extracted ones by applying statistical methods. In particular, the features able to differentiate phishing and legitimate websites are favored and selected. To assess the importance of the features, an exploratory analysis for each feature is applied. To further ensure the validity of the choice of the selected features, Gini index, which measures the quality of variables, is applied. At the end of this step 26 features are considered as the most important features.
5 EXPERIMENTAL RESULTS
This section summarizes the main results obtained by applying the proposed methodology to select the most important features that make a website phishing. We first consider the importance of each feature from an exploratory viewpoint. To this aim, Figure 4 compares the length of the domain name in legitimate URLs and in phishing URLs.

The figure shows a clear difference in the two distributions; a difference that is more evident in terms of variability rather than in location.
Another example is provided in Figure 5, which compares the distribution of the number of dots in the two populations. This figure confirms the difference in variability between the two populations. A difference that can be well captured, being the variables categorical, by the Gini index.

In this respect, Figure 6A plots the Gini index for each feature, normalized by URL, domain name, pathname, filename, and parameters. The smaller the area corresponding to each feature, the larger its (marginal) Gini index and, therefore, its discriminatory capacity to identify phishing websites.
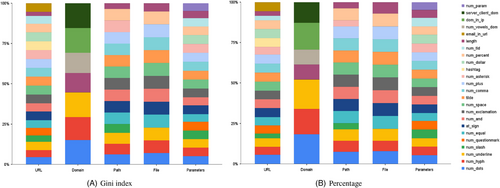
We can observe that the features with the smallest Gini index appear to be length, number of vowels, and number of dots.
A different exploratory plot is obtained by comparing for each feature the percentage of phishing websites, that is, comparing the location rather than the variability (see Figure 6B). This figure is consistent with Figure 6A although it does not indicate the most important variables as clearly as Gini index does.
We now move to the application of machine learning models and, specifically, of a Random Forest model, using Gini index as the main criterion for splitting variables in the different trees. Note that this is consistent with the use of the Gini index in the exploratory analysis, the difference being that the effect of each feature is measured with a multivariate model rather than with a univariate measure.
Figure 7 shows the feature importance plot obtained with the application of a Random Forest model.
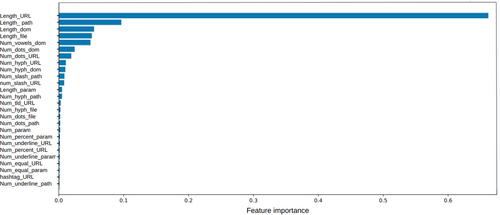
As can be seen, the most important feature for discriminating between phishing and nonphishing websites is the length of the URL, followed by the length of the pathname, followed by the others.
To decide which and how many features are relevant, we follow the proposed feature selection procedure. To this aim, we first order variables in terms of the importance plot shown in Figure 7: the variables that are highest in the variable importance plot are ranked first; those that are lowest are ranked last. We then calculate the Lorenz Zonoid of the model with only “length of the URL”: it turns out to be approximately equal to 0.4. We then move to the second ranked variable: “length of the pathname,” and calculate the Lorenz Zonoid of a model with both “length of the URL” and “length of the pathname”: it turns out to be approximately 0.45. We continue the procedure, adding variables into the model, following the ranking given by the feature importance plot. We stop adding when the cumulated Lorenz Zonoid does not increase further. This happens, in our application, when the first six variables are considered: no further addings improve by a significant amount the value of the Lorenz Zonoid. Figure 8 graphically depicts the results of the procedure. In the figure, variable numbers correspond to the ranking in Figure 7.
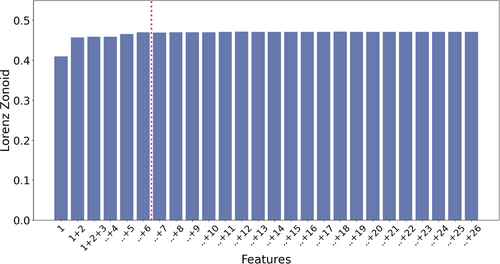
Figure 8 confirms that for our case study, six important features are able to detect phishing. These features are length of the URL, length of the pathname, length of the domain name, length of the filename, number of vowels, and number of dots in the domain name.
To evaluate the utility of our proposed selection procedure, we have calculated the Area Under the ROC Curve (AUC), before and after applying feature selection. It turns out that the AUC of the selected model (with six features) is about 0.96; whereas the AUC of a model with all features (74) is about the same, but with a much higher model complexity. We believe that this is a clear proof of concept for our proposed methodology.
6 CONCLUSION
This paper contains two main contributions. From an applied viewpoint, it proposes a model to identify the features of a website, which are more likely associated with phishing, using an explainable machine learning model. From a methodological viewpoint, it proposes a coherent statistical procedure, based on the Gini index, which allows us to examine at a glance the most important features, by means of a univariate exploratory analysis centered around the use of the Gini coefficient; build a multidimensional predictive model for phishing, based on the application of a Random Forest model, and a feature selection procedure centered around the Lorenz Zonoid (the multivariate extension of the Gini coefficient).
What proposed in the paper can be very useful for data scientists, statisticians, and security experts, for detecting and monitoring fraudulent attacks and designing new security systems, but also for regulators, controllers, and supervisors who might use this approach for daily monitoring practice.
ACKNOWLEDGMENTS
The authors thank two anonymous referees for useful suggestions.
Biographies
Maria C. Calzarossa is a Professor of Computer Engineering at the Department of Electrical, Computer, and Biomedical Engineering of the University of Pavia, Italy. Her research interests include performance evaluation and workload characterization of complex systems and services, cloud computing, and cybersecurity. She holds a Laurea degree in Mathematics from the University of Pavia.
Paolo Giudici is a Professor of Statistics at the Department of Economics and Management of the University of Pavia, Italy. His research interests include statistical learning for complex models and explainable artificial intelligence methods. He holds a Phd in Statistics from the University of Trento.
Rasha Zieni received the Master's degree in Computer Engineering from the University of Pavia, Italy. She is currently pursuing the Ph.D. degree in the Department of Electrical, Computer, and Biomedical Engineering, University of Pavia. Her research interests include cybersecurity focusing on phishing detection and machine learning.
Open Research
DATA AVAILABILITY STATEMENT
The data that supports the findings of this study are available on request from the corresponding author. The data are not publicly available due to privacy or ethical restrictions.


