Magnolia officinalis L. bark extract and respiratory diseases: From traditional Chinese medicine to western medicine via network target
Riccardo Fontana, Laura Beatrice Mattioli, and Raissa Buzzi contributed equally to this study.
Abstract
The understanding of the use of Magnolia officinalis L. (Magnoliaceae) as a possible dietary supplement for supporting the treatment of airway pathologies might be of clinical interest. Two commercially available bark extracts (M. officinalis extract [MOE]) were characterized by quantitation in honokiol and magnolol content by means of high-performance liquid chromatography with UV detection. MOE effects, as well as those of the reference compounds per se, on some targets connected to airway pathologies (antibacterial- and lung and trachea relaxing- activities) were investigated. Results showed that MOE possessed interesting antibacterial activity against Staphylococcus aureus, Pseudomonas aeruginosa, and Streptococcus pneumoniae. This was accompanied by a spasmolytic and antispasmodic activity, possibly owing to its ability to concurrently modulate different targets such as H1-, β2- and muscarinic receptors and l-type calcium channels involved in bronchodilation. All these effects were directly related to the MOE content in honokiol and magnolol. In conclusion, the properties of MOE highlighted here strongly encourage its application as dietary supplement in the treatment of airway diseases.
1 INTRODUCTION
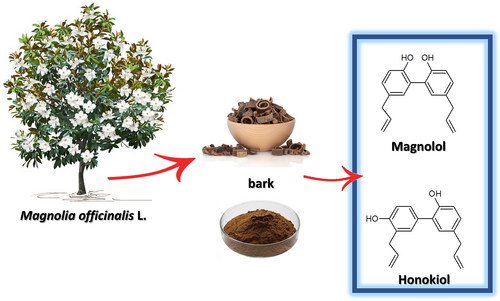
With the increasing number of emerging studies that emphasize the efficacy of traditional Chinese medicine (TCM), the western world is getting year by year closer to the TCM approach (Xu et al., 2013). This popular medicine is focused on plant-based therapies and remedies that date to ancient times in human history and are still widespread in different parts of the world (Leong et al., 2020). TCM is now considered an integral part of conventional medical practice, even though it is often an underestimated resource in the health field (Z. Liu et al., 2007; WHO, 2022). In recent years, both food therapy and medical diet therapy of TCM have been increasingly applied in clinical nutrition therapy (Wu & Liang, 2018). According to the Chinese Pharmacopoeia (Zhong-zhi et al., 2010), there are different drugs that are obtained from Magnolia parts; the most important is the bark called “Houpo” (厚朴). The Latin name is Magnoliae officinalis L. (Figure 1) and is represented by the dry bark of the stem that is dried in the shade (Luo et al., 2019; World Health Organization, Regional Office for the Western Pacific, 1989). M. officinalis L. cortex (MOC) is used for the treatment of countless pathologies (Zhou, 2003). The Chinese Pharmacopoeia reports its use for respiratory problems such as cough and asthma, intestinal disorders, and depressive states (Zhong-zhi et al., 2010). Magnolia bark is typically used as decoctions (intake range 3–10 g per person) and can also be found in the marketplace as ingredients of dietary supplements (Poivre & Duez, 2017).
The use of MOC in TCM as an antimicrobial and antiviral is found in numerous scientific studies that support its use also in western medicine (WM) (Bui et al., 2020; Hu et al., 2011; Lee et al., 2011). For its antibacterial activity, especially for oral diseases, M. officinalis extract (MOE) finds application as a component in chewing gum and toothpaste (Greenberg et al., 2007, 2008). In addition, the characteristic neolignans honokiol and magnolol have been extensively studied also from a toxicological point of view, demonstrating a good safety profile (Sarrica et al., 2018).
The urge to discover novel antibacterial molecules has prompted researchers to study ancient remedies, as these are the results of the largest clinical study ever conducted by humanity. The World Health Organization has drawn up a list of bacteria, for which new therapeutic strategies are needed, that includes as major pathogens: Pseudomonas aeruginosa (carbapenem-resistant), Staphylococcus aureus (methicillin and vancomycin resistant), and Streptococcus pneumoniae (penicillin-non-susceptible) (Tacconelli, 2017). In this context, TCM offers several opportunities for the discovery of new active phytocomplexes with antibacterial activity, thanks to the wide variety of plants applied in remedies.
On the other hand, the concept of network target is the basis of TCM and explains how the mix of multiple phytotherapeutic components acts on multiple aspects of the pathology (Li & Zhang, 2013; Z.-H. Liu & Sun, 2012). In view of a multiple targeting activity and to advance the understanding of the best use of M. officinalis as possible dietary supplement, the aim of the study was to investigate the effects of different bark extracts as well as those of the reference compounds honokiol and magnolol, on some targets connected to airway pathologies (antibacterial and lung and trachea relaxing activity), in line with the network target approach for the application of phytocomplexes as food supplement in a perspective of an integrated therapy (Mattioli et al., 2022).
2 MATERIALS AND METHODS
2.1 Plants materials and chemicals
Magnolia bark extracts used were KPC (supplied by Kaiser Pharmaceutical Co., 25 Pandan Cres, #01-11, Singapore 128477, www.kpc.com, and distributed by Qiu Tian via Biagio di Santolino 15, San Marino, SN 47890, 47892 Acquaviva, Italy) and Fagron (supplied by FAGRON, Via L. Lazzari L. 440057 Quarto Inferiore, Bologna, Italy, fagron.com/it/fagron-italia). The purity of all the considered compounds was higher than 99%.
2.2 Phytochemical analysis
2.2.1 Chemicals and solutions
The standard compounds magnolol and honokiol were from Extrasynthese SAS (Geney-France). Formic acid (≥98%) and acetonitrile (High Performance Liquid Chromatography [HPLC] grade) were from Sigma-Aldrich (Milan, Italy). Deionized water produced by a Milli-RX apparatus (Millipore, Milford, MA) was employed for the preparation of all solutions, buffers, and mobile phases.
2.2.2 Instrumentation and chromatographic conditions
Analytical separations for quantitation of the phytomarkers (magnolol and honokiol) in magnolia extracts were carried out on a Jasco HPLC chromatograph (2967-5 Ishikawamachi Hachioji-shi Tokyo Japan), equipped with a PU-1580 pump and a diode-array detector (DAD) model MD-910, using the integration program Borwin-PDA (Jasco Corporation, Tokyo, Japan). Manual injections were done using a Rheodyne model 7725i injector with a 20 μL sample loop. A Kinetex® F5 column (150 × 4.6 mm; 5 μm) by Phenomenex SrL (Castel Maggiore, Bologna, Italy) was used in isocratic mode with a mobile phase composed of aqueous formic acid (0.4%, v/v)—acetonitrile, 45/55 (v/v) at the flow rate of 1 mL/min. Detection was performed at 250 nm.
2.2.3 Sample preparation
The commercially available magnolia preparations by KPC (Kaiser Pharmaceutical Co., 25 Pandan Cres, #01-11, Singapore 128477) and Fagron (Fagron Italia, Via Lazzari L, 440057 Quarto Inferiore Bologna), were dispersed in deionized water (2 mg/mL) to carry out a solid–liquid extraction under ultrasonication in Sonorex Super RK 102 (35KMZ; Bandelin, Berlin, Germany) bath at room temperature for 10 min. The filtered solutions (syringe filter RC 0.45 μm, Millipore) were either directly injected (KPC preparations) or diluted (1/10, v/v) with deionized water (Fagron preparations) prior to the HPLC analysis.
2.2.4 Validation and application to real sample quantitation
Linearity was assessed in the range 0.001–0.05 mg/mL for both honokiol and magnolol; five-point calibration was obtained by plotting the response (Y, peak area of honokiol and magnolol) versus the concentration (C, mg/mL) for both analytes. System precision was assessed for retention time (tr) and peak area (A) by repeated analysis (n = 6) of standard solutions (concentration of 0.005 mg/mL). Accuracy was estimated by recovery experiments performed by spiking the real samples (2 mg to be extracted with 1 mL of deionized water) with known amounts of the two standard compounds. In detail, KPC preparation was spiked with 1 μg of both honokiol and magnolol, whereas the Fagron preparation was spiked with 10 μg of both analytes. Upon the sample treatment and HPLC analysis as described above, quantitation of the analytes was obtained by interpolation with the calibration graph. The sensitivity of the method was established by serial dilution of standard solutions to obtain a signal response (peak area) for the compounds equal to 10 times (Limit of Quantitation [LOQ]) and three times (Limit of Detection, LOD) the baseline noise.
2.3 Antimicrobial activity
Bacterial strains and culture conditions: Bacterial isolates used in this study were purchased from the American Type Culture Collection (ATCC): S. aureus (ATCC 25923), P. aeruginosa (ATCC 89033), and S. pneumoniae (ATCC 49619). Stocks of the bacterial strains were conserved at −80°C in Luria-Bertani (LB) broth with 50% glycerol. During the study, bacteria were inoculated in LB and were plated on Tryptic soy agar (TSA) (Scharlab Italia, Riozzo di Cerro al Lambro, MI, Italy), Muller Hinton agar (MHA), or LB agar (Liofilchem, Roseto degli Abruzzi, TE, Italy) and incubated at 35/37°C.
2.3.1 Determination of the minimum inhibitory concentration and minimum bactericidal concentration of different M. officinalis bark extracts
Minimum inhibitory concentration (MIC) is defined as the lowest concentration of a substance that blocks visible bacterial growth after an overnight incubation. In order to determine the MIC, the tube-dilution method was used. Bacterial strains were cultured in LB overnight at 35°C, 150 rpm. Magnolia extracts of 400 μL (10 mg/mL stock concentration), were added to 1600 μL of LB, to obtain 2 mg/mL concentration in the first bacterial culture tube (Becton Dickinson Italia, Milano, Italy). Magnolia extracts of 200 μL (1 mg/mL stock concentration) were added to 1800 μL of LB, to obtain 100 μg/mL concentration in the first bacterial culture tube. The extracts and the standards were diluted in serial tubes to obtain a range of concentrations from 2 to 0.01 mg/mL for extracts, from 100 to 0.001 μg/mL, in a total volume of 2 mL. Then, the overnight cultures were inoculated into each well, standardized being a 104 colony forming unit (CFU)/mL inoculum. The tubes were then incubated for 24 h at 36°C. The MIC was determined as the lowest concentration of the extracts at which no increase in turbidity occurred. To confirm, the absorbance trout optical density (OD600) of each suspension was measured with a spectrophotometer (Eppendorff BioSpectrometer, Eppendorf AG, Hamburg, Germany). For the evaluation of minimum bactericidal concentration (MBC) and the total microbial count, the inclusion method was chosen. Based on the obtained values, the suspension showing clarity was diluted accordingly and plated together with melted TSA in sterile Petri dishes. Plates were then placed in a static incubator at 37°C for 24 h. Once the incubation period ended, the bacterial colonies that had eventually grown were counted.
2.3.2 Biofilm formation
Effects on biofilm formation were determined by the microplate assay with crystal violet, as described by Su et al. (S. J. Ko et al., 2019; Su et al., 2020). Bacterial suspensions containing 106 CFU/mL were inoculated in LB with MOE at their non-lethal concentration in a 96-well U-bottom microplate for 24 h at 36°C under constant agitation of 160 rpm. After the incubation time, the growth media, extracts, and planktonic cells were removed from the plate and washed with phosphate buffer saline (PBS). Crystal violet 1% was added to each well and incubated for 30 min at room temperature. Then, the dye solution was removed by washing the plate three times with PBS. 200 μL of decoloring solution (90%–95% ethanol) were then added to each well and incubated for 15 min at room temperature to increase crystal violet solubility. The 96-well plate content was then transferred to a new, clean microplate, and biofilm formation was quantified by reading the absorbance at 570 nm in a microplate reader (Tecan-Sunrise, Tecan Italia, Cernusco sul Naviglio, MI, Italy).
2.3.3 24- and 48-h biofilm removal
Effects on biofilm removal were determined by the microplate assay with crystal violet, as described by Wilson et al. (2017). Bacterial suspensions, containing 106 CFU/mL, were inoculated in LB in a 96-well U-bottom microplate for 24/48 h at 36°C under the constant agitation of 160 rpm. Subsequently, each well was washed three times with PBS to remove media and any planktonic cells, taking care not to damage the formed biofilm. Then, the medium with the addition of the MOE or standards was added to each well. Non-lethal concentrations of the extracts (KPC and Fagron respectively) were tested: 1 and 0.5 mg/mL for S. aureus, 2 and 1 mg/mL for P. aeuruginosa and S. pneumoniae. For standards, the concentration of 100 and 10 μg/mL were tested for both honokiol and magnolol for all three bacterial strains. Plates were then placed in a static incubator at 37°C for 24 h. After the incubation period, each well was washed three times with PBS and 150 μL of crystal violet were added. After incubating the plates for 15 min at room temperature, the excess solution was removed by three washes with PBS. At each well, 150 μL of 90% ethanol was added to solubilize the biofilm. The OD of each well was then measured by spectrophotometer (570 nm). Bacterial suspensions not treated with extracts/standards were used as positive control.
2.3.4 Colorimetric analysis of cell viability of a 3-day biofilm
Effects on biofilm removal were determined by the microplate assay with crystal violet, as described by Wilson et al. (2017) and by Saising et al. (2012). Bacterial suspensions, containing 106 CFU/mL, were inoculated in LB broth in a 96-well U-bottom microplate for 72 h at 36°C under the constant agitation of 160 rpm. Media was changed daily. Subsequently, each well was washed three times with PBS to remove media and any planktonic cells, taking care not to damage the formed biofilm. Then, the medium with the addition of the extracts or standards was added to each well. Non-lethal concentrations of the extracts (KPC and Fagron respectively) were tested: 1 and 0.5 mg/mL for S. aureus, 2 and 1 mg/mL for P. aeuruginosa and S. pneumoniae. For standards, the concentration of 100 and 10 μg/mL were tested for both honokiol and magnolol for all three bacterial strains. Plates were then incubated for 24 h at 36°C. Then, the supernatant was removed and each well containing 50 μg of methylthiazoltetrazolium (MTT) was filled with PBS. Once the formazan crystals formed, they were solubilized by the addition of dimethyl sulfoxide (DMSO). Since MTT is a photosensitive compound, operations were performed in the dark. The OD of each well was then measured by spectrophotometer (570 nm). Untreated bacterial suspensions were used as positive control.
2.3.5 Indirect analysis of membrane permeability
To assess whether extracts of M. officinalis (KPC and Fagron) and honokiol and magnolol standards interfere with the permeability of the bacterial membrane of S. aureus, P. aeruginosa, and S. pneumoniae, bacterial DNA/RNA loss has been evaluated (Carson et al., 2002; Yasir et al., 2019). Bacterial suspensions, in the stationary phase of growth, were inoculated in 1 mL of Mueller-Hinton broth and incubated at 37°C for 18 h under constant agitation. Following incubation, bacteria were separated from the growth medium by centrifugation at 10,000g for 12 min at 4°C, washed twice with PBS, and re-suspended in PBS. After that, 107 CFU/mL bacterial suspensions were incubated at room temperature after being added with KPC and Fagron extracts at their MIC and non-lethal concentrations, and at their MIC concentrations. The absorbance (OD260) of the treated samples was measured after 0, 30, 60, and 90 min, to detect any loss of DNA and/or RNA from bacterial cells. An untreated bacterial suspension of each of the three bacterial strains was used as a negative control.
2.4 In vitro assessment of trachea and lung relaxation
Animals: Guinea pigs of either sex (200–400 g) obtained from Charles River (Calco, Como, Italy) were used. They were housed according to the ECC Council Directive regarding the protection of animals used for experimental and other scientific purposes. All procedures followed the guidelines of Animal Care and Use Committee of the University of Bologna (Protocol PR 21.79.14). After the explant, the trachea and lung were rapidly set up under a suitable resting tension in a 15 mL organ bath containing an appropriate physiological salt solution (PSS) consistently warmed (see below) and buffered to pH 7.4 by saturation with 95% O2–5% CO2 gas.
Guinea pig trachea: The method described by Budriesi et al. (2011) was modified as described below. The trachea was cut transversely between the segment of cartilage and four groups of tracheal segments, each one made up of three rings, were tied together and mounted under a tension of 1 g at 37°C in an organ bath containing Krebs–Ringer solution of the following composition (mM): NaCl 95, KCl 4.7, CaCl2 2.50, MgSO4 1.0, KH2PO4 1.17, NaHCO3 25, and glucose 10.6, equilibrated with 95% O2–5% CO2 gas at pH 7.4. The tissues were allowed to stabilize for 90 min. The tension was recorded isometrically.
Guinea pig lung: The procedure was previously described (Micucci et al., 2015). Briefly, strips of peripheral lung tissue, approximately 15 × 2 × 2 mm, were cut either from the body of a lower lobe with the longitudinal axis of the strip parallel to the bronchus or from the peripheral margin of the lobe and set up under 0.3 g tension at 37°C in organ baths containing Krebs–Henseleit buffer solution of the following composition (mM): NaCl 118.78, KCI 4.32, CaCl2 2.52, MgSO4 1.18, KH2PO4 1.28, NaHCO3 25, and glucose 5.5. Tension changes were recorded isometrically.
2.4.1 Induced contractility
l-type calcium channel (LTCC)
Trachea and lung spasmolytic activity mediated by calcium channels was studied using tissues contracted by 80 mM K+-concentration. Tension changes were recorded isometrically as previously described, using nifedipine as a positive control (Micucci et al., 2016).
β2-agonist activity
Trachea was prepared as previously described (Budriesi et al., 2011). The rings were allowed to stabilize for 60 min. A constant tone level was induced by carbachol (CCh) chloride (non-selective muscarinic agonist) (0.5 μM), and after 15 min, a cumulative concentration-response curve to isoprenaline, MOE, magnolol and honokiol was obtained. All responses to different concentrations of compounds and extracts were expressed as percentages of the maximal relaxation. To investigate the involvement of β2-receptors in the effects elicited by MOEs and the reference compounds, concentration-response curves of relaxing activity were obtained in the presence of the selective, competitive β2-antagonist butoxamine.
H1 antagonist activity
Trachea was prepared as previously described (Budriesi et al., 2011). The tissues were allowed to stabilize for 90 min during which time the bathing solution was changed every 15 min. A concentration-response curve for histamine (0.01–500 μM) taken as a control was obtained. Following incubation with the antagonists (MOE, magnolol, and honokiol) for 30 min, a new concentration-response curve to the agonist (histamine) was obtained either in the presence or 1 h after the removal of the antagonist (MOE or standards). The selective H1-antagonist diphenhydramine was taken as a reference antagonist (positive control).
Muscarinic antagonist activity
Lung and trachea strips were allowed to stabilize for 90 or 60 min, respectively, and the tension was recorded isometrically (trachea) or isotonically (lung). The cumulative response curves to CCh (0.01–1 μM trachea; 0.1–100 μM lung) were constructed and taken as controls. After a washing period (about 60 min) a new cumulative concentration-response curve was obtained in the presence of the antagonist (contact time 30 min). Atropine was used as a reference compound (positive control).
2.4.2 Spontaneous contractility
Spontaneous contractility was studied as previously described (Mattioli et al., 2022). Briefly, for the trachea and lung, the tracing graphs of spontaneous contractions (SCs) were continuously recorded with LabChart Software (ADInstruments, Bella Vista, NSW, Australia). After the equilibration period (about 30–45 min according to each tissue) cumulative-concentration curves of extracts and reference compounds were constructed. At the end of each single dose, the following parameters of the SC recording were evaluated considering a 5 min stationary period: the mean contraction amplitude (MCA), evaluated as the mean force value (in grams); the standard deviations of the force values over the period, as an index of the spontaneous contraction variability (SCV); and basal spontaneous motor activity (BSMA), as the percentage (%) variation of each mean force value (in grams) with respect to the control period. The SCs were investigated in the frequency domain through a standard FFT analysis and a subsequent power spectral density (PSD) plot. The absolute powers of the following frequency bands of interest—low [0.0,0.2] Hz (LF), medium [0.2,0.6] Hz (MF), and high [0.6,1.0] Hz (HF) (Micucci et al., 2020) were then calculated. The PSD percentage (%) variations for each band of interest with respect to control were estimated.
2.5 Statistical analysis
Data are reported as mean ± SEM, SD, or CL (confidential limit), as appropriate, and were obtained from at least three independent experiments. These were analyzed by using a one-way ANOVA followed by a Dunnett post hoc test (GraphPad prism version 9.0, GraphPad Software, San Diego, CA), and a p value <0.05 was considered significant. The potency of compounds, defined by IC50, was calculated from concentration-response curves according to Probit analysis by Litchfield and Wilcoxon (Tallarida & Murray, 1987) or GraphPad Prism (Motulsky, 2003, 2007). For competitive antagonism, dose ratios at the EC50 values of the agonists were calculated at three different concentrations, each of which was tested between three to five times, and the results expressed as pA2 values (Arunlakshana & Schild, 1959). For noncompetitive antagonism, the activity was estimated by determining the concentration of the noncompetitive antagonist that inhibited 50% of the maximum response to the agonist. Three different antagonist concentrations were used, and each concentration was tested at least four times.
For SC, data analysis was carried out in a post-processing phase by using the LabChart7 PRO software (AD Instruments; Bella Vista, NSW, Australia). To avoid errors due to the presence of artifacts, the period of analysis was chosen by a skilled operator.
3 RESULTS
3.1 Chemical characterization of M. officinalis L. bark extracts
The quality control of commercial Houpo samples was based on the quantification of honokiol and magnolol as both the compounds (Figure 1) are described as mainly responsible for the beneficial properties of magnolia bark extract (Lovecká et al., 2020) and their amount is considered as suitable attribute for quality assurance and standardization of M. officinalis L. bark extract samples (S. S.-K. Chan, Zhao, et al., 2008; Klein-Junior et al., 2021).
The applied HPLC-UV method allowed for a fast and selective separation of the two compounds in the KPC or Fagron samples. The validation data reported in Table 1 were found to be in line with previous reports (Usach et al., 2021) and show that the method is suitable for the intended purpose. In KPC preparation, the amounts of honokiol and magnolol were found to be 0.64 ± 0.032 mg/g (n = 3) and 1.02 ± 0.039 mg/g (n = 3), respectively; in Fagron preparation, amount of honokiol was 29.1 ± 1.39 mg/g (n = 3) and that of magnolol was 16.2 ± 0.81 mg/g (n = 3).
| Honokiol | Magnolol | |
|---|---|---|
| Linearity and sensitivity | ||
| Range, mg/mL | 0.001–0.05 | 0.001–0.05 |
| Equation | aY = 64,494.9x − 75.9 | aY = 16,179.5x − 15.7 |
| R2 | 0.9998 | 0.9998 |
| bLOQ, μg/mL c(RSD%) | 0.5 (2.30) | 0.7 (3.88) |
| bLOD, μg/mL | 0.1 | 0.3 |
| System precision | ||
| Retention time, min c(RSD%) | 3.9 (0.12) | 4.9 (0.22) |
| Peak area, mAU c(RSD%) | 278.3 (1.2) | 78.9 (1.8) |
| Recovery% c(RSD%) | ||
| KPC preparation (spike 1.0 μg) | 98.2 (3.2) | 97.5 (3.5) |
| Fagron preparation (spike 10.0 μg) | 98.8 (2.5) | 98.1 (3.1) |
- a Y is the UV response (peak area); x is the concentration in mg/mL.
- b LOQ and LOD are the limit of quantitation and limit of detection, respectively; they were established as the concentration of the analytes providing response equal to 10 times (LOQ) and 3 times (LOD) the baseline noise.
- c RSD% is the Relative Standard Deviation expressed as percentage, calculated over 3 samples (n = 3)
- d HPLC-UV is high performance liquid chromatography with ultraviolet light.
3.2 Antimicrobial activity
3.2.1 Evaluation of the MIC
In order to assess the MIC of the two M. officinalis L. extracts (KPC and Fagron) five different concentrations were tested on three bacterial strains, while of the two standards, honokiol and magnolol, six different concentrations were tested. The lowest concentration with bacteriostatic effect was identified as the suspension of the first tube that showed no turbidity. However, it was observed that, especially for Fagron extract, increasing concentrations corresponded to increasing turbidity. Therefore, the absorbance (OD600) of each suspension was measured using the spectrophotometer using the extract and standard solutions at the same concentration as blank. The results are shown in Table 2. Standard antibiotic solutions, considered the positive control, were initially used to assess bacterial sensitivity, with coherent results, but were not used during all experiments.
| Staphylococcus aureus | Pseudomonas aeruginosa | Streptococcus pneumoniae | ||
|---|---|---|---|---|
| Concentration | ||||
| KPC | 2 mg/mL | 0.000 ± 0.000 | 0.000 ± 0.000 | 0.000 ± 0.000 |
| 1 mg/mL | 0.003 ± 0.000 | 0.022 ± 0.003 | 0.227 ± 0.037 | |
| 500 μg/nL | 0.364 ± 0.081 | 0.205 ± 0.035 | 0.447 ± 0.076 | |
| 100 μg/mL | 0.360 ± 0.078 | 0.447 ± 0.060 | 0.560 ± 0.033 | |
| 10 μg/mL | 0.396 ± 0.053 | 0.483 ± 0.051 | 0.561 ± 0.041 | |
| Untreated | 0.569 ± 0.043 | 0.671 ± 0.039 | 0.580 ± 0.058 | |
| Fagron | 2 mg/mL | 0.000 ± 0.000 | 0.000 ± 0.000 | 0.000 ± 0.000 |
| 1 mg/mL | 0.000 ± 0.001 | 0.093 ± 0.006 | 0.191 ± 0.011 | |
| 500 μg/nL | 0.092 ± 0.005 | 0.087 ± 0.010 | 0.412 ± 0.037 | |
| 100 μg/mL | 0.037 ± 0.008 | 0.119 ± 0.022 | 0.560 ± 0.031 | |
| 10 μg/mL | 0.118 ± 0.011 | 0.428 ± 0.021 | 0.573 ± 0.028 | |
| Untreated | 0.569 ± 0.035 | 0.671 ± 0.083 | 0.580 ± 0.016 | |
| Honokiol | 100 μg/mL | 0.000 ± 0.000 | 0.000 ± 0.000 | 0.000 ± 0.000 |
| 10 μg/mL | 0.319 ± 0.011 | 0.295 ± 0.018 | 0.442 ± 0.021 | |
| 1 μg/nL | 0.473 ± 0.009 | 0.491 ± 0.011 | 0.540 ± 0.017 | |
| 0.1 μg/mL | 0.521 ± 0.031 | 0.580 ± 0.028 | 0.468 ± 0.019 | |
| 0.01 μg/mL | 0.420 ± 0.021 | 0.485 ± 0.04 | 0.403 ± 0.011 | |
| 0.001 μg/mL | 0.512 ± 0.01 | 0.518 ± 0.014 | 0.556 ± 0.018 | |
| Untreated | 0.569 ± 0.049 | 0.671 ± 0.036 | 0.580 ± 0.031 | |
| Magnolol | 100 μg/mL | 0.000 ± 0.000 | 0.000 ± 0.000 | 0.002 ± 0.000 |
| 10 μg/mL | 0.483 ± 0.023 | 0.386 ± 0.029 | 0.481 ± 0.009 | |
| 1 μg/nL | 0.468 ± 0.018 | 0.564 ± 0.021 | 0.525 ± 0.016 | |
| 0.1 μg/mL | 0.370 ± 0.025 | 0.551 ± 0.015 | 0.493 ± 0.028 | |
| 0.01 μg/mL | 0.364 ± 0.012 | 0.547 ± 0.013 | 0.481 ± 0.023 | |
| 0.001 μg/mL | 0.348 ± 0.013 | 0.601 ± 0.030 | 0.529 ± 0.021 | |
| Untreated | 0.569 ± 0.038 | 0.671 ± 0.020 | 0.580 ± 0.029 |
- Note: Data derived from the spectrophotometer absorbance readings and expressed as absorbance (A OD600). All data are presented as mean ± standard deviation obtained from statistical analysis.
3.2.2 Quantitative analysis of biofilm formation
The organization of bacteria in biofilms allows them to survive in unfavorable environments. This phenomenon allows bacteria to exert resistance more easily against the antimicrobial agents used to eradicate them, thanks to the different mechanisms of intercellular communication and quorum sensing (QS). Figure 2 shows a clear decrease in the formation of the biofilm of S. aureus, S. pneumoniae, and P. aeruginosa, compared with the control (consisting in the bacterial suspension only) for KPC extract at both MIC and non-lethal concentrations.
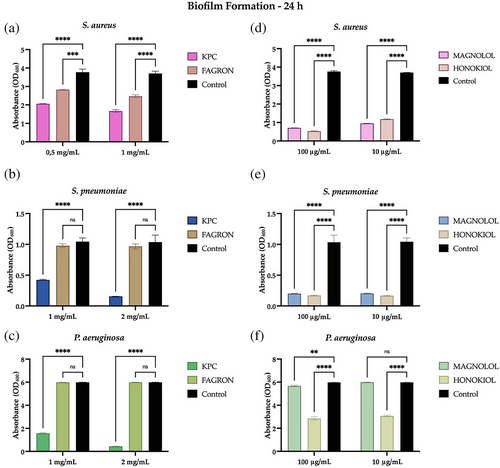
Regarding the Fagron extract, MIC and non-lethal concentrations were not sufficient to exert a significant inhibitory effect toward the formation of the biofilms of P. aeruginosa and S. pneumoniae, but otherwise showed significant anti-biofilm activity towards S. aureus at both 1 and 0.5 mg/mL. The standards in Figure 2 show significant anti-biofilm activity towards S. aureus and S. pneumoniae at both 100 and 10 μg/mL. As for P. aeruginosa, honokiol showed activity inhibiting the formation of biofilms at both MIC and non-lethal concentrations, unlike the magnolol standard, which showed good activity only at the MIC concentration of 100 μg/mL.
3.2.3 Quantitative analysis of the removal of a 24- and 48-h biofilm
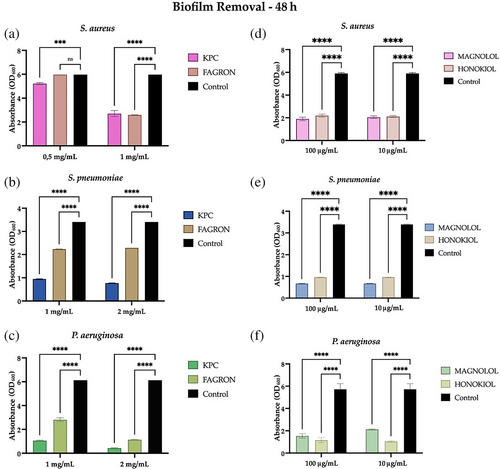
The biofilm organization allows bacteria to determine severe infections that are not easily eradicated; in this context, new antibacterial agents capable of intervening in the removal of the biofilm may be useful. Figure 3 shows that both KPC and Fagron extracts result in significant removal of a 24-h biofilm of S. aureus, S. pneumoniae, and P. aeruginosa compared to the control, both at MIC and non-lethal concentrations. In detail, the Fagron extract has a more pronounced activity towards S. aureus (Figure 3A), so that at a concentration of 1 mg/mL, it can remove the biofilm almost completely. An increased capacity to remove the biofilm of S. pneumoniae and P. aeruginosa is shown instead by the extract KPC (Figure 3B,C). In Figure 3 it can be observed that the standards also have a significant removal capacity of a 24 h biofilm of the three bacterial strains at both MIC and non-lethal concentrations. However, honokiol exercises this activity in a more marked way towards S. pneumoniae (Figure 3B).
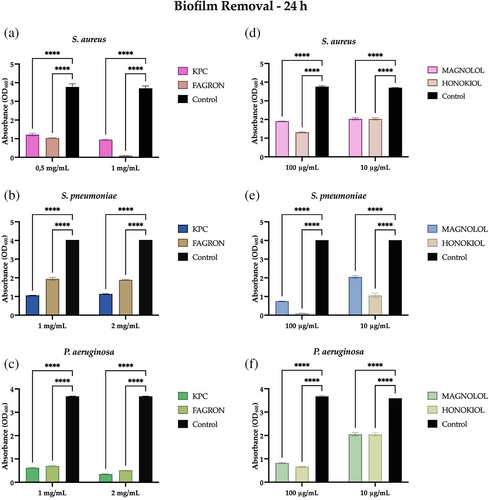
After evaluating the ability of MOE and the honokiol and magnolol standards to remove the bacterial aggregates of a 24-h biofilm, it was decided to test this capability against a more mature biofilm, a 48-h biofilm of the three bacterial strains.
In Figure 4A–C, KPC and Fagron extracts retain their ability to significantly remove the biofilm of S. pneumoniae and P. aeruginosa, although after 48 h (and therefore more mature). For S. aureus, KPC extract retains its ability to significantly remove the biofilm while Fagron extract has no significant anti-biofilm activity at a concentration of 0.5 mg/mL (Figure 4A). Figure 4D–F shows the results obtained for the standards, for which it is possible to confirm the ability to remove a biofilm of S. aureus, S. pneumoniae, and P. aeruginosa, even if it is more mature. In detail, although with little difference, honokiol presents more activity toward a 48-h biofilm of P. aeruginosa, while magnolol toward a 48-h biofilm of S. aureus and S. pneumoniae.
3.2.4 Colorimetric analysis of cell viability of a 3-day biofilm
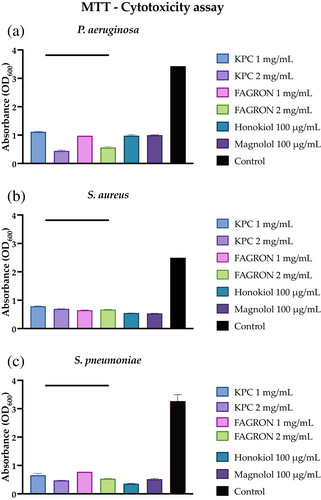
One aspect to consider in the evaluation of antibiofilm activity is the ability of the test compounds not only to alter the mechanisms of formation and removal of the biofilm, but also to influence the metabolic characteristics of the bacterial cells that constitute it. An indirect analysis was carried out on the viability of biofilm bacterial cells based upon the formation of formazan crystals following the reduction of MTT by the reductase enzymes of viable bacterial cells. The lower the presence of metabolically active cells within the biofilm, the lower the production of formazan crystals. Figure 5 shows that both extracts and standards significantly affect the cell viability of a 3-day biofilm of all three bacterial strains.
3.2.5 Indirect analysis of bacterial membrane permeability
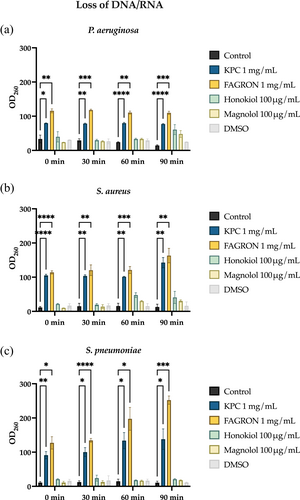
The analysis was carried out by adding extracts to bacterial suspensions at MIC and non-lethal concentrations and standards to their MIC concentration. This is an indirect investigation, as it assumes that the higher the amount of DNA/RNA detected in the surnatants, the greater the alteration of the cell membrane permeability caused by the extracts/standards. From Figure 6, it can be observed how KPC and Fagron can alter the cell membrane of all three bacterial strains, unlike the standards that were mostly ineffective.
3.3 In vitro assessment of spasmolytic activity: Pre-contracted trachea and/or lung
3.3.1 β2-receptor agonist activity
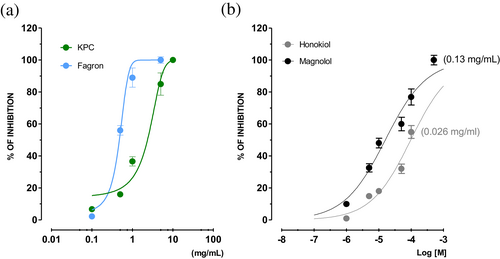
MOEs and the reference compounds were studied for their β2-agonist activity on guinea pig trachea pre-contracted with CCh (non-selective muscarinic agonist). All of them reverted the CCh-induced contraction in a concentration-dependent manner (Figure 7). Honokiol has intrinsic activity (IA) lower than 50%, while magnolol reaches 89% spasmolytic activity at 500 μM (EC50 = 15.19 μM, CL 10.85–20.30). The efficacy of magnolol (Table 3) is significantly lower than that of isoprenaline, which has a similar IA (84 ± 2.3%), but this was attained at at 0.5 μM; the same drug was also more potent, its IC50 being approximately 80 times lower than that of magnolol (isoprenaline IC50 = 0.17 μM, CL 0.04–0.35 μM). Interestingly, Fagron and KPC possess similar spasmolytic activity, although their maximum IA is reached at different concentrations (1 and 5 mg/mL, respectively). This is also reflected in the potency: Fagron is about four times more potent than KPC possibly owing to Fragron's higher content in magnolol and honokiol. The MOE, honokiol, and magnolol were further studied for their β2-mediated agonist effects by performing the concentration response curves in the presence of the selective β2-antagonist butoxamine, comparing their effects with those of isoprenaline (Table 3). Results showed that in the presence of butoxamine, the concentration-response curves of isoprenaline were shifted to the right. Interestingly, KPC, Fagron, magnolol, but not honokiol, exerted the same effect as isoprenaline, as highlighted by the comparable pA2 values of butoxamine.
| Trachea | |||||
|---|---|---|---|---|---|
| β2-adrenergic agonism | H1-receptor antagonism | ||||
| % Int. activity IAa | IC50b | 95% CL | IC50c | 95% CL | |
| KPC | 98 ± 2.6 (5 mg/mL) | 0.85 (mg/mL) | 0.26–1.03 | 0.86 (mg/mL) | 0.75–0.97 |
| Fagron | 99 ± 1.6 (1 mg/mL) | 0.21 (mg/mL) | 0.11–0.36 | 0.29 (mg/mL) | 0.087–0.32 |
| pA2d | |||||
| Honokiole | 35 ± 2.1 (100 μM) (0.026 mg/mL) | ND | ND | 5.68 ± 0.02 [0.00055 mg/mL] (0.00053–0.00058) | |
| Magnolole | 89 ± 1.8 (500 μM) (0.13 mg/mL) | 15.19 μM (0.0040 mg/mL) | 10.85–20.38 μM (0.0028–0.0054 mg/mL) | 5.27 ± 0.01 [0.0014 mg/mL] (0.0013–0.0015) | |
| Isoprenaline | 84 ± 2.3 (0.5 μM) (0.00012 mg/mL) | 0.17 μM (0.000042 mg/mL) | 0.04–0.35 (0.0000099–0.000086 mg/mL) | ||
| Diphenhydramine | 7.01 ± 0.03 [0.097 μg/mL] (0.091–0.10 μg/mL) | ||||
| β2-adrenergic antagonism of butaxamine vs. tested extracts and compounds | |
|---|---|
| KPC | 5.04 ± 0.3 (mg/mL) |
| Fagron | 5.69 ± 0.01 (mg/mL) |
| Honokiol | NA |
| Magnolole | 5.95 ± 0.1 [0.298 mg/mL] (0.291–0.306 μg/mL) |
| Isoprenaline | 5.80 ± 0.03 [481 μg/mL] (449–516 μg/mL) |
- Abbreviations: NA, not active; ND, not determined.
- a IA, Intrinsec activity expressed as percent inhibition of 0.5 μM CCh-induced contraction on guinea pig trachea tissues. Data are reported as mean ± SEM, while CL represent the confidence limits. In parenthesis the concentration that gives the maximum effect is reported.
- b IC50 (i.e., the concentration that inhibited 50% of the maximum contraction induced by CCh) was calculated from the concentration-response curves according to Probit analysis by Litchfield and Wilcoxon (Tallarida & Murray, 1987) (n = 6–7). When the maximum effect was <50%, the IC50 values were not calculated.
- c The IC50 of non-competitive antagonism was calculated using the inhibition induced by three different concentrations.
- d pA2 values ± SEM were calculated from Schild plots (Arunlakshana & Schild, 1959) constrained to a slope of −1.0, unless otherwise specified (Tallarida & Murray, 1987) pA2 is the positive value of the intercept of the line derived by plotting log(DR − 1) vs log [antagonist]. The log(DR − 1) was calculated at least at three different antagonist concentrations, and each concentration was tested from four to six times. Dose−ratio (DR) values represent the ratio of the potency of the agonist (EC50) in the presence of the antagonist and in its absence. Parallelism of dose–response curves was checked by linear regression, and the slopes were tested for significance (p < 0.05).
- e The results of honokiol and magnolol were expressed in both milligrams/milliliters and micromolar to better compare the results.
3.3.2 H1-receptor
Fagron and KPC exert a reversible non-competitive antagonist effect on the histaminergic receptors of the trachea (Table 3), the former being about three times more powerful than the latter. Surprisingly, honokiol and magnolol turned out to be competitive antagonists, and honokiol was about three times more potent than magnolol. The activity profile of the two isolated compounds, honokiol and magnolol, is in line with the data obtained with diphenhydramine used as a reference H1-antagonist (positive control).
3.3.3 M-receptors
The extracts and the reference compounds were studied for their actions against muscarinic receptors on lung and trachea isolated tissues using atropine as a reference antagonist (positive control) (Table 4).
| Trachea | Lung | |||
|---|---|---|---|---|
| IC50a | 95% CL | IC50a | 95% CL | |
| KPC | 1.25 (mg/mL) | 1.12–1.39 | NA | |
| Fagron | 0.48 (mg/mL) | 0.42–0.55 | NA | |
| Honokiolc | > 10 μM (0.0026 mg/mL) | 55.82 μM (0.015 mg/mL) | 46.52–66.97 μM (0.012–0.017 mg/mL) | |
| Magnololc | > 10 μM (0.0026 mg/mL) | 18.25 (0.0048 mg/mL) | 14.35–23.21 (0.0038–0.0062 mg/mL) | |
| pA2b | pA2b | |
|---|---|---|
| Atropine | 8.90 ± 0.02 [0.85 μg/mL] (0.81–0.89 μg/mL) | 8.79 ± 0.01 [1.09 μg/mL] (1.07–1.12 μg/mL) |
- a The IC50 of non-competitive antagonism was calculated using the inhibition effect induced by three different concentrations of each extract and reference compounds with n = 4–6 (Tallarida & Murray, 1987). CL represent the confidence limits.
- b Each pA2 value was obtained from 4 to 6 dose-ratios at three different concentrations and determined by the method of constrained plot (Tallarida et al.,1979; Tallarida & Murray, 1987).
- c The results of honokiol and magnolol were expressed in both milligrams/milliliters and micromolar to better compare the results. NA, non active up to 1 mg/mL.
Atropine on the trachea and lung behaves as a competitive antagonist with potency similar to that obtained in other smooth muscles (Budriesi et al., 2010). On the lung, Fagron and KPC have no significant effects up to 1 mg/mL, while honokiol and magnolol have a reversible, non-competitive antagonistic effect; magnolol is about three times more potent than honokiol. On the trachea, the activity profile is opposite: honokiol and magnolol have no effects up to 10 μM while Fagron and KPC are reversible non-competitive antagonists; Fagron is about 2.6 times more potent than KPC.
3.3.4 Calcium channels
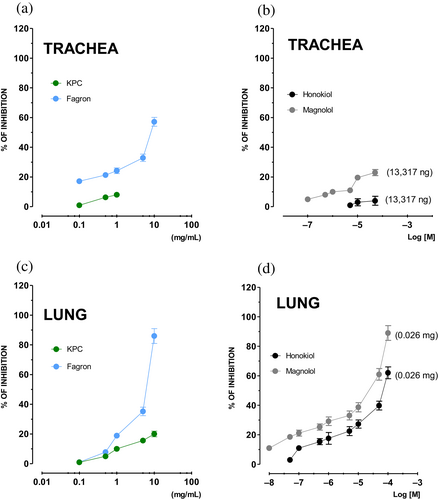
The extracts and the reference compounds were studied for their spasmolytic activity on the trachea and lung pre-contracted with K+ 80 mM, and the results are presented in Table 5 together with those of nifedipine used as a positive control. Nifedipine has high IA and high potency and its profile is similar to that shown in other districts (Budriesi et al., 2011).
| Trachea | Lung | |||||
|---|---|---|---|---|---|---|
| % IAa | IC50b | 95% CL | % IAa | IC50b | 95% CL | |
| KPC | 8 ± 0.3 (1 mg/mL) | 20 ± 1.6 (10 mg/mL) | ||||
| Fagron | 57 ± 1.6 (10 mg/mL) | 0.92 | 0.73–1.17 | 86 ± 0.3 (5 mg/mL) | 3.21 | 2.87–3.99 |
| Honokiolc | 7 ± 0.3 (100 μM) (0.026 mg/mL) | 62 ± 0.6 (100 μM) (0.026 mg/mL) | 15.91 μM (0.0042 mg/mL) | 13.57–17.64 μM (0.0036–0.0047 mg/mL) | ||
| Magnololc | 23 ± 1.1 (50 μM) (0.013 mg/mL) | 89 ± 2.6 (100 μM) (0.026 mg/mL) | 18.93 μM (0.0050 mg/mL) | 16.94–20.01 μM (0.0045–0.0053 mg/mL) | ||
| Nifedipine | 70 ± 0.36 (0.005 μM) (1.73 μg/mL) | 0.0015 μM (0.52 μg/mL) | 0.0011–0.0022 (0.038–0.76 μg/mL) | 67 ± 1.4 (0.1 μM) (0.035 mg/mL) | 0.0011 μM (0.038 μg/mL) | 0.081–0.0016 (0.028–0.055 μg/mL) |
- a IA, intrinsic activity expressed as percent inhibition of calcium-induced contraction on K+-depolarized (80 mM) guinea pig trachea and lung tissues. Data are reported as mean ± SEM. In parenthesis is reported the concentration that gives the maximum effect.
- b IC50 (i.e., the concentration that inhibited 50% of the maximum contraction induced by K+ 80 mM) was calculated from the concentration-response curves according to Probit analysis by Litchfield and Wilcoxon (Tallarida & Murray, 1987) with n = 6–7. When the maximum effect was <50%, the IC50 values were not calculated. CL represents the confidence limits.
- c The results of honokiol and magnolol were expressed in both milligrams/milliliters and micromolar to better compare the results.
The extracts as well as the reference compounds have concentration-dependent spasmolytic activity (Figure 8). In the lung, both honokiol and magnolol have spasmolytic IA that reaches 62 ± 0.6 (%) and 87 ± 2.6 (%) at the same concentration (100 μM), while their potency is comparable (EC50 = 15.91 mg/mL, CL 13.57–17.64; EC50 = 18.93 mg/mL, CL 16.94–20.01, respectively). In the same tissue, Fagron has a spasmolytic action (IA 86 ± 0.3% at 5 mg/mL), while KPC is less active (IA ~20% at 10 mg/mL). At the trachea level, Fagron has a spasmolytic activity characterized by a ~3.5 times greater potency than in the lung. Interestingly, KPC has intrinsic spasmolytic activity that is not noteworthy as that of the reference compounds. In conclusion, MOEs and tested compounds seem to possess a sort of lung-selective activity, although with a lower potency than nifedipine.
3.4 In vitro assessment of spasmolytic activity: SC
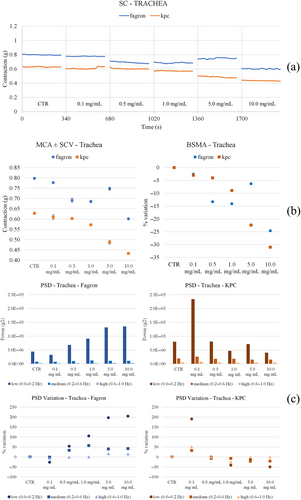
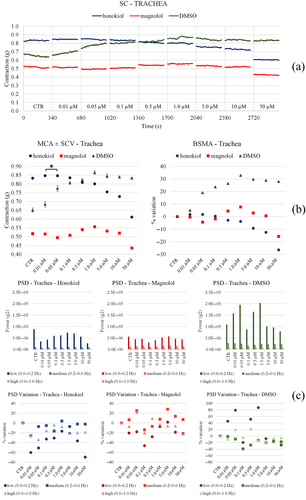
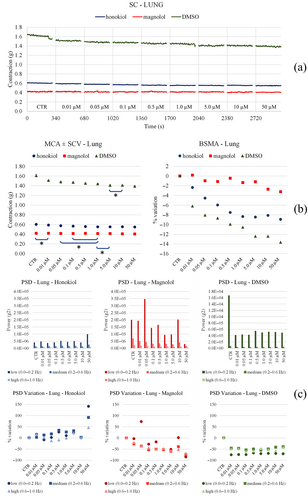
MOEs, honokiol and magnolol effects on spontaneous contractility of trachea and lung were studied (Figures 9-12). Cumulative concentration-response curves were constructed, from which data relating to the parameters considered were extrapolated. The microliter of DMSO used to solubilize the reference compounds was also separately studied.

3.4.1 Trachea
A slight reduction in the tone with both Fagron and KPC was observed. In particular, Fagron causes a concentration-dependent increase in the low-frequency motility, while KPC produces a peak at 0.1/1 mg/mL and then motility returns to values comparable with those of the control (Figure 9). Honokiol and magnolol keep the tone stable, which reduces slightly at the highest concentrations tested; DMSO instead increases the tone (Figure 10). On the other hand, the same compounds slightly reduce the motility compared with control before the starting cumulative curve at all frequencies and all concentrations, while DMSO causes an increase in low frequencies for intermediate concentrations.
3.4.2 Lung
Both Fagron and KPC raise the tone in a concentration-dependent fashion. Fagron reduces spontaneous motility with concentration, while KPC produces an increase in low frequencies at low concentration (and then reduces the effects) (Figure 11). Honokiol and magnolol do not produce substantial changes in tone, while DMSO reduces it slightly (Figure 12). Neither honokiol, magnolol, nor DMSO significantly modify spontaneous motility at any frequency. Only magnolol causes a slight increase in the low frequencies. The outlook of results related to airways and isolated tissue spontaneous contractility is collected in Table 6.
| Parameter | Trachea | Lung | |
|---|---|---|---|
| KPC | MCA | ↓ concentration-dependent | ↑ up to 1.0 mg/mL, then regain basal values |
| LF bp | ↑ 0.1 mg/mL, then ↓ and then remains stable | ↑ 0.1 mg/mL, then ↓ | |
| MF bp | ↑ 0.1 mg/mL, then ↓ and remains stable | ↓ up to 0.5 mg/mL, then ≈ | |
| HF bp | ↑ 0.1 mg/mL, then ↓ and remains stable | ↓ up to 0.5 mg/mL then ≈ | |
| Fagron | MCA | ↓ concentration-dependent (except 5.0 mg/mL) | ↑ up to 5.0 mg/mL |
| LF bp | ↑ conc. dependent | ↓up to 0.5 mg/mL, then ↑ | |
| MF bp | ↑ at 0.5 mg/mL, then ↓ and remains stable | ↓ up to 0.5 mg/mL, then ↑ | |
| HF bp | ≈ | ↓ up to 0.1 mg/mL, then ↑ | |
| Honokiol | MCA | ≈ up to 0.05 μM, then ↓ | ↓ up to 50.0 μM |
| LF bp | ↓ at 0.01 μM, then ↑up to 1.0 μM | ↑ at 50.0 μM | |
| MF bp | ≈ | ↑ at 50.0 μM | |
| HF bp | ↓ up to 0.05 μM, then ↑ up to 1.0 μM | ↑ at 50.0 μM | |
| Magnolol | MCA | ↑ at 1.0 μM, then ↓ up to 50.0 μM | ↓ at 10 μM and 50.0 μM. |
| LF bp | ↓ up to 0.1 μM and then slight increases | ↑ at 0.05 μM, then ↓ | |
| MF bp | ≈ | ↓ slightly | |
| HF bp | ≈ | ↓ slightly | |
| DMSO | MCA | ↑ up to 1.0 μM | ↓ up to 10 μM |
| LF bp | ↑ up to 0.05 μM | ↓ at 0.01 μM, then ≈ | |
| MF bp | ↓ up to 0.1 μM | ↓ at 0.01 μM then ≈ | |
| HF bp | ↑ at 0.1 μM and 1.0 μM | ↓ at 0.01 μM then ≈ |
- Note: ↑ increase; ↓ decrease; ≈ unchanged, constant.
- Abbreviations: HF, high frequency; LF, low frequency; MCA, mean contraction amplitude; MF, medium frequency.
4 DISCUSSION
In this work the possible application of two MOE in respiratory tract diseases has been evaluated. Among all the potential effects, the present study focused on antimicrobial activity together with airway smooth muscle relaxant effects (L. W. Chan, Cheah, et al., 2008; Hu et al., 2011). As it has been mainly reported, the biological activity of an extract or herbal drug seems to be ascribed to the presence of a large number of secondary metabolites, which in the case of M. officinalis L. include more than 200 compounds attributable to several molecular scaffolds, including phenols, alkaloids, steroids, and essential oils, in which terpenoid structures have been identified (Luo et al., 2019). Within all the compounds with phenolic structures, lignans represent the most abundant group and the most interesting from a biological point of view.
The quality control of commercial Houpo samples is based on the quantification of honokiol and magnolol which can be considered as suitable phytomarkers (S. S.-K. Chan, Zhao, et al., 2008; Klein-Junior et al., 2021), being described as the main factors responsible for the beneficial properties of magnolia bark extract (Lovecká et al., 2020). The Chinese and European pharmacopoeias report that the cortex of M. officinalis L. should contain at least 2.0% of honokiol and magnolol with reference to the dried drug (Poivre & Duez, 2017). It is worth underlining, however, that there is the possibility of finding qualitative and quantitative differences in the components of the bark of magnolia according to the species considered, the extraction solvents, the analytical methods used, and the cultivation region (Lee et al., 2011).
Interestingly, MOE was shown to contain significantly different amounts of the phytomarkers honokiol and magnolol. In particular, Fagron extract was found to contain about 50- and 15-fold levels of honokiol and magnolol with respect to KPC.
As for the antimicrobial effect, the standard compounds exerted an interesting activity against the pathogens as compared with the extracts. This initially led to attribute the antibacterial activity of the extracts to the presence of honokiol and magnolol, whereas the presence of additional molecules could be not significant or even detrimental to antibacterial activity. Getting more into detail, our attention shifted towards the potential anti-biofilm activity: KPC showed a marked anti-biofilm activity as compared to Fagron. The latter, in fact, except for the pathogen S. aureus, did not give significant results, despite the higher content of honokiol and magnolol as compared with the extract KPC. Honokiol and magnolol standards, on the other hand, interfere with the biofilm formation mechanisms of all three bacterial strains. It should be noted that they have almost comparable activity against S. aureus and S. pneumoniae, both at MIC and non-lethal concentrations. Otherwise, toward P. aeruginosa, a difference has been observed in terms of the antibiofilm activity of the two neolignans; it is therefore possible to hypothesize that magnolol is less active toward gram-negative bacteria. In the specific case of P. aeruginosa, the different composition of the exopolysaccharide matrix, consisting of Pel, Pls, and alginates, could interfere with the activity of magnolol (Ghafoor et al., 2011). Similar considerations could also be advanced for Fagron extract. The lower anti-biofilm activity on P. aeruginosa could be linked to the specific structure of formation of the matrix and to the characteristics of the cell wall that characterize gram-negative bacteria. A further difference is the presence, in gram-negative bacteria, of the pseudocapsule, featured by a double phospholipid layer in which proteins, lipoproteins, and lipopolysaccharides are scattered; in case of limit permeation through the pseudocapsule, the extract would remain in the medium. These results prompt us to investigate the potential ability of MOEs against the already formed biofilm. The results obtained after adding KPC and Fagron extracts at 24- and 48-h biofilm showed a marked ability to promote the removal of the formed biofilm in all three bacterial strains, both at the MIC and at their non-lethal concentrations. In particular, the Fagron extract was more effective against the biofilm of S. aureus, while the KPC extract was against the biofilms of S. pneumoniae and P. aeruginosa; it is noteworthy that both extracts were more active than the standards themselves indicating that not only neolignans, but also other molecules present in the plant phytocomplex (i.e., polyphenol, alkaloids, terpenes, and terpenoids) contribute to the overall observed activity (Poivre & Duez, 2017). Recent investigations carried out on polyphenols, demonstrated the in vitro synergistic effect of quercetin and kaempferol in combination with rifampicin against clinical isolates of rifampicin-resistant and methicillin-resistant S. aureus. As for the mechanism of action, quercetin and kaempferol alone showed a mild inhibition of different enzymes, like β-lactamase and helicase (Khare et al., 2021). In addition, quercetin and kaempferol have been shown to inhibit the catalytic activity of different bacterial topoisomerases and this may partly explain the synergistic activity (Daglia, 2012; Enaru et al., 2021; Nouman et al., 2016). Within the class of isoquinolinic alkaloids, another possible mechanism of action has been advanced: a recent study suggests that these act by disturbing the Z ring and inhibiting cell division (Cushnie et al., 2014), and it is therefore possible that the isoquinolinic alkaloids contained in the extracts of M. officinalis act in a similar way, thus supporting the more pronounced activity of KPC and Fagron as compared with the standards. Also, the essential oils from the bark of M. officinalis could contribute to the antibacterial activity of the extracts; in fact, thanks to their hydrophobic characteristics, they could increase membrane permeability by diffusion in the lipids (Burt, 2004; Marrufo et al., 2013). These extracts have shown the ability to significantly alter the permeability of the cell membrane, unlike the standards that did not provide significant results. We thus hypothesize a synergic effect of other molecules other than the neolignans present inside the phytocomplex.
Several studies have in fact shown that phenolic compounds are capable of altering microbial growth by modifying cell permeability, leading to the loss of macromolecules (Hossain et al., 2021; J. Liu et al., 2020), a consequence of the interaction of phenolic molecules with the phospholipid components of the cell membrane. Thanks to these data, it is possible to deduce that the activity expressed by the two extracts of M. officinalis is the result of the action of several molecules present inside the phytocomplex, which are likely to be able to exert antibacterial activity at different levels. For example, phenolic compounds bind the β-subunit of the DNA-gyrase enzyme, blocking the ATP binding site, thus compromising cell replication processes leading to a halt in bacterial growth. In addition, some phenolic molecules appear to exert antibacterial activity by inhibiting the synthesis of structural elements of the cell membrane and peptidoglycan, especially fatty acids (Cowan, 1999; Cushnie & Lamb, 2005; Fontana et al., 2022; Ikigai et al., 1993; Mickymaray, 2019; Scalbert, 1991; Tsuchiya et al., 1996).
Beside the effects we recorded with our study, the clinical use of magnolia extracts as antimicrobial has been explored but still lacks updated clinical studies. In TCM, more than 300 herbs have been discovered to have antimicrobial activities, and some of these have been used as antimicrobial agents in clinical practice for many years: crude extracts from several medicinal herbs have been shown to exhibit antifungal activities in vitro, and, in a study conducted by X. Liu et al. (2011), the effective anti-Candida principals were identified to be berberine, palmatine, allincin, pseudolaric acid A and B, magnolol, honokiol, and galangin. Its actual main practical use as antibacterial agent has been as far limited to oral hygiene; current trials show that magnolia 0.3% mouthwash tends to decrease the number of S. mutans in dental plaque significantly (X. Liu et al., 2011).
It has long been known that respiratory infections contribute to the worsening of many diseases such as allergies and asthma (McIntosh et al., 1973). This amplifying effect appears to be due to the release of several mediators that act on various receptors in the airways, and among them, G-protein coupled receptors represent important nodes of the network target connected to airway diseases (Wendell et al., 2020). For example, some metabolites produced by S. aureus induce the release of histamine (Espersen et al., 1984). Therefore, it becomes very interesting to verify whether the antibacterial activity of MOE is also combined with an activity on receptors and channels present in the airways that possibly trigger smooth muscle relaxation, with a view to studying more nodes of the network target of respiratory infections. For this reason, the effects of the two MOEs along with those of the reference compounds on some targets strongly implicated in the control of lung and tracheal spontaneous and induced motility were investigated.
The effects on the H1-receptor were thus assessed (Ikarashi et al., 2001; Matsumoto et al., 1993). As magnolol and honokiol from Magnolia obovata inhibit C48/80-induced histamine release from mastocytes (Ikarashi et al., 2001), the possibility that an H1-antagonistic activity could accompany that on mastocytes, thus enhancing magnolia effects on airways, was studied. In our experimental models, honokiol and magnolol are competitive antagonists of H1-receptors present on the guinea pig trachea, as in this tissue histamine-induced contraction is mediated by this subtype of histamine receptors, at variance with H3 that mediates relaxation (Cardell & Edvinsson, 1994). The antagonist properties are also present in the MOEs, but these are non-competitive and reversible. Fagron is more active than KPC, probably owing to the higher concentration of secondary metabolites in the phytocomplex.
Cholinergic muscarinic receptors in the airways are crucial for the control of tissue functionality (Buels & Fryer, 2012). These receptors, in fact, are involved in the regulation of the smooth muscle tone, in the mucus-secretion and up to the vasodilation. In some diseases, such as asthma, the activation of cholinergic receptors leads to bronchoconstriction, which, together with the actions previously illustrated, strongly limits the flow of air. The impact of cholinergic activity on the airways is even more significant as endothelial cells are also able to produce acetylcholine (Haberberger et al., 2000) and, through various transport systems, release it into the airway lumen (Kummer et al., 2006) with amplification of the effects. Acetylcholine induces contraction of smooth muscles due to the prevailing presence of M3-muscarinic receptors in the trachea and bronchi (Struckmann et al., 2003). It is therefore easy to understand how the modulation of this receptor family represents a very important target for the control of respiratory symptoms. Muscarinic antagonists have been used for the treatment of various respiratory diseases due to their bronchodilator effects for a long time (Gosens & Gross, 2018). As for the effects on muscarinic receptors present in the respiratory tract, in the present study we distinguished the effects on the trachea and on the lungs. In the former tissue, honokiol and magnolol have no noteworthy effects, while Fagron and KPC are reversible non-competitive muscarinic antagonists. As in guinea pig trachea, CCh-mediated contraction is mediated by M3-receptors and is independent by the presence of epitelium (Kj & Pm, 1992), we can speculate that the antagonist effects elicited by Fagron and KPC occur at M3 receptors as well. This mechanism is of clinical interest owing to the M3-mediated deleterious acetylcholine effects on the airways, which entail an increased release of pro-inflammatory mediators from bronchial epithelial cells and cells of the immune system (Gosens et al., 2004). Thus, the possibility of using Fagron or KPC as an oral supplement to support the treatment of airborne diseases such as asthma is an interesting feature, especially for patients who have poorly controlled symptomatic disease. On the other hand, honokiol and magnolol, although inactive in the trachea, behave as muscarinic antagonists in the lung. This may be due to the prevalence of different isoforms of muscarinic receptors: M2 subtype, in fact, account for about 90% of total receptors in guinea-pig lung (Haddad et al., 1991), and for this the possibility that honokiol and magnolol might behave as M2-antimuscarinic compounds cannot be ruled out. Moreover, muscarinic antagonists are often combined to β2-agonist as they act synergistically to improve lung function (Samp et al., 2017). The fact that magnolia bark extracts possess a cross activity between muscarinic- and β2-receptor is also desirable in conventional therapy (Pera & Penn, 2014). Only magnolol has a similar action profile, while honokiol has no noteworthy action. The use of muscarinic antagonists, as well as that of poor selective β2-agonist, is associated with side effects related to the presence of the same receptors in other areas, including the cardiovascular and gastrointestinal systems. The main component of Fagron and KPC, magnolol, on the other hand, has shown to possess cardioprotective activity (Yuan et al., 2020), while it can stimulate the SCs of GI longitudinal muscles via M3-receptors (Jeong et al., 2009).
In all of the above targets, calcium plays a key role, therefore, we investigated the effects of the two extracts and reference compounds on calcium channels present in the airways. Magnolol and honokiol are known to reduce potassium-induced contraction (C.-H. Ko et al., 2003). In our experimental models, where we used a high concentration of potassium (80 mM) to depolarize, the spasmolytic effects are confirmed on lung tissue, while they have no noteworthy action on the trachea. In contrast, both extracts can inhibit calcium entry into cells (Carosati et al., 2012; Ioan et al., 2011).
This might hold true for hokionol and magnolol in the lung or Fagron in the trachea, as in these tissues they behave as muscarinic non-competitive antagonists (and Fagron also as an H1 non-competitive antagonist) at concentrations comparable to those blocking l-type calcium channels. At the same time, the other extract tested, KPC, does not affect calcium channel activity in both the trachea and lung, suggesting that the antagonist properties at muscarinic- and H1-receptors are probably due to a direct interaction with the receptors themselves. In the trachea, honokiol and magnolol behave similarly, that is, they do not block l-type calcium channels but behave as H1 competitive antagonists (see Table 7 for a summary of the type of activity of the compounds and extracts on the studied targets).
| LTCC | H1 receptors | Muscarinic receptors | ß2 receptors | ||
|---|---|---|---|---|---|
| Honokiol | Trachea | NA | Competitive antagonist | Inactive | Agonist |
| Lung | Block | ND | Noncompetitive antagonist (LTCC mediated?) | ND | |
| Magnolol | Trachea | NA | Competitive antagonist | Inactive | Agonist |
| Lung | Block | ND | Noncompetitive antagonist (LTCC mediated?) | ND | |
| KPC | Trachea | NA | Noncompetitive antagonist | Noncompetitive antagonist | Agonist |
| Lung | NA | ND | Inactive | ND | |
| Fagron | Trachea | Block | Non competitive antagonist (LTCC mediated?) | Noncompetitive antagonist (LTCC mediated?) | Agonist |
| Lung | Block | ND | Inactive | ND |
- Abbreviations: LTCC, l-type calcium channels; NA, not active; ND, not determined.
To explain the difference in behavior between Fragon and KPC, we must distinguish between isolated molecules and extracts made up of pools of organic molecules. Fragon has in fact a higher concentration of neolognans and other organic compounds, which could be responsible for its different behavior toward the calcium channel in comparison with KPC, further supporting the hypothesis of the important role played by the phytocomplex components in the pharmacological activity of the extracts.
As for the β2-receptor (Table 3), honokiol has IA lower than 50%, while magnolol has significant IA, albeit at high concentrations, which is reflected in low potency. Fagron and KPC have similar intrinsic activities, but the maximum effect is achieved at different concentrations (1 and 5 mg/mL, respectively), while their potency is comparable. Also in this case, the different activity framework could be justified by the contribution of the phytocomplex.
The calcium channel antagonist effect is particularly important as it is synergistic against fungi (Marangoni et al., 2017) and against bacteria (Barfour et al., 2021): Ca2+ and Mg2+, two alkaline-earth-metal ions physiologically essential for diverse living organisms, both disrupt model of S. aureus membranes and kill stationary-phase S. aureus cells, indicative of membrane-activity (Xie & Yang, 2016). Effects on calcium channels are also reflected in spontaneous motility. Both extracts in fact exert a relaxing action on the spontaneously contracted trachea while on the lung they increase the tone in a nonsignificant way. Honokiol and magnolol do not have an action worthy of note; this strengthens the hypothesis that the effects observed both on induced and spontaneous contractility are due not only to the concentration of the neolignans (Fagron is in fact more active than KPC), but also to the complete phytocomplex.
Always sticking to the network target, recent studies show how magnolol supplementation exerts protective effects against cancer-induced cachexia and the complications it causes (Chen et al., 2015). Overall, the main secondary metabolites of Houpo also act as anti-asthma, anti-inflammatory, and antioxidant (Lee et al., 2011): all effects that can be useful in diseases of the airways. Those on the respiratory system are also confirmed by clinical studies carried out with extracts of Magnolia flos on adult asthmatic patients (Park et al., 2012).
In conclusion, from the present data, we can envisage the use of MOE to assist in the treatment of respiratory diseases. The strong antimicrobial action to which is combined a broad spectrum of activity directed at modulating receptors involved in bronchodilation, controls the symptomatology of many respiratory diseases and supports its application as a dietary supplement advanced for promoting oral health and the prevention of oral cancer (Bui et al., 2020; Yang et al., 2016). The quantification of reference compounds conducted by us allows to link the concentration of the compounds to the effects. Moreover, moving from TCM to WM, targeted drug delivery could be a strategy for further improving the local bioavailability of magnolia extract, thereby preventing the off-organ on-target side effects and resulting in a more efficacious dietary supplement.
ACKNOWLEDGEMENTS
The authors are grateful to University of Bologna and University of Ferrara for financial support. Open Access Funding provided by Universita degli Studi di Bologna within the CRUI-CARE Agreement.
CONFLICT OF INTEREST STATEMENT
The authors declare no conflicts of interest.
Open Research
DATA AVAILABILITY STATEMENT
The data that supports the findings of this study are available in the article.


