Partial Melting and Structural Disorder in Models of Irradiated Amorphous Ge2Sb2Te5
Abstract
Identifying the link between the energy landscape that arises in chemically complex amorphous solids and the evolution of the structural disorder in the host glassy matrix upon ion irradiation can provide a fundamental understanding needed for the development of functional materials with enhanced radiation tolerance. Herein, a comprehensive analysis of the structural transformations that occur when an amorphous phase-change memory material is exposed to radiation-damage events is presented. Different measures of atomic-structural (dis)order—geometric, topological, and chemical—are analyzed in models of irradiated glassy . The modeling results demonstrate that the degree of chemical disorder is increased within the postirradiation recovered amorphous network of , while local atomic environments with homopolar bonds are formed in the geometry of the irradiated structures, as a result of the primary knock-on atom simulations. The molecular dynamics trajectories of the high-energy nonequilibrium cascades indicate partial local melting of the glass structure. The simulated system can access liquid-like states in the energy landscape when irradiated, which lowers the energy barriers for local relaxation, leading to further atomic rearrangements and a structural recovery of the glass network. This observation provides an important insight into the radiation tolerance of these amorphous materials.
1 Introduction
Every glassy material has its own (thermal) history, which is encoded in the evolution of its properties, while the final amorphous state depends on the applied temperature profile protocol used to generate it.[1] For a given composition, there is a mosaic of metastable amorphous structures that correspond to local energy minima, namely, “inherent structures,”[2] while this ensemble of accessible states can vary when exposed to nonequilibrium conditions. Moreover, the degree of short-range structural ordering in amorphous materials also depends on their preparation protocol.[3] Ion irradiation is a nonequilibrium process that involves the direct bombardment of a material with high-energy ions, leading to unique amorphous structures. This technique has been employed for a wide range of materials research and purposes, including dopant implantation in semiconductor device fabrication and material-processing routes toward enhanced functionalities, as well as for introducing alloy disorder in chalcogenide materials.[4] The ability to predict and characterize the structural transformations of glassy materials exposed to nonequilibrium conditions is crucial in developing semiconducting materials with tailored properties.
Phase-change random-access memory (PCRAM) devices, based on Ge–Sb–Te alloys, are part of some commercial nonvolatile solid-state drives, and they are also promising candidates for neuromorphic and in-memory computing applications,[5-7] as well as for new storage-class memory devices.[8] Such PCRAM devices encode stored digital binary data as metastable structural states of the same chalcogenide material.[9] Their operational principle relies on the fast (of the order of nanoseconds) and reversible (up to millions of cycles) switching between a low-electrical-resistance (i.e., conductive) crystalline state (“1-bit”) and a high-electrical-resistance (i.e., resistive) glassy state (“0-bit”), induced via Joule heating by the application of appropriate voltage (or laser) pulses.[10, 11] As an innovative solution, chalcogenide phase-change materials have been proposed for spaceborne solid-state memory modules because of their nonvolatile, reconfigurable, fast-switching, and space-radiation-tolerant capabilities.[12, 13]
In our previous work, nonequilibrium irradiation cascades in amorphous phase-change memory material have been investigated by means of first-principles molecular dynamics simulations.[13] Self-ion irradiation was modeled by carrying out a thermal-spike simulation, in which the collision effects were caused by primary knock-on Te atoms with initial kinetic energies ranging from 25 to 200 eV.[13] A detailed analysis of the kinetic profile of the nonequilibrium radiation-damage cascade showed the rapid time evolution of the dynamics of the cascade within the glass network, with the ballistic phase being very short.[14] These simulations revealed the formation of large voids within the amorphous network during the irradiation cascade events.[13] However, the final equilibrated simulated models showed a notable degree of healing and reversibility, as both the atomic and electronic structures recovered from the damage imposed during irradiation.[13] Nevertheless, structural modifications of the chemical order did occur within the glass structure after exposure to irradiation.[13, 14] An increased proportion of edge-sharing tetrahedra was observed, which is in direct correlation with the increased population of (specific) homopolar bonds in the final equilibrated structure.[13, 14] Moreover, the simulations suggested, based on an analysis of the thermal transients from the molecular dynamics trajectories, that the lattice thermal conductivity of the irradiated amorphous models can be significantly reduced (by as much as 60%).[15]
It has been reported, using classical molecular dynamics simulations, that the topography of the enthalpy landscape plays a significant role in the irradiation-induced amorphization of α-quartz.[16] It appeared that, upon the irradiation process, the simulated structure explores “forbidden” states of the landscape, which typically are not accessible via a thermal quench of molten silica, resulting in a different character of disordering compared to that obtained upon the normal vitrification process.[16, 17] In addition, it was shown that the damage imparted during irradiation of the crystalline structure saturates when the system accesses a local region of the energy landscape that resembles the atomic configuration of a liquid structure, thereby facilitating relaxation and, hence, preventing the accumulation of further damage.[16]
Comparisons between glassy models before and after irradiation are not always straightforward since every glassy structure is out of equilibrium, and hence their properties depend on their thermal history. Moreover, the intricate energy landscape of an amorphous structure can have profound effects on the properties of the material and its response to irradiation. An atom-density-based similarity metric was utilized to examine the degree of structural (dis)similarity between the irradiated configurations studied here and by visualization in a 2D map. The evolution of the potential energy landscape of the simulated system during ion irradiation is presented in a configurational map to illustrate how its nature can facilitate intrinsically the reorganization of the atomic structure and the subsequent recovery of the glassy network. Our previous structural analysis on irradiated glassy models is extended here by employing geometric, topological, and chemical estimations of disorder to gain further insight into the structural evolution and the overall response of the amorphous material to the irradiation events. In this way, the impact of the radiation-damage cascade on the local atomic structure of the glass is explored, while implications related to the functional properties of the material are discussed.
2 Partial Melting of the Amorphous Structure
In this study, the final atomic configurations, at the end of the molecular dynamics trajectories, obtained previously from 50, 100, and 200 eV Te-atom irradiation simulations,[13] as well as the initial pristine glassy structure, were further optimized with density-functional theory (DFT) simulations and by performing geometry optimization calculations. The similarity relationships between the optimized amorphous models, as well as the structural changes upon the different irradiation events, can be established, at a glance, through the construction of a configurational map.[18] This can be achieved by using an informative representation for the configuration of each model structure, together with a suitable dimensionality-reduction technique.[19] A smooth-overlap-of-atomic-positions (SOAP) descriptor was employed to represent each simulated structure,[20] globally averaged over every local atomic environment within each different configuration, while multidimensional scaling (MDS) has been adopted as the embedding technique.[21, 22]
Each SOAP descriptor is a vector (q) representing an atomic environment and existing in a high-dimensional space. A measure of the pairwise similarity between two atomic environments is given by the dot product of the corresponding SOAP vectors.[18, 20] SOAP descriptors are normalized such that the dot product of any two of them lies between , corresponding to no similarity whatsoever, and , corresponding to indistinguishable local environments. SOAP descriptors of an atomic environment can be aggregated into a global description of a configuration by appropriate averaging over the power-spectrum components of all the different atomic environments in the configuration.[20]
The MDS map that is constructed with configurations from the DFT geometry optimization calculations of three irradiated (50, 100, 200 eV), as well as the initial (melt-quenched-generated, 0 eV) glassy model structures, is shown in Figure 1. In addition, data points that are sampled during the optimization process of the respective DFT calculations performed here have been added to the map to highlight the local search of the geometry optimizer while moving “downhill” on the potential energy surface into the local minimum. The rocksalt-like crystalline structure of [26, 27] and configurations that resemble the liquid phase of the material under study[28] have been used as reference points in the 2D map. We note that for the data set of the simulated structures analyzed in this study, a stress value of was obtained, suggesting that the embedding faithfully preserves the high-dimensional distances between the different configurations.
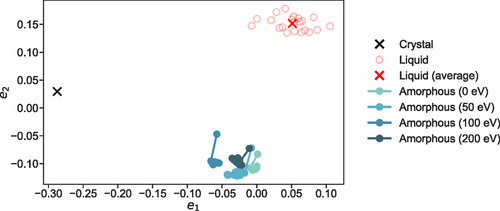
In the 2D space of Figure 1, data points that are close to each other on the map indicate close similarity between the model structures, from the point of view of the configurational descriptor.[18] It can be observed that the configurations associated with the final irradiated glassy models, obtained from the nonequilibrium radiation-damage simulations, move further away from the point corresponding to the pristine amorphous model, obtained from a melt-quench simulation. This highlights that the glass has experienced structural modifications due to the irradiation events that are captured by the embedding.
The distances between the configurations obtained after the fast thermal quench (i.e., Newtonian cooling) of each of the radiation-damage events considered here, and the inherent structures that are obtained from their subsequent geometry optimization calculations, can be roughly correlated with the local energy barrier heights in the energy landscape picture.[29, 30] This is similar to the more commonly used metric of the mean-squared displacements between inherent and thermalized structures.[31] Sample configurations, at different iteration steps, from the geometry optimization process to the respective inherent structures move away from the crystal and liquid regions, as they approach the local minima, and they gather into a distinct cluster area of the configurational map in Figure 1.
During irradiation, the short timescale within which the radiation-damage cascade interacts with the host solid matrix implies that the structural transformations in the amorphous network occur far from thermodynamic equilibrium. In order to probe the evolution of the energy landscape during the atomic-damage events, raw data from the DFT molecular dynamics trajectories of the different simulations previously performed[13, 14] were utilized to construct 2D maps, by using again a combination of SOAP descriptors and MDS for the embedding, for the 50, 100, and 200 eV primary knock-on atom events. In addition, each data point was plotted as a function of the calculated potential energy from the electronic-structure simulations, and the overall results are shown in Figure 2. Similarly to what was presented in the previous map, crystalline, liquid (1200 K), and glassy (300 K) configurations of the material[28] have been used as three distinct reference points to facilitate comparisons.

It can be observed that, during the irradiation simulations, the system visits configurations between the liquid and amorphous states, while with increasing initial primary knock-on atom energy, it approaches the reference liquid configuration. For the case of the 200 eV radiation-damage simulation, the trajectory of the modeled system was able to cover the entire distance between the liquid and amorphous regions, highlighting clearly that, during this irradiation event, liquid-like configurations are being accessed by the simulated structure. From the high-energy liquid states, structural relaxation can occur quickly during the remaining thermal quench of the irradiated structure. Such fast relaxation and structural reorganization can assist the recovery of the glassy network of the simulated structure,[13] which is also facilitated by the existence of many different bonding arrangements, with various atomic-coordination environments, within this chalcogenide material.[32, 33]
3 Structural Disorder Evolution
Amorphous is a material that exhibits a wide range of different degrees of structural ordering within its glassy network. In order to investigate the effects of the radiation-damage cascade on the atomic structure of the models, geometric, topological, and chemical measures of disorder have been employed here for the different primary knock-on atom events.
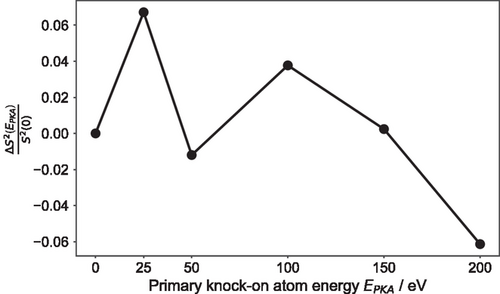
It can be observed that the geometric-disorder indicator oscillates across the different nonequilibrium irradiation simulations. The final equilibrated structures after the 25 and 100 eV primary knock-on atom events are more disordered than the initial glassy model, whereas the 200 eV cascade-damage event results in an amorphous structure with enhanced structural order compared to the pristine model. We note that the , that is required in the calculation of the respective in Equation (3), was averaged over 10 ps of a DFT molecular dynamics simulation at 300 K, at the end of each irradiation simulation previously performed, in order to consider the dynamical behavior of the system in the estimation of the geometric-disorder indicator.
The results of the analysis are shown in Figure 4 as a function of the different primary knock-on atom energies. The topological disorder of the final equilibrated amorphous structures after the different irradiation simulations is increased compared to the pristine glassy model. The magnitude of this measure reaches a maximum for the 100 eV irradiation event, while it monotonically decreases for the 150 and 200 eV cascade-damage simulations, highlighting that the degree of change of the topological disorder in the glassy structures is smaller for these initial kinetic energies. A possible explanation for this behavior is due to the fact that, during the 200 eV primary knock-on atom event, the simulated structure is able to explore liquid configurations, in contrast to the 100 eV cascade event (see Figure 2), that can help the system to escape any otherwise forbidden states in the potential energy landscape.
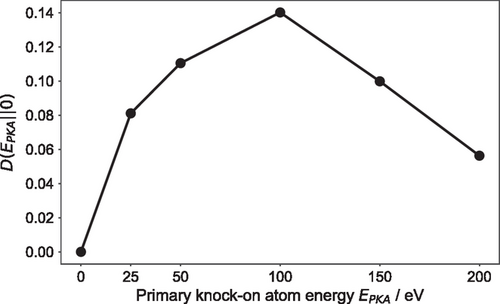
The ratio between the calculated two-body excess entropy of the different irradiated models and the corresponding value of the pristine amorphous model ranges between –0.07 and 0.07. The Kullback–Liebler divergence of their ring-size distributions covers a similar range of values, calculated to be between 0 and 0.14, again with respect to the glass structure before the primary knock-on atom events. Hence, these two measures of disorder show a similar span of structural modifications for the irradiated simulated structures compared to the initial glass structure, indicating a possible correlation between the topology of the amorphous network and the atomic geometry of the models.
In the above equations, and are the atomic fractions of each (generic) atom type. The quantities and are the average coordination numbers of A and B atoms, while and are the average number of B atoms around A, and the average number of A atoms around B, respectively. Finally, N is the total average coordination number of the simulated structure.
We note that the two approaches share a common interpretation, namely that a value of signifies a fully (chemically) ordered structure, such as the ideal cubic-crystal phase, a value of denotes a random arrangement, and a value of points toward a tendency for clustering, or phase separation into A-rich and B-rich regions.[40]
The results of the analysis for the 200 eV primary knock-on atom event, along the entire molecular dynamics trajectory, are shown in Figure 5. The initial structure, generated with a melt-quench simulation, has a chemical-order parameter of 0.7. It can be observed that, on the timescale of 1–2 ps after the beginning of the simulation, the radiation-damage cascade causes a significant reduction in the chemical order of the simulated structure (by as much as 50%), highlighting the impact of the nonequilibrium cascade event on the amorphous network. The drop in the chemical-order parameter to its minimum value is indicative of the destruction and formation of bonds inside the glass model. Thereafter, and during the thermal quench of the cascade event, the chemical order of the simulated structure partially recovers toward its initial value, resulting in a semiordered configuration. The degree of disorder in the final equilibrated amorphous structure, at the end of the molecular dynamics simulation, is increased for the whole model and per atomic species, compared to the initial glass model, before the irradiation event.
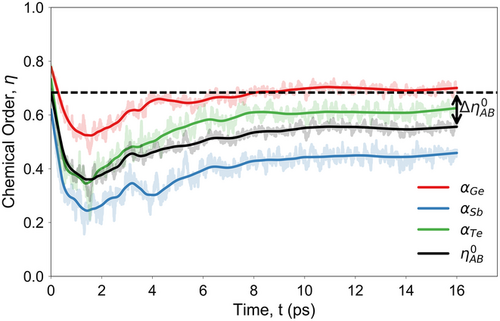
The overall picture of the temporal evolution of the chemical order inside the model indicates the partial local melting of the glass structure due to the radiation-damage cascade, as was demonstrated in the energy landscape of the 200 eV primary knock-on atom simulation, shown in Figure 2c. Moreover, it verifies the recovery of the short- and medium-range order of the amorphous network in the final equilibrated structure at 300 K, while suggesting an enhanced amount of disorder after the irradiation event.
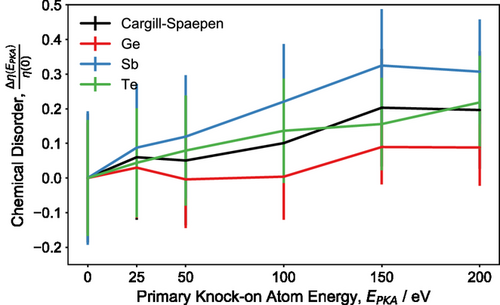
The amount of disorder that is generated in the irradiated amorphous structure can be estimated from the difference in chemical-order parameters, , between the initial, melt-quenched, glassy structure and the final equilibrated configuration, at the end of the molecular dynamics simulation, relative to the chemical order of the pristine model, denoted as . The degree of disorder is plotted against the different initial primary knock-on atom energies, ranging from 0 to 200 eV, and the results are shown in Figure 6. We note that the calculated values of this disorder measure have been averaged over the last 2 ps of each molecular dynamics trajectory at 300 K. It can be seen that the degree of disorder in the irradiated amorphous structure increases as the energy of the primary knock-on atom increases. An analysis of the species-resolved order parameters shows that the Sb atoms experience the largest increase in disorder, indicating specific structural rearrangements associated with the local atomic environments of Sb atoms that occurred within the glass network due to the impact of the cascade-damage event.
The modifications in the local order within the amorphous network are evaluated by calculating the local-order parameters, for all the atoms, in the initial, melt-quenched, glassy structure, and in the final irradiated models after the 100 and 200 eV primary knock-on atom simulations, and the results are shown in Figure 7. When the surrounding atoms in the vicinity of a given atom i are in an ordered arrangement, the local-order parameter, , is close to . In contrast, when the local environments of the atoms in the neighborhood of an atom i follow a random arrangement, then is closer to , while if these atoms are locally clustered, the value of is close to . It can be seen that the ordered alternation that is apparent in the glass model before irradiation, visible in yellow, is disrupted by random and disordered atoms in the geometry of the irradiated model structures, that are shown in green, blue, and indigo. These configurations are typically correlated to local atomic environments with homopolar, and , bonds. This observation is in accordance with the increased proportion of Te–Te, Ge–Sb, and Sb–Sb homopolar bonds that was found in the simulated structure after the 200 eV primary knock-on atom event.[14]

4 Vibrational Properties
Molecular dynamics trajectories at 300 K, sampled under the canonical (NVT) thermodynamical ensemble, were used for the estimation of the vibrational power spectrum of the amorphous models after the radiation-damage simulations, as well as for the initial glassy model before the primary knock-on atom events, and the results are shown in Figure 8. Due to the relatively short molecular dynamics runs used for the calculations of the vibrational density of states, the patterns related to the observations for the peaks are treated from a qualitative perspective. It can be seen that the vibrational power spectrum of the glass models is centered at ≈1.5 THz (at 0 K the power spectrum obtained from lattice dynamics is centered at ≈3 THz as in ref. 45), which is indicative of the anharmonicity of the simulated structures.[15, 51] In addition, it can be seen that the intensity of the vibrational density of states around the frequency regions of 1.5, 2.0, and 2.75 THz is enhanced as the primary knock-on atom energy increases, indicating a subtle irradiation-induced effect on the vibrational properties. This is in qualitative agreement (not in a similar frequency range) with the experimentally reported observations related to the Raman peak in the high-frequency part of the spectrum in films irradiated with Sb+ ions.[52]
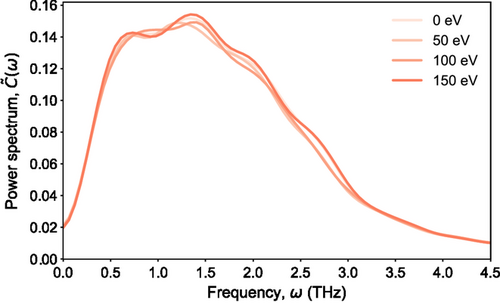
It is worth mentioning that, in contrast to the lattice dynamics, the approach that was followed here for the estimation of the vibrational density of states of the amorphous models does not provide a direct access to the normal modes, in order to evaluate their degree of localization with respect to the different primary knock-on atom simulations; however, its advantage is related to the fact that the calculated power spectrum can reflect the full anharmonicity of the potential energy surface of the simulated structures. Nevertheless, the observed subtle effects in the vibrational density of states of the irradiated models, shown in Figure 8, may vary significantly when an analysis of longer trajectories is utilized for the calculations.
5 Conclusion
In this study, irradiation of amorphous phase-change memory material reveals the impact of exploring liquid-like states in the energy landscape of the glassy structure during radiation-damage simulations, expanding our underlying knowledge associated with the response of this material to such nonequilibrium processes. Moreover, our previous structural analysis of the primary knock-on atom events is extended here to include various pieces of information related to the time evolution and the final degree of disorder in the irradiated glass models.
The simulated system is able to access liquid-like states in the irradiation simulation, starting with the 200 eV primary knock-on atom energy, as revealed from a configurational map constructed from suitable structural descriptors. Consequently, from these high-energy states, the irradiated configuration can relax, due to lower energy barriers for structural reorganization. This provides a thermodynamic insight into the radiation tolerance of the amorphous material, which, combined with the pronounced flexibility (softness) of the chemical bonding and the available free volume within the glassy structure, accounts for the essential attributes leading to the fast recovery of this material after irradiation.
From the perspective of the structural disorder, the most important effect was found to be an increase in the chemical disorder within the amorphous network of the models. This is in agreement with previous work that showed a systematic increase in the amount of homopolar bonds and the proportion of edge-sharing tetrahedra in the simulated structure with respect to the primary knock-on atom energy.[13, 14] The general increase in the degree of chemical and topological disorder that was measured after the irradiation events can be correlated with the decrease in lattice thermal conductivity previously reported for the irradiated glass models, as such disordered atomic environments may scatter the heat-carrying acoustic modes.[15] In addition, it is worth mentioning that similar structural motifs have also been associated with fragility and anharmonicity in models of other chalcogenide glasses.[53]
Regarding the short-time dynamics of the simulated structures, the qualitative picture that emerges is that the irradiation-induced chemical disorder in the amorphous models leads to an increased vibrational density of states in the high-frequency region of the power spectrum. Alterations in this frequency region in the Raman spectra of glassy have been attributed to the induced formation of homopolar bonds and to an increased proportion of GeTe4 edge-sharing tetrahedra in the irradiated amorphous structures.[52] Also, we note that, in the pristine glass structure, spatial localization of the high-frequency normal modes (at 0 K) has been correlated with tetrahedral configurations centered on Ge atoms.[45]
In follow-up studies, machine-learned molecular dynamics simulations using one of the available interatomic potentials developed for ,[54-56] should be utilized to perform large-scale radiation-damage simulations with primary knock-on atom energies in the range of keV (closer to the experimental values). Furthermore, this will allow the systematic investigation of finite-size effects and equilibration time-scales, which could significantly influence calculations of the vibrational density of states. Ultimately, this can provide a stronger connection between atomic disorder and the reduction in thermal conductivity in the irradiated amorphous structures. Moreover, it remains to be seen whether the calculated lower thermal conductivity of the irradiated amorphous structures might be a result of the localization of vibrational modes[57] at specific defective structural environments in glassy .
In conclusion, the current study is another step forward in an effort to build a comprehensive theoretical perspective on the effects of ion irradiation of phase-change memory materials. This may facilitate their design for radiation-hard integration in environments where exposure to radiation is a factor, such as in space exploration, where electronic devices, including but not limited to, microcontrollers and solid-state data recorders play an important role.
6 Experimental Section
Computer Models
The simulated systems are 315-atom models of the glassy phase-change memory material. The irradiated structures are the final thermalized configurations obtained from nonequilibrium radiation-damage simulations with Te primary knock-on atom (PKA) energies of 25, 50, 100, 150, and 200 eV. Details related to the computational setup, the radiation-damage cascades, and the ab initio molecular dynamics simulations with the stochastic boundary-conditions approach can be found in our previous work.[13, 14]
Electronic-Structure Calculations
DFT, as implemented in the CP2K code,[58, 59] was used to optimize the geometries of the irradiated glassy structures, using the Perdew–Burke–Ernzerhof (PBE) exchange-correlation functionals.[60] The CP2K code employs a mixed Gaussian basis set with an auxiliary plane-wave basis set to represent the electrons in the modeled system.[61] A double-ζ valence-polarized Gaussian basis set was used for all atomic species (Ge, Sb, and Te),[62] in conjunction with the Goedecker–Teter–Hutter pseudopotential.[63] The plane-wave energy cutoff was set to 5440 eV (400 Ry). The limited-memory Broyden–Fletcher–Goldfarb–Shanno algorithm[64] was applied in the geometry optimizations of the amorphous structures to minimize the total energy of the modeled systems with respect to the atomic coordinates. The convergence criterion for the forces on individual atoms of the current configuration in an iteration step was set to ( Ha Bohr−1). Periodic-boundary conditions were enforced in all calculations.
Molecular Dynamics Simulations
Born-Oppenheimer ab initio molecular dynamics simulations were carried out using the CP2K code.[58, 59] The electronic structure was treated through the Kohn–Sham formulation of DFT using the generalized-gradient approximation with the PBE exchange–correlation functionals.[60] The canonical ensemble (constant number of particles, volume, and temperature or NVT) was applied and the generalized Langevin equation, or colored-noise, thermostat[65] was chosen to control the temperature fluctuations. At 300 K molecular dynamics trajectories of 10 ps were generated with a timestep of 1 fs for the pristine and each irradiated glassy models. The velocity autocorrelation functions were calculated from the 10000 configurations collected during these molecular dynamics runs.
SOAP
The elements of a finite truncation of the power spectrum (up to a given and ) are utilized as components of the many-body atomic-descriptor vector, , employed in this study. We note that this vector is typically normalized to have unit length.
Metric MDS
MDS is a technique used to represent high-dimensional data in a lower-dimensional space to aid visualization. The goal of MDS is to map a finite set of data points onto a reduced space, in a way that the relative distances are maintained as faithfully as possible in the new (low-dimensional) space.[22] This process involves embedding the points such that their new coordinates reflect their original distances. Consequently, the embedding vectors (e) in the context of MDS correspond to these new coordinates of the data points after dimensionality reduction. MDS follows an optimization process to achieve the optimal embedding, by minimizing a stress (objective) function, which measures the discrepancy between the original (high-dimensional) and the reduced-space (embedded) distances.[22] The Scaling by MAjorizing a COmplicated Function algorithm was used for this purpose, employing a majorization technique that guarantees a monotonic convergence of the stress function. The algorithm starts with a random distribution of points and iteratively adjusts their positions until the stress function is minimized. The resulting embedding vectors can be visualized, in this study, as a 2D map, where distances reflect the true relationships between data points. This allows for an intuitive understanding of similarities and dissimilarities since similar configurations remain close together, whereas dissimilar structures stay far apart. Overall, MDS captures the intrinsic structure of the data by preserving significant variations in the reduced space.[22]
Acknowledgements
K.K. acknowledges financial support from the Research Council of Finland under grant no. 364241 (“NoneqRSMSD”). S.R.E. acknowledges the UK Leverhulme Trust for the award of a Fellowship.
Conflict of Interest
The authors declare no conflict of interest.
Author Contributions
Felix C. Mocanu: conceptualization (equal); data curation (lead); formal analysis (lead); investigation (equal); methodology (lead); visualization (lead); writing—review and editing (equal). Stephen R. Elliott: investigation (supporting); supervision (equal); writing—review and editing (equal). Konstantinos Konstantinou: conceptualization (equal); formal analysis (supporting); funding acquisition (lead); investigation (equal); methodology (supporting); supervision (equal); writing—original draft (lead).
Open Research
Data Availability Statement
The data that support the findings of this study are available from the corresponding author upon reasonable request.


