A novel topology for representing protein folds
Abstract
Various topologies for representing 3D protein structures have been advanced for purposes ranging from prediction of folding rates to ab initio structure prediction. Examples include relative contact order, Delaunay tessellations, and backbone torsion angle distributions. Here, we introduce a new topology based on a novel means for operationalizing 3D proximities with respect to the underlying chain. The measure involves first interpreting a rank-based representation of the nearest neighbors of each residue as a permutation, then determining how perturbed this permutation is relative to an unfolded chain. We show that the resultant topology provides improved association with folding and unfolding rates determined for a set of two-state proteins under standardized conditions. Furthermore, unlike existing topologies, the proposed geometry exhibits fine scale structure with respect to sequence position along the chain, potentially providing insights into folding initiation and/or nucleation sites.
Abbreviations:
RCO, relative contact order; ECO, effective contact order; 3D, three dimensional; DT, Delaunay tessellation; Kτ-NN, Kendall's tau—nearest neighbor.
Introduction
The protein folding problem, or problems,1 despite considerable recent headway, remains one of the greatest challenges facing computational biology. The interrelated folding problems can be described as2: (a) the folding code: given a protein's amino acid sequence, how does the thermodynamic interplay of interatomic forces determine the protein's structure? (b) structure prediction: how can a protein's (native, 3D) structure be computationally predicted from its amino acid sequence? and (c) the folding process: given the vast number of conformational possibilities embodied in a protein's amino acid sequence, how does it fold so quickly to its native state? This last problem, often referred to as the Levinthal3 paradox, has been addressed using a spectrum of theoretical and experimental approaches. Some remarkable4 and striking5 findings to emerge in recent years pertain to the fact that folding rates of two-state proteins (those folding without observable intermediates), which can vary over more than eight orders of magnitude, from microseconds6 to hours,7 and include a wide range of folds and functions, are largely determined by the topology of the native structure, with relative insensitivity to features such as the details of inter-atomic interactions and protein length.8, 9
Making such inferences—prediction of folding rates based on protein topology—requires a quantification of topology and a number of derived summaries have been advanced for this purpose. Generally, these summaries are employed as “bulk” properties—aggregated over the protein structure—so as to relate to (overall) folding rate. However, more locally defined topological summaries may prove informative with respect to local attributes such as folding initiation and propagation sites.10
It has been noted that (tertiary) native structures ought reflect their folding path histories, at least for some folding mechanisms.11 This motivates our framing of a novel topological characterization of a folded protein. It is based on the permutation representation of nearest neighbors, with subsequent use of Kendall's tau distance metric to capture perturbation from the unfolded polypeptide chain. We contrast the performance of leading topologies in predicting two-state protein folding and unfolding rates, demonstrating significant prediction gains for our new measure. This performance is all the more notable since it has achieved without implicit or explicit optimization, the new topology being devoid of tuning parameters. Some preliminary exploration of local properties is also proffered.

Several variants of RCO have been proposed, with emphasis on sensitivity to the cutoff parameters and the scope (short-, mid-, or long-range) of contacts, as discussed later. An alternate formulation, termed effective contact order (ECO),11, 12 operationalizes contacts and scope in terms of shortest path lengths between residues that can be achieved in the presence of existing (covalent or topological) links. This formulation attempts to capture effective loop size, and hence the size of the conformational search space necessary to form a conditional (on preexisting links) contact and, as such, is postulated to relate to search (folding) speed.2 Our new topology captures such constructs but in a distinct framework.
What constitutes folding from a topological (rather than mechanistic) perspective? Clearly, any definition must be dependent on the underlying polypeptide chain, since purely 3D coordinate based definitions would give rise to a multitude of (irrelevant) “folds”. One widely used primitive is based on backbone dihedral angles as depicted in Ramachandran plots.13 These plots have been used for crystallographic quality control purposes to detect angular outliers since many angle combinations do not occur due to steric hindrance. Further, by modeling sequential angular dependencies along the chain using dynamic Bayesian networks, successful generative models of local protein structure have been devised.14, 15 However, unlike RCO above, topological summaries derived from angular representations have not been employed in relation to predicting attributes such as folding rates.
As an alternative to backbone angles and contact orders, we can conceptualize folding as resulting in some residues being brought closer together relative to their positions in a denatured random coil. Although related to the underpinnings of contact order, it is by operationalizing this notion, without invoking contact distances that we arrive at our new topology.

 ()
()This enables use of cycle structure to capture topology with respect to an underlying chain, which is not available using Euclidean distances directly. A useful byproduct of such rank based approaches is their relative insensitivity to noise, a known concern with regard experimental (X-ray crystallography or NMR) determination of atomic coordinates.16


Sequence position (red) and nearest neighbor (blue) orderings for a cartoon fold schematic. (A) Sequence numbering proceeds along the chain from position 1 (N-terminal) to 9 (C-terminal). Nearest neighbors, from position 1, are computed using ranked Euclidean distances. (B) As for A, but with an interior referent position: position 1 (red, original position 4). The red sequence numbering illustrates referent N-terminal re-ordering. Nearest neighbor ranks (blue) are computed from this new referent. The (unstandardized) Kendall's tau distance between the referent and nearest neighbor orderings for residues 1 through 9 are 7, 4, 6, 11, 12, 4, 2, 2, 11 respectively. (C) A simple schematic mimicking a two-dimensional projection of an α helix. Here the referent and nearest neighbor orderings coincide for each residue, so each Kendall's tau distance is 0.
 ()
()In this manner, we obtain a permutation and its attendant cycle representation for each residue. We can then entertain characterizing a folded protein structure using properties or summaries of this collection. For example, we could summarize each residue by maximal cycle length, and then further summarize a structure by the maximum (over all residues) of these maxima. However, this summary proves to be not very useful. At the residue level, maximal cycle length is strongly dependent on whether a referent N-terminal or C-terminal reordering is employed, an arbitrariness to avoid. And, on the protein level, we obtain maximal cycle lengths of ≈ (n - 2) across a wide range of structures. This is consistent with modal cycle length under random permutation.

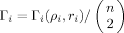 where division by
  standardizes such that Γi ∈ [0,1]. We do not employ optimization in arriving at a bulk summary, but simply employ the average over all residues:
 ()
()Then by the triangle inequality

 . This agreement is exemplified in Figure 2 which showcases near perfect agreement for N- and C-terminal reorderings, and illustrates the dependence on sequence length, the structures possessing 65 and 294 Cα's, respectively.

Some distinctions between Kτ-NN and RCO and related topologies are worth highlighting. It is important to recognize the complete absence of tuning (parameters) in computing Γ. Although refinements involving incorporation of tuning possibilities are discussed subsequently, all results presented herein use the (untuned) formulation described above. In contrast, use of RCO requires specification as to what physical (Euclidean) distance constitutes a contact, and what minimal sequence separation should be imposed. For the former a value of 6 Å is commonly used, this being the original specification,8 but other choices (e.g., 8 Å,18, 19) have been advocated. Although some studies indicate that results are insensitive to this specification,8, 20 others suggest that the choice has a strong influence.21 Additionally, there are disparate ways of operationalizing contact order scope: local-, mid-, and long-range contacts being distinguished.18, 22 Similarly, for example, the geometric distance based on Delaunay tessellation (DT)23 requires specification of sequence and spatial separation parameters.
Kτ-NN topology attempts to capture chain deformation/structural information between the referent and contacting residues, whereas this is ignored in computing RCO and DT. Conversely, Kτ-NN also incorporates such information beyond contacting residues. It could be argued that inclusion of such remote (from the referent residue) nearest neighbor rankings is at best irrelevant, and at worst distorting, for a topological summary. The following considerations are relevant: (i) applications of topologies are typically to bulk protein attributes, as opposed to residue specific. Summarization over the entire chain serves to downweight these distant contributions; (ii) a constraint on the range of sequence positions prior to ranking (1) is a putative tuning parameter; and (iii) transforming Γi to corresponding proximities via prox(Γi) = 1 − exp(−Γi) can be used to achieve such downweighting24 without specifying tuning parameters. Notably, despite these concerns, the performance of Γi-based summaries in predicting two-state folding rates exceeds that of alternates as described next.
The dataset used to assess performance of the competing topologies was obtained from a recent compilation.25 Critically, this article was the first to derive and assemble folding (kf), and unfolding (ku), rate constants obtained under standard experimental conditions, necessary for meaningful comparisons. The data provides rate constants for 30 proteins, 27 of which have PDB identifiers. RCO for these 27 structures was obtained using the Baker lab Perl script http://depts.washington.edu/bakerpg/contact_order/, as well as an online calculator http://www.copredictor.ca/. Calculation of Γi and DT made recourse to custom R26 code.
Associations between the respective topologies and log folding rates are presented in Figure 3. Note that the (absolute) correlations attained using
 are substantially and significantly greater than those achieved by RCO for both folding and unfolding rates. Delaunay tessellations have been used in several contexts to capture protein structural attributes, so it is natural to relate correspondingly defined topologies to folding rates. Doing so for both two- and multistate proteins23 yielded impressive results, with DT (Nα in Ref. 23) outperforming RCO in both settings. However, DT is strongly correlated with chain length. For multi-state proteins length is known to be a significant determinant of kf.27 But, for two-state proteins, results generally show no association between folding rates and length.4, 8 Indeed, for the present set of two-state proteins, with folding rates determined under standardized conditions, neither length nor DT are well-correlated with kf: absolute correlations being 0.19 and 0.41 respectively, again significantly less than for
  .
.

Folding (kf) and unfolding rates (ku) vs Kτ-NN (
 ) and relative contact order (RCO) topologies. The respective correlations are: A. kf vs
  : −0.68; B. ku vs
  : −0.61; C. kf vs RCO: −0.58; D. ku vs RCO: −0.30.
So far, we have utilized the new topology only in terms of a bulk property: its average,
 , over a given protein. Examination of numerous traces of individual (residue level) Γi versus sequence position reveals notable fine structure and variation. To illustrate, we showcase behavior for the two proteins from25 with extreme kf values: PBD IDs 1APS and 1LMB. Figure 4 contrasts profiles of three topological summaries over sequence position for the two proteins. The superposed smooths (1APS in red, 1LMB in green) were obtained using lowess.26 The measures are, respectively, Kτ-NN (Γi), residue level relative contact order (RCOi), and average area buried under folding (AABUF,10, 28), a refinement of hydrophobicity incorporating residue size. For both Γi and RCOi, we see clear differences in terms of overall level between the two proteins, indicative of their bulk (mean) summaries ability to predict folding rate. No such separation is evidenced for AABUF which, indeed, is not associated with folding rates, at least for the proteins considered here (not shown). Further, AABUF does not behave smoothly [Fig. 4(C)] with respect to sequence position. This is in contrast to RCOi [Fig. 4(B)] and, to a much greater extent, Γi [Fig. 4(A)], which exhibits well-defined local minima and maxima.

The existence of these well-defined Γi extremes begs the question as to whether they relate to attributes of the folding process or properties of the 3D protein structure. Unfortunately, there is limited data, at the residue level, for making such assessments. Features of interest, but for which insufficient data is available, include nucleation as measured by a residue's Φ value,21, 29 which provides a measure of the extent to which the residue participates in native-like interactions during the rate limiting folding step, and folding initiation sites. We speculate that residues with small Φ values (not part of folding nuclei) will have small Γi values, the logic being that these small values of Γi correspond to residues that are relatively “unperturbed” by the folding process. This pertains for Villin 14T30 for which we observe [Fig. 5(A)] a significant correlation of 0.66 between Γi and Φ values after trimming four negative and near zero instances for which Φ is less than its standard error.31 The Γi sequence position profile [Fig. 5(B)] reveals considerable fine structure. A ribbon diagram of Villin 14T, colored according to Γi value [Fig. 5(C)], with select extreme Φ and Γi residues (3, 7, 43, 84: see 5A) highlighted, showcases the positive association. Similar to the toy example (see Fig. 1), we generally observe lower Γi values within helices and strands, and higher values at loop inflections, consistent with zipping and assembly mechanisms.2 However, it is important to recognize the highly presumptive nature of these putative associations, in some part attributable to the considerable uncertainties in, and sparsity of, measured Φ values.

Relationship between Φ and Γi values for Villin 14T (PDB ID 2VIK): (A) Points for which both Φ and Γi values are available (see text) are plotted using their sequence position. Correlation = 0.66; (B) Γi profile showing local structure - the rug (blue) gives the sequence position for which Φ values were available; (C) Ribbon diagram colored according to Γi value (blue: low; red: high) and highlighting extreme (Φ, Γi) sequence positions (3, 7, 43, 84: see A).
Now, focusing exclusively on the protein backbone and disregarding side chains, the folding process that transforms a highly denatured random coil, even containing residual sequence-local structure,32 can be coarsely viewed as a mapping
 that is a contraction: there is a real q, 0 ≤ q < 1 such that d(Tui, Tuj) ≤ q · d(ui, uj) for all residues i, j where d(·,·) is Euclidean distance, and ui gives the coordinates of the ith Cα atom. Then, from the Banach fixed point theorem,33 we have that T has a unique fixed point u* such that Tu* = u*. Now, consequences of this result are moot since T is unknown, as are atomic coordinates in the unfolded state. However, by mapping from
  to Sn and invoking the Kτ-NN topology, we can identify the residue closest to the fixed point as i*: Γi* = 0. So, applying this speculation to 1LMB [green trace, Fig. 4(A)] we predict that residue 38 (Γ minima) and neighbors (in view of smoothness of Γ) are (relatively) fixed and, accordingly, are removed from nucleation or initiation sites, as could be determined via Φ analysis. Additional future possibilities include incorporation of such predictions into structure prediction algorithms,19 developing improved characterizations, refinements, and applications of the newly proposed topology, and exploring whether residues predicted as less critical for structural/folding roles are less well-conserved in related sequences.
Acknowledgements
The author thanks Ken Dill, Kevin Plaxco, Ingo Ruczinski, Yuanyuan Xiao, and an anonymous referee for helpful comments and/or data provision.