Human Aha1's N-terminal extension confers it holdase activity in vitro
Abstract
Molecular chaperones are key components of protein quality control system, which plays an essential role in controlling protein homeostasis. Aha1 has been identified as a co-chaperone of Hsp90 known to strongly accelerate Hsp90's ATPase activity. Meanwhile, it is reported that Aha1 could also act as an autonomous chaperone and protect stressed or disordered proteins from aggregation. Here, in this article, a series of in vitro experiments were conducted to verify whether Aha1 has a non-Hsp90-dependent holdase activity and to elucidate the associated molecular mechanism for substrate recognition. According to the results of the refolding assay, the highly conserved N-terminal extension spanning M1 to R16 in Aha1 from higher eukaryotes is responsible for the holdase activity of the protein. As revealed by the NMR data, Aha1's N-terminal extension mainly adopts a disordered conformation in solution and shows no tight contacts with the core structure of Aha1's N-terminal domain. Based on the intrinsically disordered structure feature and the primary sequence of Aha1's N-terminal extension, the fuzzy-type protein–protein interactions involving this specific region and the unfolded substrate proteins are expected. The following mutation analysis data demonstrated that the Van der Waals contacts potentially involving two tryptophans including W4 and W11 do not play a dominant role in the interaction between Aha1 and unfolded maltose binding protein (MBP). Meanwhile, since the high concentration of NaCl could abolish the holdase activity of Aha1, the electrostatic interactions mediated by those charged residues in Aha1's N-terminal extension are thus indicated to play a crucial role in the substrate recognition.
1 INTRODUCTION
Protein homeostasis is essential for the proper functioning of living systems, and those proteins involved in the maintenance of protein homeostasis constitute protein quality control system. According to the life phases of proteins which are managed, the protein quality control pathways are divided and clustered into three major classes including protein biosynthesis, protein folding, and protein degradation (Bukau et al., 2006; Klaips et al., 2018)). Molecular chaperones, which assist the proper folding and prevent the misfolding and/or aggregation of client proteins, are key components of protein folding pathways (Bukau et al., 2006; Hartl et al., 2011; Hartl & Hayer-Hartl, 2009; Horwich, 2011; Saibil, 2013; Saio et al., 2014). Based on the mode of action, molecular chaperones could be classified into three types that including foldases, holdases, and disaggregases (Kim et al., 2013; Richter et al., 2010; Saibil, 2013). The foldases such as Hsp70 and Hsp60 could facilitate the refolding of unfolded proteins, and the corresponding process is usually energy consuming and thus ATP-dependent. The holdases such as small heat-shock proteins (sHsps) and Hsp40 act as the aggregation and/or folding inhibitors of client proteins through binding to their unfolded states. The functioning processes related to the holdases are normally ATP-independent. The third type of chaperones, the disaggregases such as Hsp100 chaperones, is capable of disassembling the protein aggregates typically in an ATP-dependent manner.
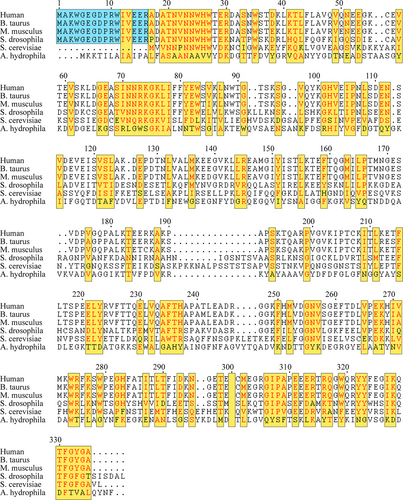
Most of the molecular chaperones exhibit only one type of chaperoning function as aforementioned. However, there are some exceptions. For example, both Hsp70 and Hsp90 hold the ATP-dependent foldase function and also the ATP-independent holdase function (Rutledge et al., 2022). Hsp70 and Hsp90 are the two most abundant and most studied members of the HSP (heat-shock protein) molecular chaperones, and they work as a relay team for protein folding (Moran Luengo et al., 2019; Pearl & Prodromou, 2001; Pearl & Prodromou, 2006; Prodromou & Pearl, 2003; Wegele et al., 2004). Specially, for Hsp90, it has been demonstrated to assist the maturation of hundreds of selected client proteins (Schopf et al., 2017; Wayne et al., 2011). The functioning cycle of Hsp90 is finely tuned by the ATP hydrolysis and the binding of co-chaperones. As known, human genome encodes more than 20 co-chaperones of Hsp90, and among them, Aha1 (Activator of Hsp90 ATPase protein 1) is the only one known to strongly accelerate the ATPase activity of Hsp90 (Biebl & Buchner, 2019; Panaretou et al., 2002; Prodromou, 2016; Retzlaff et al., 2010). It is worth noting that a couple of literatures have reported that Aha1 also has a holdase-like activity independent to its interaction with Hsp90 (Liu & Wang, 2022; Tripathi et al., 2014). More interestingly, it seems like that the holdase-like activity is limited to those Aha1 species from higher eukaryotes, which contain a highly conserved N-terminal extension (Figure 1; Hu et al., 2021).
Aha1 is composed of two structural domains linked with a long unstructured linker region (Hu et al., 2021; Retzlaff et al., 2010). In previously published work, we have solved the solution structure of human Aha1 spanning its primary sequence from T28 to A335 (Hu et al., 2021). According to the obtained structure data, the N-terminal domain of Aha1 adopts an elongated cylindrical fold, and the C-terminal domain of the protein is more globular-like than its N-terminal domain (Hu et al., 2021). Meanwhile, the long linker with extremely high flexibility confers a low restriction to the relative positioning of Aha1's two domains in solution (Hu et al., 2021). In the published work, we also found that Aha1 could interact with the intrinsically disordered protein α-synuclein and inhibit its aggregation (Hu et al., 2021). Overall, although the solution structure of human Aha128-335 and the implication of the N-terminal extension in the exhibition of Aha1's holdase-like activity have been reported, a further verification of the holdase function of Aha1 and also the elucidation of the associated underlying molecular mechanism are still in need. Therefore, here in this article, we conducted both the NMR-based experiments for Aha11-162 structure characterization purpose and the MBP refolding assay aiming to explore the holdase activity of Aha1. According to the NMR data, the N-terminal extension of human Aha1 adopts a random coil conformation in solution and shows no tight contacts with the core structure of Aha1's N-terminal domain. Meanwhile, the obtained results by performing the MBP refolding assay revealed that the N-terminal extension spanning M1 to R16 is responsible for the holdase activity of Aha1. Moreover, since the mutation of two tryptophan residues in the extension only slightly down-regulated the holdase activity of Aha1 in vitro, while the application of high concentration of NaCl could abolish the holdase activity of the protein, the electrostatic interactions mediated by the multiple charged residues in Aha1's N-terminal extension are thus demonstrated to play an important role in the recognition of unfolded substrate.
2 MATERIALS AND METHODS
2.1 Protein sample preparation
Protein samples of Escherichia coli SecB and MBP were produced as reported (Huang et al., 2016). Aha11-162, Aha11-338, Aha11-338W4AW11A (Aha11-338W2A), Aha117-338, and Aha121-338 constructs were cloned into the pET-28a vector containing a His6-tag and a SUMO protease cleavage site at the N-terminus. Aha128-335 and Aha128-338 constructs were cloned into the pET-15b vector containing a His6-tag and a thrombin protease cleavage site at the N-terminus. All constructs were transformed into BL21(DE3) cells for protein expression. For the production of unlabeled protein samples, the bacterial cells were grown in Luria-Bertani medium at 37°C until the absorbance at 600 nm (OD600) reaching about 0.8, then 0.5 mM isopropyl β-D-thiogalactoside (IPTG) was added to induce protein expression. The cells were incubated at 17°C for 18 h before harvesting. For the production of isotope-labeled protein samples, the bacterial cells were grown in M9 medium with 15N-NH4Cl as the source of nitrogen and/or 13C-glucose as the source of carbon. When the OD600 reached 0.4–0.6, the expression of the protein was induced by the addition of 0.5 mM IPTG. The cells were incubated at 17°C for 24 h before harvesting. The cells were harvested by centrifugation and resuspended in lysis buffer (20 mM Tris, 20 mM imidazole, 200 mM KCl, 5 mM β-mercaptoethanol, and pH 7.5). The collected cells were stored at −80°C until future use.
When needed, the cells were lysed using a high-pressure homogenizer and then centrifuged at 11,000 rpm for 40 min. The His6-tagged target proteins were purified by using the nickel affinity chromatography. The His6-tag of Aha11-162, Aha11-338, Aha11-338W2A, Aha11-338W4A, Aha117-338, and Aha121-338 was then removed by ulp1 protease at 25°C (incubation for 1 h), and the His6-tag of Aha128-335 and Aha128-338 was removed by thrombin protease at 25°C (incubation for 16 h). The protein samples were further purified with the size exclusion chromatography on an ÄKTA pure FPLC system using a Superdex 75 column. And, the applied FPLC buffer with its pH at 7.5 contains 20 mM Tris, 150 mM KCl, 0.5 mM EDTA, and 5 mM β-mercaptoethanol. The purified protein samples were analyzed by sodium dodecyl sulfate polyacrylamide gel electrophoresis (SDS-PAGE), and the protein concentrations were determined by using the instrument of Nanodrop (Thermo Scientific, Waltham, Massachusetts).
2.2 Size-exclusion chromatography combined with multiangle static light scattering analysis
Size-exclusion chromatography combined with multiangle static light scattering (SEC-MALS) experiments were conducted at room temperature by using an Agilent 1260 Infinity HPLC system (Agilent Technologies, USA) combined with a DAWN HELEOS-II MALS detector and Optilab T-rEX dRI detector (Wyatt Technology, USA). The wavelength of 280 nm was applied for the UV detection. Protein samples were loaded onto a superdexTM200 increase 10/300 GL column (GE Healthcare, USA) and then eluted by using the mobile phase containing 20 mM Tris, 150 mM KCl, 0.5 mM EDTA and 5 mM β-Mercaptoethanol at pH 7.5. The flow rate for the elution process was set to 0.3 mL/min, and the injection volume was 100 μL. At the beginning of the analysis, BSA at the concentration of 40 μM (P0012-3, Beyotime, China) was loaded onto the column and eluted from the system for the calibration purpose. Then, Aha11-162 at the concentrations of 40, 100, 500, and 1000 μM were subjected to the SEC-MALS measurements. The software of ASTRA 6.1 was used for the analysis of the recorded SEC-MALS data.
2.3 NMR assignments of Aha11-162
Chemical shift assignments of Aha11-162 were obtained using modern NMR techniques. All the NMR spectra (1H-15N-HSQC, HNCA, HNCO/HN(CA)CO pair, HNCACB, HBHA(CO)NH) for the sequence-specific backbone resonance assignments of Aha11-162, and those NMR spectra (1H-15N NOESY-HSQC with a mixing time of 200 ms, 1H-13C-HSQC, HCCH-TOCSY) for the side-chain NMR resonance assignments of the protein were recorded on either Bruker 600 MHz or Bruker 800 MHz NMR spectrometers equipped with TCI cryogenically cooled probes at 25°C. 15N-labeled, 13C-labeled, or 15N, 13C-double-labeled Aha11-162 samples with the concentration at 0.5 mM were applied in aforementioned data acquisition. The NMR spectra were processed by using NMRPipe (Delaglio et al., 1995), and analyzed with CARA (Keller, 2004) and Sparky (Goddard, n.d.). The chemical shift index (CSI) values were calculated and analyzed by using the program of TALOS+ (Shen et al., 2009).
2.4 1H-15N-HSQC NMR spectroscopy
NMR samples of 15N-labeled Aha11-162, and 15N-labeled Aha128-162 were dissolved in the buffer containing 20 mM Tris, 150 mM KCl, 0.5 mM EDTA, 5 mM β-mercaptoethanol, and 10% D2O at pH 7.5. NMR samples of fully folded MBP (15N-labeled) were dissolved in the buffer containing 20 mM Tris and 200 mM NaCl at pH 8.0. NMR samples of unfolded MBP (15N-labeled) were dissolved in the buffer containing 8 M urea, 100 mM HEPES, 20 mM KOAc, and 5 mM Mg(OAc)2 at pH 7.4. NMR samples for detecting the refolding process of MBP were dissolved in the buffer containing 100 mM HEPES, 20 mM KOAc, and 5 mM Mg(OAc)2 at pH 7.4. The protein concentration for recording 1H-15N-HSQC spectra ranges from 0.04 to 0.5 mM. All the 1H-15N-HSQC spectra were recorded on either Bruker 600 MHz or Bruker 800 MHz NMR spectrometers equipped with TCI cryogenically cooled probes at 25°C.
2.5 NMR-based dynamic analysis of Aha11-162
2.6 MBP refolding assay
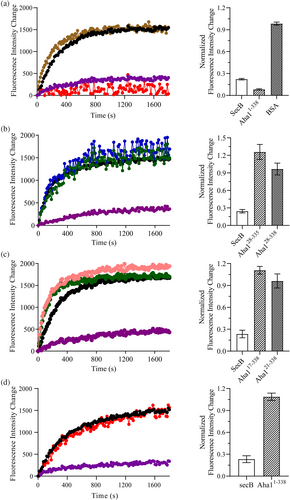
The holdase activity of Aha1 was explored by conducting the MBP refolding assay. The refolding process of MBP without or with the addition of known chaperone SecB, Aha1, or BSA (P0012-3, Beyotime, China) was monitored by the change in the intrinsic Tryptophan fluorescence. The MBP protein was initially dissolved in the unfolding buffer containing 8 M urea, 100 mM HEPES, 20 mM KOAc, and 5 mM Mg(OAc)2 at pH 7.4, and the protein concentration is 80 μM. Then, the refolding of MBP was initiated by a rapid 20 times dilution to the urea-free buffer (100 mM HEPES, 20 mM KOAc, and 5 mM Mg(OAc)2 at pH 7.4). For the refolding experiments with the high concentration of NaCl (500 mM) used, the same experimental procedure as aforementioned was applied. The refolding of MBP was initiated by a rapid 20 times dilution to the urea-free buffer (100 mM HEPES, 500 mM NaCl, 20 mM KOAc, and 5 mM Mg(OAc)2 at pH 7.4). SpectraMax M5 was used to detect the fluorescence change (Ft − F0: Ft represents the fluorescence value at a given time, and F0 is the fluorescence value at time zero) coupled to MBP refolding. The excitation wavelength was set at 285 nm, and the emission wavelength was set to 345 nm. The molar ratios for MBP to SecB, MBP to BSA and MBP to Aha1 applied in the experiments are all 1–4. The obtained fluorescence data were processed by using the software of GraphPad Prism 8.0. As it is shown in the Figure S1, the fluorescence profiles for unfolded MBP (colored in red) and folded MBP (colored in black) at the same concentration of 4 μM exhibit significant intensity differences over the wavelength spanning from 300 to 400 nm. Meanwhile, the fluorescence intensity change values (Ft − F0 values: Ft represents the fluorescence value at a given time, and F0 is the fluorescence value at time zero) for both SecB and BSA at the emission wavelength of 345 nm over the incubation period are all smaller than 100 (Figure S1). A similar result was obtained for Aha1 constructs at the experimental concentration of 16 μM. Although the absolute fluorescence intensities for Aha1 samples at the emission wavelength of 345 nm (Figure S1) are quite large, the fluorescence intensity change values (Ft − F0 values: Ft represents the fluorescence value at a given time, and F0 is the fluorescence value at time zero) for the proteins at the emission wavelength of 345 nm over the incubation period are all smaller than 100 (Figure S1). Therefore, no significant interference effect from the fluorescence intensity changes of SecB, BSA, and Aha1 constructs was involved in the data interpretation of the MBP refolding assay.
2.7 Structure prediction of Aha11-162 by AlphaFold2
The structure of Aha11-162 was predicted by AlphaFold2 Google Colab (https://colab.research.google.com/github/deepmind/alphafold/blob/main/notebooks/AlphaFold.ipynb), and the generated structure was analyzed by using the open-source PyMol 2.5.
3 RESULTS
3.1 Aha11-162 undergoes concentration-dependent oligomerization
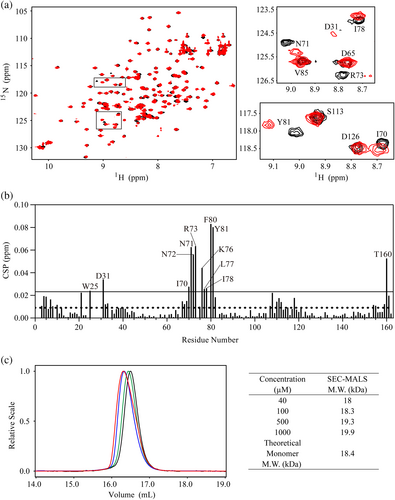
In previous work, we have solved the solution structures of Aha128-162 and Aha128-335 by using NMR approach (Hu et al., 2021). To characterize the structure of Aha1 with the presence of the N-terminal sequence motif spanning M1 to W27, modern NMR techniques were applied. As it has been known, the chemical shifts for specific atoms in chemicals and biological macromolecules (proteins, DNA, RNA, etc.) are dependent to the local chemical environment what they locate. Accordingly, the high-order structure information for desired protein could be extracted from the chemical shifts of the amino acid residues in its primary sequence. Here in our study, chemical shift assignments of Aha11-162 were obtained by using modern NMR techniques. And the backbone resonance assignments for 147 non-proline residues in Aha11-162 were achieved. Meanwhile, mainly due to the severe line broadening, the backbone resonances for the remaining 13 nonproline residues in Aha11-162 were absent in the 15N-edited spectra and thus could not be assigned (Figure S2). Since unexpected line broadening and low signal-to-noise ratio were observed in 15N-edited triple-resonance 3D NMR spectra recorded on Aha11-162, we then suspected that the intermolecular interactions between Aha11-162 single chain might occur in solution. To test this hypothesis, 1H-15N HSQC spectra were recorded by using low concentration (40 μM) and high concentration (500 μM) of Aha11-162. As shown in Figure 2a,b, the amide resonances for a number of residues in Aha11-162 underwent concentration-dependent chemical shift changes. And, most of the affected residues upon the concentration variation clustered to the local fragment spanning I70 to Y81 (Figure 2b). These data suggest that Aha11-162 might oligomerize at high concentration through the self-association of the specific fragment covering I70 to Y81. This finding is further supported by the SEC-MALS analysis data. Comparison of the UV traces for Aha11-162 samples with different concentrations at 40, 100, 500, and 1000 indicated samples with higher concentrations to be eluted earlier, suggestive of self-association (Figure 2c). In line with the SEC profiling results, Aha11-162 at higher concentrations exhibited larger transparent molecular weights derived from the MALS analysis (Figure 2c). Besides, since the determined transparent molecular weights for Aha11-162 at four concentrations are all close to the theoretical molecular weight of monomeric Aha11-162 (Figure 2c), we then conclude that a weak and dynamic self-association is expected for the protein at high concentration.
3.2 The N-terminal extension of human Aha1 adopts random coil conformation and has no tight contacts with the core structure of Aha1's N-terminal domain
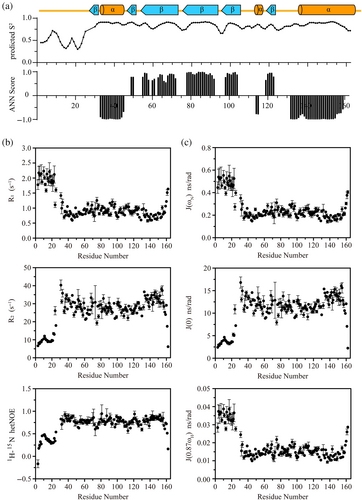
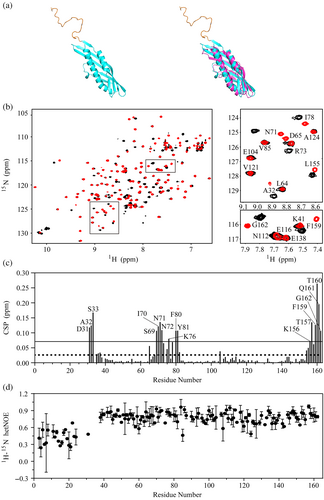
Based on the assigned backbone resonances of Aha11-162, the secondary structural elements within the protein were identified through the calculation of the CSI values (Figure 3a). This analysis revealed that the presence of N-terminal sequence motif spanning M1 to W27 does not modify the global fold of Aha1's N-terminal domain spanning T28 to G162 (Figure 3a). Moreover, The CSI data demonstrated that the N-terminal sequence motif of Aha1 spanning M1 to W27 mainly adopts a random coil conformation (Figure 3a). In support of this finding, compared with the dynamics behavior of the core region, extremely high flexibility was observed for the N-terminal sequence motif of Aha1 spanning M1 to W27 (Figure 3b,c). The average 1H-15N hetNOE, R1 and R2 values for the sequence motif were calculated to be 0.334 ± 0.140, 1.927 ± 0.259, and 10.821 ± 4.150, respectively. In the meanwhile, the determined 1H-15N hetNOE, R1 and R2 values for the core region of Aha1's N-terminal domain (T28–T160) are 0.784 ± 0.077, 0.874 ± 0.155, and 28.840 ± 3.950, respectively. The significant difference between Aha1's very N-terminal sequence motif spanning M1 to W27 and the core region of Aha1's N-terminal domain indicates that they do not form tight contacts to each other. To further verify this conclusion, the NMR spectra including 1H-15N NOESY-HSQC, 1H-13C-HSQC, and HCCH-TOCSY for the side-chain NMR resonance assignments of Aha11-162 were acquired. According to the assigned 1H-15N NOESY-HSQC data (Figure S3), only NOEs restricted to the local region were detected for the N-terminal sequence motif spanning M1 to W27 of Aha1. This result confirmed that the N-terminal extension of human Aha1 spanning M1 to R16 adopts random coil conformation and has no tight contacts with the core structure of Aha1's N-terminal domain.
As aforementioned, Aha11-162 undergoes concentration-dependent oligomerization in solution. To further clarify whether human Aha1's N-terminal extension presents modulation effect on the core structure of the protein at its monomeric state, NMR experiments were conducted using Aha11-162 at the concentration of 40 μM. As shown in Figure 4a, the structure of monomeric Aha11-162 predicted by AlphaFold2 indicates that the N-terminal sequence motif of Aha1 spanning M1 to W27 is in random coil conformation, while the remaining core region adopts an elongated cylindrical fold similar to the solved structure of Aha128-162. In support of the AlphaFold2 prediction data, only the amino acid residues either locating neighborly to the W27-T28 linking motif (such as D31, A32, and S33) or spatially close to the linking region (segments spanning S69 to Y81 and K156 to G162) exhibited significant chemical shift changes upon the attachment of Aha1's N-terminal sequence motif covering M1 to W27 (Figure 4b,c). It should be mentioned here that due to the severe line broadening, the amide resonances of T28, E29, and R30 were absent in the 1H-15N HSQC spectrum of Aha11-162. Therefore, the expected chemical shift changes of these three residues could not be detected. In line with the finding derived from the AlphaFold2 prediction and the 1H-15N HSQC data, the determind 1H-15N hetNOE values for Aha11-162 at low protein concentration (40 μM) revealed that the N-terminal sequence motif of Aha1 spanning M1 to W27 exhibited an extremely high flexibility. The dynamics feature of Aha1's N-terminal sequence motif spanning M1 to W27 demonstrates that this region is in an unstructured state which independent to the core structure of Aha11-162.
3.3 Human Aha1's N-terminal extension confers it holdase activity in vitro
After the characterization of the structure for human Aha1's N-terminal extension spanning M1 to R16, MBP refolding assay was carried out to validate the holdase activity of human Aha1 in vitro. In our previous work, we found that both the N-terminal region spanning M1 to W27 and the C-terminal sequence motif R336LF338 of human Aha1 potentially contribute to its interaction with intrinsically disordered α-synuclein (Hu et al., 2021). Therefore, here in this study, to test whether the N-terminal extension of human Aha1 plays an essential role in the display of Aha1's expected holdase activity, full-length Aha1 (Aha11-338) and its truncations including Aha128-335, Aha128-338, Aha121-338, and Aha117-338 were produced and applied in the fluorescence-based MBP refolding assay. During the experiments, the refolding process of MBP without or with the addition of known chaperone SecB, BSA serving as a negative control or Aha1 and its truncations was monitored by the change in the intrinsic tryptophan fluorescence (Figure 5). According to the obtained data, only the full-length Aha1 (Aha11-338) showed a holdase activity against the denatured MBP (Figure 5a–c). The absence of Aha1's N-terminal extension (Aha117-338) fully abolished the holdase activity of the protein, and a similar fluorescence emission profile to that of MBP alone was observed for the MBP:Aha117-338 (molar ration at 1:4) mixture sample (Figure 5c). The fluorescence data indicated that human Aha1 could act as a holdase in vitro, and its N-terminal extension is essential for the holdase activity display. As it is shown in Figure 1, there are two tryptophan residues (W4 and W11) in human Aha1's N-terminal extension. To test if these two hydrophobic residues play an important role in recognizing the denatured MBP, the double mutant of these two tryptophans (Aha11-338W2A) was produced and subjected to the MBP refolding assay. We then found that the mutation of tryptophan residues only caused a slight downregulation of Aha1's holdase activity against the denatured MBP (Figure S4). Besides two extremely hydrophobic tryptophan residues (W4 and W11), human Aha1's N-terminal extension is also featured with six charged residues (K3, E6, D8, R10, E14, E15, and R16). To test whether the possible electrostatic interactions mediated by these charged residues contribute to the recognition of unfolded MBP, the MBP refolding experiments were carried out with the application of high concentration of salt (500 μM NaCl). According to the obtained data, the presence of high concentration of NaCl could abolish the holdase activity of Aha1 (Figure 5d). Therefore, the electrostatic interactions mediated by the multiple charged residues in Aha1's N-terminal extension are supposed to play a driving role in the recognition of unfolded MBP.
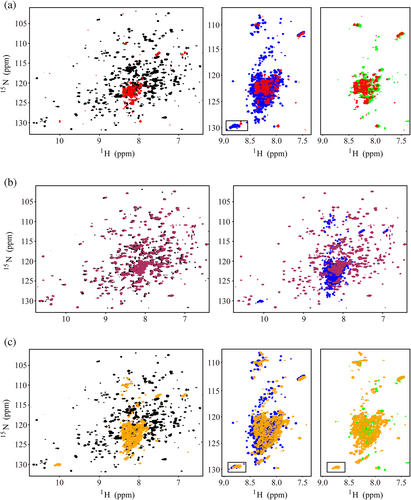
Besides the fluorescence approach, 1H-15N HSQC technique was also applied to monitor the refolding process of MBP without or with the addition of known chaperone SecB or Aha1 and its truncations/mutant (Figures 6 and S5). In consistent with the results of the fluorescence-based refolding assay, both SecB and full-length human Aha1 could fully block the refolding process of unfolded MBP. As shown in Figure 6a, after an incubation with either SecB or full-length Aha1, the 1H-15N HSQC spectra of MBP showed a feature of unstructured protein with the amide proton resonances crowdedly distributing to the region spanning 7.5–8.5 ppm. Meanwhile, when Aha117-338, Aha121-338, and Aha128-338 were applied, the 1H-15N HSQC data demonstrated that MBP switched from the unfolded state to the folded state. And after the incubation, the 1H-15N HSQC spectrum for unfolded MBP mixed with Aha1 truncations showed a feature of structured protein with the amide proton resonance distribution extending to both the higher field and the very low field regions (Figures 6b and S5). Additionally, in support of the conclusion derived from the fluorescence-based refolding assay, the presence of the double mutant of two tryptophans (Aha11-338W2A) also exhibited a prevention effect on the refolding process of MBP. When Aha11-338W2A was applied, the 1H-15N HSQC spectrum of MBP showed a feature of unstructured protein (Figure 6c).
4 DISCUSSION
Protein homeostasis is tightly regulated by the protein quality control system that ensures the precise control of protein synthesis, protein folding, and protein turnover and degradation. Molecular chaperones, which are capable of assisting the proper folding of client proteins and/or preventing protein misfolding and aggregation, are key components of the protein quality control system (Bukau et al., 2006; Hartl et al., 2011; Hartl & Hayer-Hartl, 2009; Horwich, 2011; Saibil, 2013; Saio et al., 2014). According to the mode of action, molecular chaperones could be classified into foldases, holdases, and disaggregases (Kim et al., 2013; Richter et al., 2010; Saibil, 2013). Here in this manuscript, we demonstrated that Aha1, a stimulator of molecular chaperone Hsp90, presents holdase activity in vitro. As that revealed by the sequence alignment result (Figure 1), Aha1 from higher eukaryotic species contain a highly conserved N-terminal extension spanning M1 to R16 (M1AKWGEGDPRWIVEER16), and this conserved extension is featured with six charged residues and two extremely hydrophobic residues including W4 and W11. By conducting NMR experiments and SEC-MALS analysis, we found that Aha11-162 underwent concentration-dependent oligomerization through the self-association of the specific fragment covering I70 to Y81 (I70NNRKGKLIFFY81) in solution (Figures 2 and S2). Since the oligomerization of Aha11-162 does not occur at the concentration of tens of micromolar range, the conformation transition of Aha1 might not be physiological function relevant in a normal cellular context. However, Aha1 has been reported to be recruited to stress granules, which are non-membranous organelles formed in response to different stress stimuli (Pare et al., 2009). Therefore, there is a possibility that Aha1 oligomerization could occur under cellular stress conditions. Specially, the self-associating capability of Aha1 could potentially contribute to the condensate formation linked with stress granules. After the characterization of Aha1's oligomerization behavior, NMR experiments were carried out to characterize the structure of the N-terminal extension of human Aha1, and the chemical shift data, the dynamics analysis results, and also the detected NOE pattern demonstrated that human Aha1's very N-terminal region adopts a random coil conformation and shows no tight contacts with the core structure of Aha11-162 (Figures 3, 4, and S3). Overall, the N-terminal extension of human Aha1 is featured with a primary sequence containing multiple charged residues and two very hydrophobic tryptophans (M1AKWGEGDPRWIVEER16) and the intrinsically disordered tertiary structure.
As it has been reported, Aha1 has a holdase-like activity independent to its interaction with Hsp90 (Hu et al., 2021; Liu & Wang, 2022; Tripathi et al., 2014). Therefore, after the structure characterization of Aha1's N-terminal extension, fluorescence-based and 1H-15N HSQC-based MBP refolding experiments were performed to investigate whether Aha1 does have a holdase activity in vitro and also the essentiality of Aha1's N-terminal extension in the holdase activity display of the protein. According to the obtained results, full-length human Aha1 exhibited a structure stabilization activity against unfolded MBP, and MBP refolding process was stopped upon the presence of either Aha1 or another known holdase SecB (Figures 5 and 6). Moreover, the holdase activity of Aha1 was abolished by the truncation of its N-terminal extension spanning M1 to R16 (Figures 5 and 6). As known, fuzziness spans a broad spectrum of protein–protein interactions involving IDPs and IDRs (intrinsically disordered proteins and intrinsically disordered regions) (Weng & Wang, 2020). Taking together the primary sequence of Aha1's N-terminal extension spanning M1 to R16 (M1AKWGEGDPRWIVEER16) and its intrinsically disordered structure feature, the fuzzy-type protein–protein interactions involving this specific region and other disordered/unfolded proteins are expected. As aforementioned, six charged residues (K3, E6, D8, R10, E14, E15, and R16) and two extremely hydrophobic residues (W4, W11) are included in Aha1's N-terminal extension, we then proposed that the long-range multisite electrostatic interactions and the short-range Van der Waals contacts might be involved in the recognition of unstructured MBP by Aha1's N-terminal extension. According to the following conducted experiments, the double mutation of two tryptophans to alanine only showed a slight modulation effect on the holdase activity of Aha1 (Figures 6 and S4), while the application of high concentration of NaCl could abolish the holdase activity of Aha1 (Figure 5). We thus conclude that the long-range multisite electrostatic interactions serve as a dominant factor in driving the recognition of unfolded MBP by human Aha1.
In summary, the highly conserved N-terminal extension of Aha1 from higher eukaryotes confers the protein a holdase activity in vitro, and the intrinsically disordered structure feature of this specific region indicates a potential fuzzy-type interaction between it and the unfolded substrate protein. Moreover, it is worth noting that only one possible substrate protein in response to the holdase activity of Aha1 has been reported (Liu & Wang, 2022). And Aha1's holdase activity in vivo needs to be explored further. Meanwhile, since Aha1 has been found to be recruited to the stress granules, the potential roles of Aha1's self-association and its capability to interact with those disordered proteins in the condensate formation is also need to be clarified.
AUTHOR CONTRIBUTIONS
Junying Tang: Writing—original draft; investigation. Huifang Hu: Investigation. Chen Zhou: Methodology; investigation. Naixia Zhang: Writing—review and editing; methodology; Writing—original draft.
ACKNOWLEDGMENTS
We are grateful for financial support from the National Natural Science Foundation of China (Grant Nos. 32171220, 22107111, and 21977105), the Shanghai Municipal Science and Technology Major Project, and the Youth Innovation Promotion Association of the Chinese Academy of Sciences (2022284). The NMR data were recorded in the Institutional Center for Shared Technologies and Facilities of SIMM, Chinese Academy of Sciences. The SEC-MALS data were recorded in the National Facility for Protein Science in Shanghai of Shanghai Advanced Research Institute.
CONFLICT OF INTEREST STATEMENT
The authors declare that they have no known competing financial interests or personal relationships that could have appeared to influence the work reported in this article.


