The Ca2+ response of a smart forisome protein is dependent on polymerization
Judith Rose and Izabella Brand contributed equally to this study.
Funding information: Deutscher Akademischer Austauschdienst, Grant/Award Number: 57449009; H2020 Research Infrastructures, Grant/Award Number: 3733; Ministry of Innovation, Science, Research and Technology of the State of North Rhine-Westphalia, Grant/Award Number: FKZ W 044 A; Narodowa Agencja Wymiany Akademickiej, Grant/Award Number: PPN/BIL/2018/1/00103
Abstract
Forisomes are giant self-assembling mechanoproteins that undergo reversible structural changes in response to Ca2+ and various other stimuli. Artificial forisomes assembled from the monomer MtSEO-F1 can be used as smart biomaterials, but the molecular basis of their functionality is not understood. To determine the role of protein polymerization in forisome activity, we tested the Ca2+ association of MtSEO-F1 dimers (the basic polymerization unit) by circular dichroism spectroscopy and microscale thermophoresis. We found that soluble MtSEO-F1 dimers neither associate with Ca2+ nor undergo structural changes. However, polarization modulation infrared reflection absorption spectroscopy revealed that aggregated MtSEO-F1 dimers and fully-assembled forisomes associate with Ca2+, allowing the hydration of poorly-hydrated protein areas. A change in the signal profile of complete forisomes indicated that Ca2+ interacts with negatively-charged regions in the protein complexes that only become available during aggregation. We conclude that aggregation is required to establish the Ca2+ response of forisome polymers.
Abbreviations
-
- MALS
-
- multi-angle light scattering
-
- MST
-
- microscale thermophoresis
-
- PM IRRAS
-
- polarization modulation infrared reflection absorption spectroscopy
-
- SDS-PAGE
-
- sodium dodecylsulfate polyacrylamide gel electrophoresis
-
- SEO-F
-
- sieve element occlusion by forisome
-
- SUMO
-
- small ubiquitin-related modifier
1 INTRODUCTION
Forisomes are giant mechanoproteins that are naturally found in the phloem sieve elements of leguminous plants (family Fabaceae), where their role is to plug the phloem following injury, preventing the loss of photoassimilates.1 According to the current model, forisome protein dimers are the basic structural units, and their polymerization produces filaments.2 Two filaments align to form helical fibrils, which assemble into higher-order fibril bundles and fibers, the largest substructures of the forisome.3, 4 The assembly of multiple fibers produces spindle-shaped forisome bodies up to 55 μm in length and 5 μm in width,4-6 although the actual size depends on the plant species and the diameter of the sieve element.7 This coordinated, spontaneous assembly process is an inherent property of structure-forming forisome proteins such as MtSEO-F1, the most widely-investigated member of the sieve element occlusion by forisome (SEO-F) protein family in Medicago truncatula (Mt). Accordingly, MtSEO-F1 can assemble into artificial forisomes when expressed in diverse hosts, including plants such as Nicotiana benthamiana and the yeast Saccharomyces cerevisiae.8 The ability to express forisome proteins in heterologous systems also facilitates their genetic modification and augmentation, such as their fusion to enzymes9 or antibody-binding epitopes for positioning in technical devices.4
The development of forisomes as smart biomaterials reflects their ability to undergo an anisotropic conformational change in vitro in less than 1 s when exposed to Ca2+ at concentrations of 25–60 μM,10 higher concentrations of Sr2+ or Ba2+, or a pH below 4.9 or above 9.5.8, 11 This conformational change, which does not require adenosine triphosphate, is characterized by the longitudinal contraction and radial swelling of the protein body. It is fully reversible, allowing forisomes to re-adopt their longitudinally expanded state11 (Figure S1). Forisomes can undergo more than 5,000 cycles of contraction and expansion in response to electro-titration, highlighting the reliability and resilience of these biopolymers.3 In the condensed state, forisomes have a crystalline or para-crystalline spindle structure due to the tight packing of fibers,4 but the conformational change converts the spindle into a plug-like aggregate and increases the volume of artificial MtSEO-F1 forisomes by up to 12-fold in vitro.12 These reactions convert ~2.3 pJ of chemical energy into mechanical energy and thereby generate forces of 120 nN longitudinally and 40 nN radially per contraction or expansion reaction.3, 13
The energy required for the forisome conformational change probably derives from interactions with ions, producing Coulomb forces.3, 13 However, the Ca2+-binding site of forisome proteins has yet to be identified. SEO-F proteins contain a potential thioredoxin fold domain that may function as an acidic platform for cation association,14 and the mutation of three aspartate residues in the neighboring C-terminal domain inhibits the Ca2+ response of artificial forisomes.15 Even so, it remains unclear how forisome proteins associate with Ca2+, and which structural changes in the protein lead to the remarkable contraction of the complex.
Here, we investigated the Ca2+ association and resulting structural changes of the forisome protein MtSEO-F1 in different aggregation states, from soluble dimers via an intermediate assembly stage to complete forisomes. We established a new protocol to prepare highly pure soluble MtSEO-F1 proteins and analyzed the behavior of the soluble and aggregated forms using state-of-the-art biophysical methods: circular dichroism (CD) spectroscopy, microscale thermophoresis (MST), and polarization modulation infrared reflection absorption spectroscopy (PM IRRAS). This combination of methods provided insight into the interaction between forisome components and Ca2+, improving our understanding of these smart biopolymers and their response to divalent cations.
2 RESULTS AND DISCUSSION
2.1 Forisome protein MtSEO-F1 in a soluble state
To gain insight into the interaction between forisomes and Ca2+, we initially sought to test the soluble MtSEO-F1 protein using a panel of biophysical methods. However, we first had to overcome the challenge of producing a soluble form of MtSEO-F1 that did not form spontaneous aggregates. MtSEO-F1 has the inherent tendency to form aggregates primarily via hydrophobic interactions, and typically produces inclusion bodies when expressed in bacteria.2
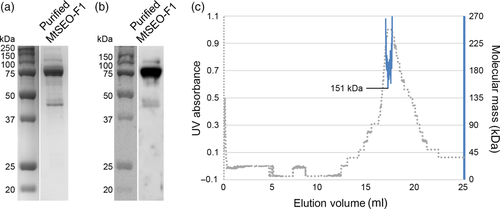
We were able to produce large quantities of stable and soluble MtSEO-F1 for the first time by fusing the protein to a small ubiquitin-related modifier (SUMO) tag. Even when the tag was removed with a SUMO protease, MtSEO-F1 remained in solution and did not aggregate. The SUMO tag allowed the recovery of highly pure MtSEO-F1, as shown by the dominant 75-kDa band (the expected size of the MtSEO-F1 monomer) revealed by denaturing sodium dodecylsulfate polyacrylamide gel electrophoresis (SDS-PAGE) and western blots probed with an MtSEO-F1-specific antibody (Figure 1a,b). The minor impurities of 40, 45, 60, and 100 kDa were identified as fragments and aggregates of MtSEO-F1 because they were detected by the same antibody (Figure 1b). However, given the dominance of the 75-kDa band compared to impurities in the SDS-PAGE and western blot experiments, we continued to use this purified MtSEO-F1 protein. Size-exclusion chromatography followed by multi-angle light scattering (MALS) was used to separate the full-length MtSEO-F1 protein from its fragments and simultaneously determine the precise molecular weight of the soluble MtSEO-F1 protein (Figure 1c). The eluting protein produced a single UV absorbance peak at 16.8–17.5 ml suggesting that full-length MtSEO-F1 and all its fragments eluted simultaneously and could not be separated. The proteins eluting in the single MALS peak ranged from 151 to 265 kDa, and the minimum value of 151 kDa coincided with the highest UV absorption. This minimum molecular weight was also in good agreement with the predicted mass of the MtSEO-F1 dimer (149 kDa), but MALS detected no species corresponding to the monomer (74.8 kDa). The higher molecular weights detected by MALS are probably caused by MtSEO-F1 fragments that stick to the dimers, also explaining why they could not be separated. We therefore concluded that soluble MtSEO-F1 proteins mainly form dimers and a lower quantity of higher-order aggregates, whereas MtSEO-F1 monomers are not present in solution but can be produced by denaturation prior to SDS-PAGE. These data support our model in which the dimer is the smallest stable aggregation state and serves as the main building block during filament polymerization and forisome assembly.2 We therefore used our panel of biophysical methods to determine the influence of Ca2+ on the MtSEO-F1 dimers.
2.2 Influence of Ca2+ on MtSEO-F1 dimers in solution
The Ca2+-induced conformational change of whole forisomes is well documented16 but it is unclear how this translates to the various forisome substructures. We hypothesized that Ca2+ might bind to each forisome protein dimer, causing a conformational change that propagates to higher-order structures and ultimately the entire forisome. We used two methods to test this hypothesis and focused on structural changes at the secondary and tertiary/quaternary levels as indicators of Ca2+ association. CD spectroscopy was used to observe potential changes in secondary structure, whereas MST was used to monitor changes in tertiary and quaternary structure and also to determine Ca2+-binding affinity.
2.2.1 CD spectroscopy
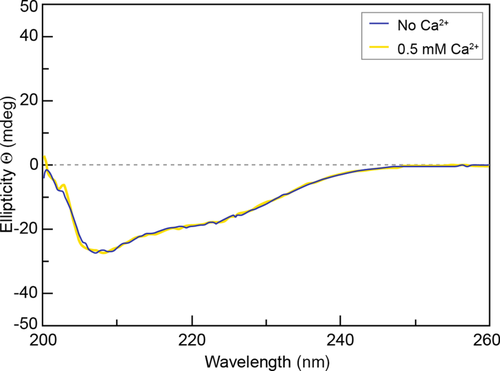
CD spectroscopy allows the assignment of secondary structures based on empirical spectral properties, but comparisons with databases of solved protein secondary structures are used to improve accuracy.17 In the case of forisome proteins such as MtSEO-F1, the secondary structural elements of closely related proteins have not yet been determined, so the CD spectra can only provide estimates of the relative abundance of different secondary structures. Accordingly, CD data were used to detect changes in the secondary structure of MtSEO-F1 dimers in the presence and absence of 0.5 mM Ca2+. We first confirmed that the buffer solution did not influence the CD spectra recorded in the range 200–260 nm (Figure S2). The curves representing MtSEO-F1 dimers in the absence and presence of Ca2+ were similar, with minima at 208 and 222 nm, which signifies the presence of α-helices (Figures 2 and S3). The predicted secondary structure was composed of 37% disordered regions, 14% β-turns, 25% β-sheets, and 24% α-helices. Overall, these data indicated that the secondary structure of MtSEO-F1 dimers is not affected by the presence of Ca2+. This makes it unlikely that changes in secondary structure at the level of individual dimers accumulate to trigger the remarkable Ca2+-induced conformational changes observed in whole forisomes. However, this left the possibility that Ca2+ may influence the overall fold of the dimers, so we used MST to investigate changes in tertiary and quaternary structure following the addition of Ca2+.
2.2.2 Microscale thermophoresis
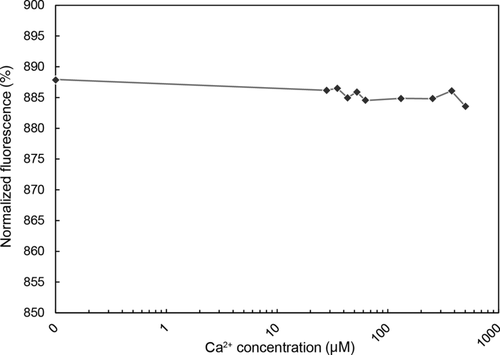
MST detects changes in the spherical shape, ionic loading or water shell of soluble proteins by measuring their diffusion relative to an interaction partner within a temperature gradient. By gradually changing the concentration of the interaction partner, we can determine the binding constant and affinity of the protein for this partner. We labeled purified MtSEO-F1 dimers with the red fluorescent dye NT-647-NHS. The protein concentration was kept constant at 182.5 nM while we altered the Ca2+ concentration in the range 0–501 μM. These concentrations were chosen to meet and exceed the threshold Ca2+ concentration (20–50 μM) that induces MtSEO-F1 artificial forisomes to undergo a conformational change.4 Before each MST measurement, all capillaries were scanned to confirm a similar fluorescence level and to ensure that adhesion to the capillary material did not hinder the free diffusion of proteins (Figure S4).
The MST results are presented as the fluorescence ratio before and after thermophoretic movement plotted against increasing Ca2+ concentrations (Figure 3). The values in the range of Ca2+ concentrations that promote forisome conformational changes varied from 886‰ at 27 μM Ca2+ to 885‰ at 62 μM Ca2+. The binding of Ca2+ to MtSEO-F1 dimers should produce a sigmoid curve, but we observed no change in normalized fluorescence as the Ca2+ concentration increased, so we were unable to determine the dissociation constant. In addition, we observed no measurable change in the tertiary or quaternary structure of the MtSEO-F1 dimers in response to Ca2+.
Taken together, the CD and MST data suggested that MtSEO-F1 dimers do not associate with Ca2+. As stated above, a Ca2+-binding site has yet to be identified empirically or in silico in the SEO-F protein family despite the presence of a potential thioredoxin fold domain that could function as a platform for low-affinity and high-capacity Ca2+ adsorption, as described for calsequestrin in mammalian muscle cells.14, 18 However, calsequestrin features three thioredoxin fold domains with 24%–29% negatively charged amino acids in each,19 whereas MtSEO-F1 has one potential thioredoxin fold domain with 18% negatively charged amino acids. Our results also provided no empirical evidence that Ca2+ associates with MtSEO-F1 dimers, almost certainly excluding the presence of an undiscovered Ca2+-binding site.
2.3 The response of MtSEO-F1 aggregates to Ca2+
2.3.1 MtSEO-F1 dimers adsorbed on a gold surface
Given that forisomes clearly undergo a striking conformational change triggered by Ca2+, cation association must instead occur at a higher level of forisome substructure. Such an interaction could disturb the arrangement of filaments and fibrils within the forisome body, possibly by generating repulsive Coulomb forces.20 To test this idea experimentally, we adsorbed MtSEO-F1 dimers onto a gold surface to generate a continuous protein film, in which large agglomerates of the protein are likely to form. These films were analyzed by PM IRRAS as a model system to investigate Ca2+ association at the level of MtSEO-F1 protein aggregates somewhere between the soluble dimer and the giant forisome body. Soluble MtSEO-F1 protein in D2O electrolyte solution one (pD 5.6) was adsorbed onto a gold surface, favoring intermolecular interactions and thus the inherent tendency of MtSEO-F1 to form aggregates.2 This allowed us to analyze MtSEO-F1 polymers that are less complex than whole artificial forisomes, focusing on their response to Ca2+ in terms of secondary structure, hydration, and potential effects on functional groups in the agglomerated protein.
The background-corrected PM IRRA spectra of the MtSEO-F1 film over the range 1,800–1,300 cm−1 are shown in Figure 4a. Figure S5a shows the corresponding raw PM IRRA spectra. The most prominent band (centered at 1660 cm−1) corresponded to the amide I′ mode that originates predominantly from ν(C═O) stretches of the peptide bond in the polypeptide backbone.21 This is sensitive to the secondary structure of the protein, and appeared broad and asymmetric for MtSEO-F1, reflecting the complex structure of this protein. Fourier self-deconvolution (FSD) and second derivative procedures were used to deconvolute the amide I′ mode (Figure S6). Deconvolution of the amide I′ band revealed six individual modes corresponding to different secondary structures. Two modes were assigned to β-sheets (1,694 and 1,625 cm−1), and one was assigned to α-helices (1,654 cm−1). The assignment of the position of the amide I′ mode to other structural elements (e.g., β-turns or random coils) was recently found to be more complex22, 23 than reported previously.24 Thus, the modes at 1,681 and 1,639 cm−1 were assigned to “other structural elements” because they represent nonhelical and non-β-sheet structures. The sixth band (at 1,669 cm−1) was not easy to assign, but uncommon structures such as 310 helices and π helices absorb infrared radiation in this spectral region,24 and appear in response to hydration changes in α-helices.25 Hydrophobic clusters in the folded polypeptide can upshift the amide I′ mode of α-helices toward higher wavenumbers26 and the aggregation of helices is known to upshift the amide I′ mode (to 1,665–1,670 cm−1).27 According to the predicted structure of the MtSEO-F1 monomer,28 α-helices are abundant in the domain that mediates protein dimerization driven by hydrophobic interactions2 and α-helices may therefore aggregate due MtSEO-F1 dimerization. We therefore assigned the 1,669 cm−1 band to hydrophobic α-helices.
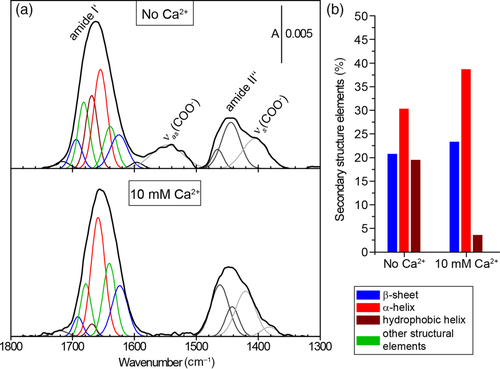
The other mode characteristic of proteins is amide II, which represents CN stretches and NH in-plane bends in the peptide bond, and is sensitive to the isotopic substitution of the amide groups. The use of D2O instead of H2O therefore caused a downshift of the amide II′ mode (to 1,480–1,410 cm−1).24, 29 Deconvolution of the amide II′ mode revealed two components centered at 1,467 and 1,448 cm−1, respectively. Carboxylate groups present in the MtSEO-F1 side chains added two further modes, with νs(COO−) stretches centering at 1,405 cm−1 and νas(COO−) stretches forming a broad band centered at 1,540 cm−1. This indicated that carboxylate residues in amino acid side chains were deprotonated.
Several spectral changes were observed when the MtSEO-F1 film was exposed to Ca2+. The stretching modes of carboxylate groups were the most significantly affected by the interaction with Ca2+ (Figure 4). The νas(COO−) mode was attenuated and could not be distinguished from the background spectrum (Figure S5a). In contrast, the νs(COO−) mode became more intense and diverged into two components at 1,420 and 1,386 cm−1. These changes indicated that Ca2+ ions interacted directly with the carboxylate groups of aspartic and glutamic acid residues because the position of carboxylate stretching modes partly depends on the coordination of the cation to this group.30, 31 The splitting of the νs(COO−) mode resulted from a concurrent downshift (1,386 cm−1 band) and upshift (1,420 cm−1 band), indicating the monodentate and bidentate coordination of Ca2+ by the carboxylate groups.30 The simultaneous decreasing intensity of νas(COO−) and increasing intensity of νs(COO−) are likely to reflect a molecular scale order in the self-assembled protein film on the gold surface.32 According to the IRRAS surface selection rule, attenuation at one mode must be connected to enhancement at another because the transition dipole moment vectors of the νas(COO−) and νs(COO−) modes are perpendicular.32
Further spectral changes were observed for the amide I′ mode. The bands assigned to α-helices (1,654 cm−1) and to other secondary structures at 1,639 cm−1 upshifted to 1,658 and 1,643 cm−1, respectively. Exposing the MtSEO-F1 film to Ca2+ caused the mode at 1,669 cm−1 to disappear. Ca2+ binding therefore appears to influence the hydrophobic environment of the dimers in the adsorbed state. Quantitative analysis of secondary structures in the amide I′ band in the presence and absence of Ca2+ (Figure ) revealed that the abundance of β-sheets increased from 20% to 23% when Ca2+ was added, in broad agreement with the CD data, whereas the α-helices represented by the mode at 1,654 cm−1 increased from 30% to 38%. The presumably hydrophobic helices (mode 1,669 cm−1) constituted ca. 20% of all structural elements of the adsorbed MtSEO-F1. These values differ from the CD results, but given the IRRAS surface selection rule, the proportions of secondary structures in the anisotropic MtSEO-F1 film may differ from those of the isotropic MtSEO-F1 protein in solution.32 In PM IRRAS, the intensity of the IR absorption bands depends not only on the concentration of the molecules but also on their average orientation in the film, which is determined by the angle between the electric field vector of the IR beam (normal to the surface) and the average orientation of the transition dipole moment of a given vibration mode in the adsorbed molecule. If the orientation is uniform, some modes may be enhanced while others are attenuated. The adsorption of forisome dimers resulted in the formation of ordered aggregates, so the proportions of different secondary structure values determined by PM IRRAS may not reflect the real composition due to the surface selection rule.
Based on the observed spectral changes, the abundance of hydrophobic helices dropped below 5% in response to Ca2+ association. This indicated a transition to hydrated α-helices, possibly contributing to the concurrent increasing abundance of hydrated α-helices and other structures. Ca2+ is likely to introduce large amounts of water into the system because it coordinates seven water molecules in its first hydration shell.31 Furthermore, Ca2+ association probably expanded the tertiary structure so that water gained access to formerly dehydrated areas.
To summarize, adsorbed MtSEO-F1 produced a well-ordered anisotropic film on the gold surface, and PM IRRAS data indicated that MtSEO-F1 aggregates interact with Ca2+ via the carboxylate groups of aspartic and glutamic acid residues, changing the hydration status of hydrophobic helical regions. Minimal changes in the overall content of the secondary structure elements indicated that the Ca2+ association in MtSEO-F1 aggregates does not require the adaptive refolding of secondary structures. Together with the CD and MST analysis of soluble MtSEO-F1 dimers, we have strong evidence that MtSEO-F1 can only associate Ca2+ in the form of higher-order aggregates or protein films.
2.3.2 MtSEO-F1 forisomes adsorbed on a gold surface
Finally, we adsorbed complete artificial MtSEO-F1 forisomes to the gold surface, allowing us to compare results obtained from soluble dimers, substructural aggregates and the fully-assembled protein polymer. This also permitted the first high-resolution analysis of potential secondary structural changes in the fully-assembled forisome in response to Ca2+. Artificial MtSEO-F1 forisomes expressed in yeast were purified by density gradient centrifugation. We confirmed the dispersion reaction in response to Ca2+ and observed the characteristic longitudinal contraction and lateral dispersion, accompanied by an increase in forisome volume8 (Figure 5a). We then adsorbed the forisomes onto a gold surface and collected PM IRRA spectra as described above for the adsorbed MtSEO-F1 dimers.
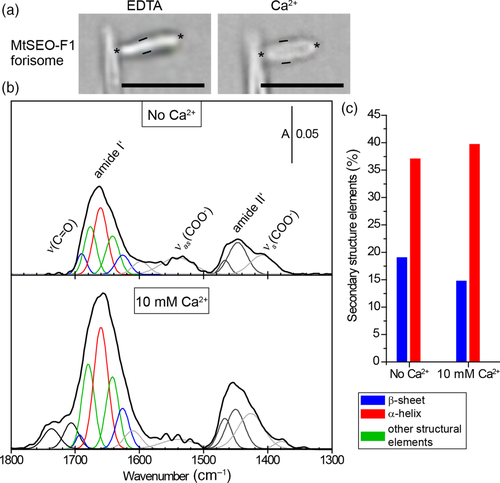
The spectra before and after exposure to Ca2+ are shown in Figure 5b, along with the deconvoluted signals (the corresponding raw spectra are shown in Figure S5b). Characteristic amide I′ and amide II′ signals were observed as broad and asymmetric modes centered at 1,659 and 1,445 cm−1, respectively. FSD and second derivative procedures were used to deconvolute the amide I′ and II′ modes (Figure S7 shows the data for amide I′). The deconvoluted amide II′ band diverged into two modes centered at 1,465 and 1,445 cm−1. The deconvoluted amide I′ band diverged into five modes that could be attributed to β-sheets (1,693 and 1,626 cm−1), α-helices (1,661 cm−1), and other structural elements (1,678 cm−1 and 1,643 cm−1). The νas(COO−) had two components at 1,598 and 1,540 cm−1 in the absence of Ca2+. The νs(COO−) was centered at 1,405 cm−1. The νs(COO−) signal was more intense than the νas(COO−) signal, suggesting that forisomes adsorbed on the gold surface are packed in an orderly manner. In the presence of Ca2+, new bands at 1,736 and 1,706 cm−1 arose from nondissociated side chains of aspartic and glutamic acid residues27, 33 or denatured proteins.34 Furthermore, the 1,598 cm−1 νas(COO−) component upshifted to 1,610 cm−1 whereas the 1,540 cm−1 signal decreased in intensity. The signal for the νs(COO−) mode split into two distinct modes (1,425 and 1,380 cm−1). These combined changes in the ν(C═O), νas(COO−), and νs(COO−) modes suggested the monodentate and bidentate coordination of Ca2+ by the side chains of aspartic and glutamic acid residues, as observed for the MtSEO-F1 dimer film.30
In terms of secondary structural changes induced by Ca2+ association, the overall intensity of the amide I′ and amide II′ modes increased, most likely due to rearrangements within the protein film (Figure 5b). Despite this increase in band intensities, only minor changes were observed in the secondary structure composition (Figure 5c). The content of α-helices increased from 35% to 40% and the proportion of β-sheets decreased slightly from 18% to 15%. It is challenging to compare these values directly with the adsorbed MtSEO-F1 dimers because the PM IRRAS results strongly depend on the orientation of the protein relative to the substrate surface according to the IRRAS surface selection rule.32
Given the available evidence, the association of Ca2+ with MtSEO-F1 forisome bodies does not appear to influence the secondary structure of the proteins radically. Accordingly, the contraction triggered by Ca2+ may explain the increase in absorbance. Furthermore, PM IRRAS clearly revealed that negatively charged amino acids facilitate the association between forisomes and Ca2+. Indeed, the mutation of two aspartate residues in the MtSEO-F1 sequence was recently shown to diminish the Ca2+ response of artificial forisomes.15 However, given the presence of 93 negatively charged amino acids in the MtSEO-F1 protein (14% of the primary sequence) together with the lack of a significant mode indicating the binding of Ca2+ in the PM IRRA spectra, it seems likely that additional, yet unidentified, negatively charged amino acids contribute to Ca2+ association.
PM IRRAS detected structural changes in both types of MtSEO-F1 aggregates. However, Ca2+ association caused different re-folding events in the MtSEO-F1 dimer aggregates and forisomes. The hydration of dehydrated protein areas and α-helices was detected in the dimer aggregates but not the forisomes, suggesting that helical structures are hydrated in forisome bodies. The influx of water into forisome bodies as a consequence of forisome contraction triggered by Ca2+ is well documented10 but water probably fills the space between forisome body substructures such as fibrils and is therefore barely detectable by PM IRRAS.35 Films of MtSEO-F1 dimer aggregates therefore offer more insight into cation-related refolding events than forisome bodies. Nevertheless, we confirmed that Ca2+ association occurs only when MtSEO-F1 proteins form larger aggregates, and not in their soluble state. The interaction between forisome proteins and Ca2+ was previously attributed to larger patches of negatively charged carboxylate groups that allow several protein monomers to form one platform for Ca2+ association.3 Our data support this hypothesis and confirm that aggregation is required to develop responsive smart polymers based on forisome proteins.
3 CONCLUSIONS
Forisomes are polyprotein complexes that can associate with Ca2+ to trigger a global anisotropic structural change. However, a Ca2+-binding site has yet to be identified empirically or in silico in forisome-forming proteins such as MtSEO-F1. To gain insight into the interaction, we investigated the ability of Ca2+ to associate with MtSEO-F1 at three different stages of protein aggregation: soluble dimers, aggregates, and fully-assembled forisome bodies. We developed a procedure for the heterologous production and efficient purification of soluble MtSEO-F1 protein using the SUMO protein tag. Subsequent MALS analysis revealed that soluble MtSEO-F1 proteins mostly form homodimers as well as a small quantity of larger aggregates in solution. CD spectroscopy and MST revealed no evidence that soluble MtSEO-F1 associates with or binds Ca2+ over a broad range of concentrations. In contrast, PM IRRAS revealed that MtSEO-F1 aggregates adsorbed on a gold surface showed overt structural changes in the presence of Ca2+, such as the hydration of helices, thus providing evidence of Ca2+ association. PM IRRAS also showed that Ca2+ influences the behavior of carboxylate groups on amino acid side chains in the fully assembled forisome. We therefore conclude that Ca2+ association sites are established at the interfaces of protein aggregates or forisome substructures such as filaments. These sites probably gain the necessary charge density and orientation of negatively charged amino acids such as aspartic and glutamic acid, allowing the association of forisome bodies with Ca2+.
4 MATERIALS AND METHODS
4.1 Vector construction
The MtSEO-F1 coding sequence was amplified using forward primer 5′-ATG TCA TTG TCC AAT GGA ACT AAA C-3′ and reverse primer 5′-TCA TAT CTT GCC ATT CTG TGG-3′, with vector pENTR4-MtSEO-F1 as the template.8 The product was polyadenylated and inserted into the Champion pET SUMO vector using the TA cloning kit (Thermo Fisher Scientific, Waltham, MA). The resulting plasmid was used as a template to amplify the SUMO-MtSEO-F1 coding sequence and simultaneously add an N-terminal StrepII tag using forward primer 5′-AGA CAT ATG TGG AGC CAT CCG CAG TTT GAA AAA GGC AGC AGC CAT CAT CAT C-3′ (tag underlined) and reverse primer 5′-TGC TCA ACA CAT GAG CGA AAC C-3′. Next, the product was transferred to the TOPO vector (Thermo Fisher Scientific) and cleaved with NdeI to release the StrepII-SUMO-MtSEO-F1 sequence, which was ligated into the Champion pET SUMO vector (linearized with the same enzyme). The integrity of the construct was verified by sequencing.
4.2 Soluble MtSEO-F1 production and purification
MtSEO-F1 was expressed in Escherichia coli Tuner (DE3) cells (Merck, Darmstadt, Germany). The cells were grown at 30°C for 16 h, shaking at 160 rpm. Protein production was induced at OD600 = 0.2–0.4 by adding 0.025 mM isopropyl-β-d-1-thiogalactopyranoside (IPTG). Harvested cells were lysed by incubation with DNase I and lysozyme for at least 30 min followed by sonication. The soluble cell extract was recovered by ultracentrifugation (20,000g, 4°C, 40 min) and the Strep II-SUMO-MtSEO-F1 product was captured on a Strep-Tactin Superflow high-capacity cartridge with a bed volume of 1 ml (IBA Lifesciences, Göttingen, Germany). The SUMO tag was removed using SUMO protease (Thermo Fisher Scientific) at 30°C, and the MtSEO-F1 protein was separated from the SUMO tag by size-exclusion centrifugation using 50-kDa Amicon Ultra centrifugation filters according to the manufacturer's instructions (Merck).
4.3 Characterization of soluble MtSEO-F1
The concentration of purified soluble MtSEO-F1 protein was determined by Bradford assay36 using Coomassie Plus—The Better Bradford Assay reagent (Thermo Fisher Scientific). We then fractionated 1 μg of protein by SDS-PAGE on a 10% resolving gel as previously described.8 For immunodetection, the protein was blotted onto a nitrocellulose membrane4 and detected using an MtSEO-F1-specific antibody.37
MALS was carried out at 4°C on a miniDAWN light-scattering detector (Wyatt Technology, Santa Barbara, CA) coupled to a Shodex RI detector online. Protein samples (20-μl aliquots, 8.2 mg/ml) were loaded onto a Superdex S200 10/30 column (Thermo Fisher Scientific) equilibrated with 20 mM Tris (pH 8.0), 100 mM NaCl and 5% glycerol. Light scattering data were analyzed using the ASTRA software package (Wyatt Technology).
4.4 Expression, purification, and functional analysis of MtSEO-F1-based forisomes
MtSEO-F1 forisomes were produced in yeast using vector pAG425GPD-MtSEO-F18 and were purified as previously described for forizymes.9 The response of the yeast-derived artificial forisomes to Ca2+ was tested as set out in our earlier study.8 Plant-derived MtSEO-F1 forisomes were isolated from tobacco leaf cells under nonreducing conditions, and the response to Ca2+ was tested as previously described.28
4.5 CD spectroscopy
CD spectra (200–260 nm) were recorded at 20°C and at a scanning speed of 50 nm/min on a J-1500 CD spectrophotometer (Jasco, Tokyo, Japan) fitted with a quartz cell (0.1 cm path length). The protein concentration was 1 mg/ml in 5 mM 3-(morpholin-4-yl)propane-1-sulfonic acid (MOPS; pH 7.6), 25 mM KCl. For measurements with Ca2+, equal volumes of the protein buffer solution and the same buffer supplemented with 0.5 mM CaCl2 were mixed, resulting in a protein concentration of 0.5 mg/ml. Each spectrum was the average of five successive scans. The graphs were smoothed using the integrated function of Spectra Manager II software (Jasco). Secondary structure was predicted using the JWMVS-529 multivariate SSE analysis program (Jasco).
4.6 Microscale thermophoresis
Purified MtSEO-F1 protein was labeled with the red fluorescent dye NT-647-NHS using the MO-L001 Monolith Protein Labeling Kit RED-NHS (NanoTemper Technologies, Munich, Germany). The labeled protein solution was supplemented with 0.05% Tween-20 and diluted to a concentration of 182.5 nM by mixing with an equal volume of buffers containing different concentrations of free Ca2+ (0, 27.9, 34.9, 43.2, 52.5, 62.6, 131.2, 253.3, 377.3, and 501.0 μM) in 30 mM MOPS (pH 7.2), 100 mM KCl and 10 mM EGTA. To achieve precise concentrations of free Ca2+ in the micromolar range, we used solutions from the Calcium Calibration Buffer Kit #1 (Thermo Fisher Scientific). The MtSEO-F1/Ca2+ mixtures were loaded into standard treated glass capillaries (NanoTemper Technologies) for measurement at 20°C, 20% LED intensity, and 20% laser intensity using a Monolith NT.115 (NanoTemper Technologies).
4.7 PM IRRAS
Purified MtSEO-F1 protein (10 μg/ml) and yeast-derived MtSEO-F1 forisomes (20 μg/ml) were adsorbed onto a gold surface for 60 min in D2O electrolyte solution one (0.1 M NaCl, 0.05 M NaHSO3, 10 μM CoCl2; pD 5.6). The protein film was rinsed with electrolyte solution one for 60 min to remove weakly-adsorbed molecules, and then immersed in D2O electrolyte solution two (0.05 M NaHSO3, 10 μM CoCl2, pD 5.4) to remove electrolyte ions from the forisome film and prevent protein denaturation. To test the influence of Ca2+, the film was immersed for 10 min in D2O solution two supplemented with 0.01 M CaCl2 before PM IRRAS. PM IRRA spectra were recorded using a VERTEX 70v spectrometer with a PMA 50 polarization modulation set (Bruker, Ettlingen, Germany) containing a photoelastic modulator (PEM) and demodulator (Hinds Instruments, Hillsboro, OR). The maximum PEM efficiency was set to half-wave retardation at 1,600 cm−1 to analyze amide I and amide II bands. The angle of incident infrared light was set to 80°. All spectra were recorded in a dry air atmosphere with a resolution of 4 cm−1, and each spectrum was an average of 800 scans. Two independent experiments were carried out for the adsorbed MtSEO-F1 dimers and complete forisomes. Background-corrected PM IRRA spectra were prepared using OPUS v5.5 (Bruker). The deconvolution procedure was based on the positions of the minima of second derivatives of the PM IRRA spectra and FSD results, the latter applied to Lorentz-shaped curves with the full width at half maximum set to 16 cm−1. We determined the number of IR absorption modes and the positions of their absorption maxima. During the deconvolution procedure, the wavenumbers of the absorption maxima were fixed and the peak shape was fitted with a Gauss curve.
ACKNOWLEDGMENTS
This research was partially funded by a grant of the State of North Rhine-Westphalia (FKZ W 044 A), GER. The MALS experiment at the Netherlands Cancer Institute, Amsterdam, Netherlands, was supported by Infrastructure for NMR, EM and X-rays for Translational Research (iNEXT) project number 3733, funded by the Horizon 2020 Program of the European Union. Izabella Brand acknowledges support from DAAD project number 57449009 and Judith Rose acknowledges Grant NAWA PPN/BIL/2018/1/00103 for supporting the studies of protein adsorption and conformation. Open access funding enabled and organized by Projekt DEAL.
CONFLICT OF INTEREST
The authors declare no conflict of interests.
AUTHOR CONTRIBUTIONS
Judith Rose: Conceptualization (equal); funding acquisition (equal); investigation (equal); validation (equal); visualization (lead); writing – original draft (lead). Izabella Brand: Investigation (equal); methodology (lead); validation (equal); writing – original draft (supporting). Merle Bilstein-Schloemer: Investigation (equal); validation (equal). Barbara Jachimska: Investigation (equal); validation (equal). Richard Twyman: Writing – review and editing (lead). Dirk Prüfer: Funding acquisition (equal); supervision (equal); writing – review and editing (equal). Gundula Noll: Conceptualization (equal); project administration (equal); writing – review and editing (equal).


