A comparative study of data-dependent acquisition and data-independent acquisition in proteomics analysis of clinical lung cancer tissues constrained by blood contamination
Abstract
Proteomics analysis is often troubled by high-abundance proteins in samples such as plasma. However, many surgical tissue samples inevitably have got contaminated with blood before cryopreservation. Selection of an appropriate method to minimize the effect of high-abundance proteins is important for proteomics analysis of blood contaminated tissues. Here, we investigated and compared the abilities of data-independent acquisition (DIA) and data-dependent acquisition (DDA) strategies for the proteomics analysis of blood contaminated clinical tissue samples. Twelve pairs of carcinoma and para-carcinoma tissue samples from lung cancer patients were used for proteomics assays separately by DIA and DDA, and the blood contamination level in samples was evaluated by contamination index (CI). Compared with the DDA strategy, DIA in whole exhibited much better analytical capabilities in proteomics analysis of these samples with more identified protein groups and a higher discovery of differential proteins. With CI value increasing, whether DIA or DDA showed decreasing analysis ability. However, for samples with high CI values, the DIA strategy still shows acceptable analytical capability and indicates better blood pollution resistance than the DDA strategy. Our results implied that for clinical tissue samples, particularly for those contaminated with blood, DIA strategy should be a preferred method in proteomics studies.
Abbreviations
-
- AGC
-
- automatic gain control
-
- BP
-
- biological process
-
- CC
-
- cellular component
-
- CI
-
- contamination Index
-
- CV
-
- coefficient of variation
-
- DDA
-
- data-dependent acquisition
-
- DIA
-
- data-independent acquisition
-
- FDR
-
- false discovery rate
-
- GO
-
- gene ontology
-
- HCD
-
- higher-energy collision dissociation
-
- LC-MS/MS
-
- liquid chromatography coupled to tandem mass spectrometry
-
- MF
-
- molecular function
-
- PCA
-
- principal component analysis
-
- SDS-PAGE
-
- sodium dodecyl sulfate-polyacrylamide gel electrophoresis
1 INTRODUCTION
Proteomics has been used extensively in life mechanism studies, drug target and clinical disease diagnosis, and treatment research [1-3]. Proteomics technology can quickly screen various proteins at different stages of the disease. Proteins with diagnostic value could be effective biomarkers for the early diagnosis of tumors [4, 5]. Proteomics research requires accurate, stable, and high-throughput qualitative and quantitative analysis of proteins [6]. The considerable complexity of biological samples, such as clinical tissue samples, is challenging for the accuracy, repeatability, and depth of proteomics analyses.
Data-dependent acquisition (DDA) is a traditional mass spectrometry (MS) method for multiplexed experiments (e.g., tandem mass tag [TMT] based experiments) and label-free quantitative proteomics researches. However, for label-free methods, DDA usually leads to the considerable loss of quantitative information of proteins due to its acquisition mode [6], especially when a sample contains highly abundant proteins (e.g., plasma or serum), which decreases the discovery coverage, accuracy, and repeatability of proteomics analysis [7-9]. Unfortunately, in many clinical research projects, many surgical tissue samples inevitably have got contaminated with blood before cryopreservation. This might detrimentally affect the results obtained using the DDA strategy.
Technological developments have included a relatively newer method called data-independent acquisition (DIA) MS in large-scale proteomics studies. DIA-MS allows all ions within a selected mass range to be concurrently fragmented and analyzed by tandem MS [10]. The use of DIA-MS in proteomics studies has increased significantly over the past 5 years [11]. The DIA-MS method also acquires a complete and permanent digital fragment ion record for all detectable precursor ions of a sample. The DIA approach has recently been considered as a novel MS method that promises to combine the high content aspect of the DDA method with the reproducibility and precision of selected reaction monitoring (SRM) [12].
In this study, we investigated two strategies based separately on DDA and DIA for the proteomics analysis of lung cancer surgery samples featuring various extents of blood contamination. Compared with DDA, DIA had significant advantages in proteomics analysis of these samples although high-abundance protein contamination had a considerable impact on both analysis strategies.
2 METHODS
2.1 Sample collection and preparation
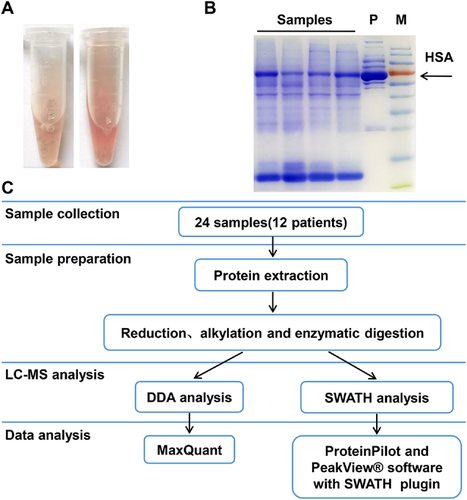
Twelve pairs of carcinoma and para-carcinoma tissues (24 samples in total) separately from 12 lung cancer patients were collected from the Department of Thoracic Surgery, The Second Affiliated Hospital of Nanchang University, Nanchang, China. All tissue samples were collected within 1 h of their removal during pneumonectomy, quenched in liquid nitrogen, and then stored at −80°C until processing. Notably, the carcinoma tissues were carefully dissected to remove obvious adjacent lung tissue after their surgery remove and confirmed by later pathological analysis. The study outline, sample preparation, and analysis were schematically presented in Figure 1C. This study was performed in agreement with the Helsinki declaration and approved by the ethics committee of the Second Affiliated Hospital of Nanchang University, Nanchang, China. The detailed information of patients was offered in Supplemental Table S1.
2.2 Reagents and materials
Sodium dodecyl sulfate (SDS), Trizma base, dithiothreitol (DTT), iodoacetamide (IAM), ammonium bicarbonate, guanidine hydrochloride, and L-tryptophan were purchased from Sigma–Aldrich (St. Louis, MO). cOmplete protease inhibitor cocktail tablets were purchased from Roche Diagnostics (Sandhofer Strasse, Mannheim, Germany). Sequencing grade trypsin was obtained from Promega (Madison, WI). Ammonium hydroxide, acetonitrile (ACN, liquid chromatography LC-MS grade), methanol (MeOH, LC-MS grade), and formic acid (FA) were purchased from Thermo Fisher Scientific (Waltham, MA). All water used in the experiments was purified using a Milli-Q system (Millipore, Bedford, MA). All other chemicals and reagents of the best available grade were purchased from Sigma–Aldrich or Thermo Fisher Scientific.
2.3 Protein extraction and enzymatic digestion
All samples were washed three times with pre-cold phosphate-buffered saline (PBS) at 4℃, and the surface liquid was removed by a clean filter paper before subsequent processing. For each sample extraction, approximately 100 mg of tissue was homogenized in 800 μL of lysis buffer containing 2% SDS, 100 mM DTT, 100 mM Tris/HCl pH 7.4, and 1× protease cocktail inhibitor. The samples were further lysed by sonication (SCIENTZ-IID, Ningbo Scientz Biotechnology Co., Ltd., Ningbo, China) for 1 min on ice (pulse on 5 s, pulse off 5 s at the output power of 60 W, frequency of 20 ± 0.5 kHz). After centrifugation at 14,000×g for 10 min at 4°C, the supernatant was collected, and the protein concentration was determined by tryptophan fluorescence emission at 365 nm using an excitation wavelength of 285 nm [13]. Proteins (150 μg) from each sample were precipitated with cold acetone for 3 h at −20°C. Precipitated proteins were centrifuged, the liquid layer was removed from the tubes, and samples were allowed to dry for 5 min. Protein precipitation was solubilized in 7 M guanidine hydrochloride and then reduced and alkylated by incubation with 45 mM DTT at 37°C for 30 min and 106 mM IAM at 25°C for 30 min in the dark. After reductive alkylation, samples were transferred into a Vivacon 500 30 kDa MWCO centrifugal device (Sartorius, Göttingen, Germany). Samples were washed with an additional 100 μL 8 M urea solution twice and 100 μL 50 mM ammonium bicarbonate twice sequentially. Digestion was first performed with trypsin (trypsin-to-protein ratio of 1:50) for 16 h at 37°C. After digestion, the peptides were dried in a vacuum and stored at −80°C until use.
2.4 Analysis using DDA
DDA analysis was performed on an Orbitrap Fusion Lumos mass spectrometer (Thermo Fisher Scientific) coupled to an EASY-nL 1200 and nanospray ion source. The LC gradient was composed of buffer A (0.1% FA in ultrapure water) and buffer B (80% acetonitrile and 0.1% FA in ultrapure water). Peptides (500 ng) were separated on a 25 cm 75-μm-inner-diameter analytical column packed in-house with ReproSil-Pur C18-AQ 3 μm resin (Dr. Maisch GmbH, Ammerbuch, Germany). Peptides were separated with a 78 min 5-step gradient (0−8 min, 5−8% B; 8−58 min, 8−22% B; 58−70 min, 22−32% B; 70−71 min, 32−90% B; and 71−78 min, 90% B) at a flow rate of 300 nL/min.
Each sample was acquired with an automatic switch between a full MS scan and data-dependent MS/MS scans in a 3-s cycle time. The AGC target value for the full MS scan was 4 × 10⁵ over the mass range of 300–1200 m/z with a 50 ms maximum injection time and a resolution of 60,000. Only the peptide ions with charge states of 2−7 were selected for fragmentation. The isolation window of precursors was 1.6 m/z. Precursor ions were fragmented using HCD mode with a normalized collision energy (CE) of 30%. MS/MS scans were acquired in rapid ion trap scan mode in the ion trap with an AGC target value of 1 × 10⁴ and a 30 ms maximum injection time. The first mass was fixed at 120 m/z. In addition, the dynamic exclusion duration was set for 30 s.
2.5 Analysis using DIA
Sequential window acquisition of all theoretical mass spectra (SWATH-MS) analysis, a typical DIA method on the high-resolution mass spectra system of AB/Sciex, was performed on a TripleTOF5600 tandem quadrupole time-of-flight mass spectrometer (AB/Sciex, Framingham, MA) coupled to a Turbo V Ion Source (AB/Sciex) and a NanoLC 415 micro-HPLC (Eksigent, Framingham, MA). The LC gradient was composed of buffer A (2% acetonitrile and 0.1% FA in ultrapure water) and buffer B (98% acetonitrile and 0.1% FA in ultrapure water). The peptides were first trapped on a ChromXP c18 pre-column (5 μm particle size, 120 Å, 75 μm i.d. ×5 mm) to remove impurities and salt at a flow rate of 6 μL/min for 6 min in 100% buffer A. Peptides were then eluted into the ChromXP c18 analytical column (3 μm particle size, 120 Å, 75 μm i.d. ×15 cm) and separated with a 70 min 7-step gradient (0−0.5 min, 5% B; 0.5−45 min, 5−25% B; 45−55 min, 25−35% B; 55−60 min, 35−55% B; 60−60.5 min, 55–80% B; 60.5−65 min, 80% B; 65−65.5 min, 80−85% B; and 65.5−70 min, 5% B) at a flow rate of 5 μL/min.
For TOF5600 dependent acquisition (IDA, Sciex-specific abbreviations for DDA method), the key ion source parameters were: ion source gas 1 (GS1) 17, ion source gas 2 (GS2) 13, curtain gas (CUR) 30, temperature (TEM) 330°C, ion spray voltage floating (ISVF) 5500 V, and declustering potential (DP) 100 V. Data acquisition of the IDA experiments was set in a high-resolution TOF-MS scan over a mass range 350−1500 m/z. The 30 most intense precursor ions per cycle were subsequently analyzed by MS/MS scans, operating the instrument in a high-sensitivity mode over a mass range of 100−1500 m/z. The selection criteria for the precursor ions included the intensity, where ions had to be greater than 100 counts per second (cps), with a charge state between 2 and 4. Ions were isolated using a quadrupole isolation width of 1.4 Da. The dynamic exclusion duration was set for 10 s. Collision-induced dissociation was triggered by a rolling CE parameter script to automatically control the CE and collision energy spread (CES) at 5 V. The ion accumulation time was set to 250 ms (MS) and 50 ms (MS/MS). The peptide samples were prepared at 0.5 μg/μL spiked-in with 12.5 fmol/μL peptides from bovine serum albumin (BSA) digested by trypsin and 5 μL of each sample was analyzed.
SWATH-MS data were acquired on the same ion source parameters and using identical LC conditions. The mass spectrometer was operated in looped product ion mode. Full MS scans were acquired in the mass range of 350−1500 m/z in positive ion mode. Using a variable isolation window (Supplementary Table S2), 100 MS/MS acquisition windows with 1 m/z overlap were constructed, covering the mass range of 100−1500 m/z in a high-sensitivity mode. The CE for each window was based on the CE for a 2+ ion centered in the respective window with a CES of 15 V. The maximum filling time for MS scans was 50 ms and for MS/MS scans was 15 ms, resulting in a cycle time of 1.6 s.
2.6 Lung tissue SWATH assay library generation
The library for SWATH analysis was created using the IDA method. The relative quantitation analysis was performed using the SWATH method. To increase the proteome depth for the SWATH ion library, the peptide pool mixed from all samples was separated by high pH reverse phase chromatography before LC-MS/MS analysis. A reverse-phase column (Waters, BEH C18, 4.6 × 250 mm, 3.5 μm) was used at 40°C. A peptide pool sample (350 μg) was loaded on the column and elution was carried out by 2% ACN (20 mM ammonium formate) to 80% ACN (20 mM ammonium formate) in 62 min. Forty-eight fractions were collected and pooled in 12 fractions for later analysis. The fraction peptides were subjected to IDA MS analysis on a TripleTOF 5600. For BSA tryptic digest peptides, a set of peptides for retention time calibration were spiked into these samples at a concentration of 25 fmol/μL to build the SWATH ion library.
2.7 Data processing
Data acquired with the DDA method were analyzed using the MaxQuant computational platform (version 1.6.2.6) against the nonredundant human UniProtKB/Swiss-Prot protein database (March 15, 2019) containing 20,259 protein sequences. Cysteine carbamidomethylation as a fixed modification and N-terminal acetylation and methionine oxidation as variable modifications were required. The false discovery rate (FDR) was set to 0.01 for proteins and peptides (minimum length set to seven amino acids) and was determined by searching against a reverse database from the above human protein database. Enzyme specificity was set as Trypsin/P and a maximum of two missed cleavages was allowed in the database search. Peptide identification was performed with an allowed initial precursor mass deviation up to 7 ppm and an allowed fragment mass deviation up to 0.5 Da. “Match between run algorithm” in MaxQuant was performed [14]. All other settings were set at the default values.
Data acquired using the IDA method were analyzed using ProteinPilot software (AB/Sciex, v. 5.0.1) against the nonredundant human UniProtKB/Swiss-Prot protein database (March 15, 2019) containing 20,259 protein sequences and the peptide sequences of BSA. For Paragon searches, the following parameters were used: sample type: identification; Cys alkylation:IAM; digestion: trypsin; instrument: TripleTOF 5600; special factors: none; species: Homo sapiens; ID focus: biological modifications; search effort: thorough ID; results quality: 0.05 (detected protein threshold), and running FDR analysis.
The data from all the IDA method identification runs using ProteinPilot software were combined as a batch and used for library building. PeakView software 2.2 with the SWATH plugin was used to process the library. BSA peptides were used for retention time calibration in the SWATH plugin. For better SWATH quantification, the following parameters were used: peptide filter: 15 peptides per protein; six transitions per peptide; 95% peptide confidence; 1% FDR threshold; exclusion of modified peptide; XIC options: 8 min XIC extraction window; and 50 ppm XIC width. The missing value was automatically imputed by PeakView software 2.2 with the SWATH plugin in the result.
Subsequent data analysis was performed using R statistical software version 3.6.0 (R Core Team, Foundation for Statistical Computing, Vienna, Austria; https://www.R-project.org/). The median normalization strategy was used in data analysis. Analysis of Student's t-test with p-values < 0.05 after Benjamini–Hochberg correction was used for the screening of significantly changed proteins.
3 RESULTS
3.1 Sample preparation and experiment design
Many clinical tissue samples obtained through surgery were contaminated by different levels of blood (Figure 1A). An SDS-PAGE was performed to investigate the abundance of proteins in these tissue samples, and the result showed that all the samples still contained a high content of human serum albumin (HSA), the most abundant protein in the blood (Figure 1B), even washed three times with PBS before protein extraction. To find a more suitable analysis method for this kind of tissue sample, we used two strategies separately based on DDA using a Thermo Fisher Fusion Lumos mass spectrometer system and DIA using an AB Sciex TOF5600 mass spectrometer system for the proteomics analysis of the same samples from 12 pairs of cancer and adjacent tissues (Figure 1C).
3.2 Identification of protein groups
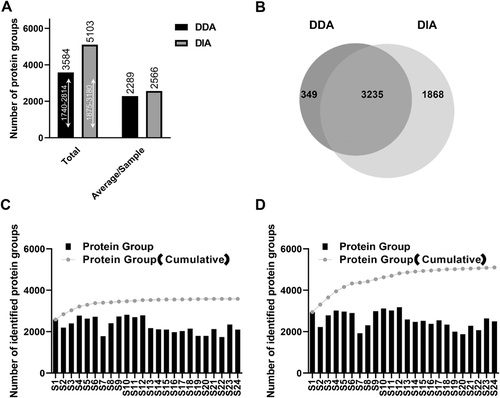
A total of 3584 (range 1740–2814 in a single sample) protein groups were identified using the DDA acquisition method using an FDR of 1% in a total of 28,479 different unique peptides from 24 samples. The sum of the number of unique peptides identified from every raw data set was 226,116, and the number of identified spectra were 360,346. The ratio of the total number of unique peptides to the identified spectra was 62.74%. An average of 2289 protein groups were identified in every sample by the DDA method (Figure 2A and C). In the DIA strategy, a total of 155,429 distinct peptides were initially identified from the peptide pool, corresponding to 832,231 identified MS/MS spectra in an assembly of 8466 protein groups to build the DIA library. Using this library, 5103 protein groups were identified in the total sample (range 1875–3180 in a single sample). An average of 2566 protein groups were identified in every sample by the DIA method (Figure 2A and D). For all samples, the total amount of protein groups identified by the DIA method was 42% higher than that by the DDA method (5103 vs. 3584, Figure 2A). For each sample, the average amount of protein groups identified by the DIA method was 12% higher than that by the DDA method (2566 vs. 2289, Figure 2A). In these two analysis strategies, for all samples, 3235 protein groups were identified using both methods. Five times as many unique protein groups were identified by the DIA method as those identified by the DDA method (1868 vs. 349, Figure 2B).
3.3 Data stability assessment
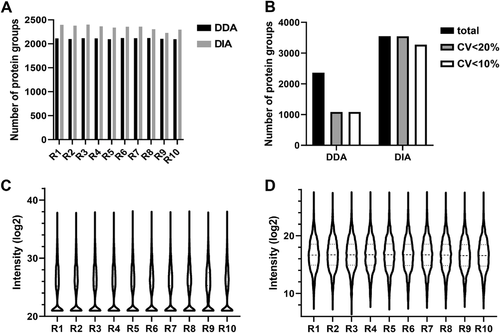
To evaluate the data stability of DDA and DIA, we analyzed ten replicate injections of a pair of carcinoma and para-carcinoma pooled sample by the DDA and DIA method, respectively. Both DDA and DIA exhibited stability in the amount of identified proteins during ten replications, as shown in Figure 3A. However, in a total of 2360 identified protein groups by DDA, only 45.97% of proteins (1085/2360) were quantified with a coefficient of variation (CV) < 20%. By the DIA method, 3553 protein groups were identified and almost all these proteins (3549/3553, 99.88%) were quantified with CV < 20% in the 10 repeated injections (Figure 3B). Then we compared the distribution of quantitative values of proteins across each technical replicate, and violin plots of the frequency of signal intensities in two-dimensional distribution histograms were made. In the DDA method, >30% of the protein quantification values were missing in each technical replicate (Figure 3C). In the DIA method, the SWATH algorithm outputted quantification values of all identified proteins in each technical replicate (Figure 3D), which greatly improved the stability of the acquired data.
3.4 Summary of differential proteins in lung cancer clinical tissues
Next, we compared the differential proteins identified by DIA and DDA methods. We screened out 1065 proteins and 389 proteins separately using the DIA and DDA methods with a paired t-test, which showed significant differential abundance between 12 paired carcinoma tissues and para-carcinoma tissues (Figure 4A). Of these proteins, shown in Figure 4B, 281 proteins were quantified by both analysis methods. Compared to para-carcinoma tissues, 553 proteins lower in carcinoma and 512 proteins higher in carcinoma were selected out using the DIA method, and only 192 proteins lower in carcinoma and 197 proteins higher in carcinoma were screened out by the DDA method. Among the proteins lower in carcinoma, 178 proteins were quantified by both analysis methods, which accounted for approximately 93% of those quantified by DDA but only approximately 32% of those quantified by DIA. A total of 103 proteins higher in carcinoma were quantified by both methods. These accounted for approximately 52% of those quantified by DDA but only approximately 20% of those quantified by DIA. To verify the distinguishing effect of differential proteins respectively screened out by DDA and DIA methods on carcinoma and para-carcinoma samples, principal component analyses (PCAs) were carried out, and the results showed that both PCA models could clearly separate the carcinoma group and para-carcinoma group with a similar trend (Figure 4C).
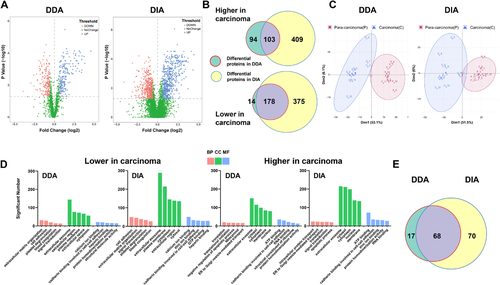
We next assessed how these significantly changed proteins correlated with the Gene Ontology (GO) terms. A subset of approximately 75% top 15 GO pathways overlapped between the DDA and DIA methods, showing a similar trend with an adjusted p-value ≤0.05. The number of proteins enriched by each pathway by the DIA method was much greater than those enriched by the DDA method (Figure 4D).
Furthermore, to investigate the association between the significantly changed proteins and lung cancer disease, we used IPA software (IPA, QIAGEN, Redwood City, CA) to analyze the differential proteins from the DDA and DIA strategies, respectively [15]. Sixty-eight differential proteins in lung cancer were identified using both methods. Seventeen and 70 unique lung cancer differential proteins were identified by the DDA and DIA method, respectively (Figure 4E).
3.5 The effects of blood contamination on proteomics analysis
In this study, the contamination index (CI) was defined as the ratio of the sum of label-free quantification (LFQ in maxquant result) intensity of hemoglobin subunit beta, hemoglobin subunit alpha, and serum albumin to the sum of LFQ intensity of all identified proteins in each sample and was used to reflect the degree of blood contamination. As shown in Figure 5A, different degrees of blood contamination in tissues were exhibited through CI (16.6–70.1% in carcinoma tissues and 33.4–65.6% para-carcinoma tissues). In both the DDA and DIA results, a significant negative correlation was observed between the number of identified proteins and the CI value in both carcinoma tissues and para-carcinoma tissues, which reflected that blood contamination can seriously reduce the number of identified proteins.
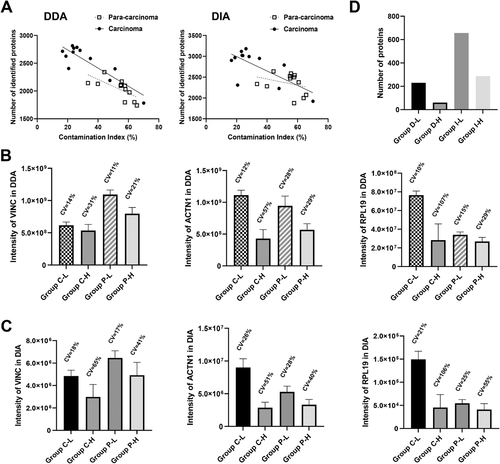
To further study the influence of blood contamination on these two proteomics analysis strategies, valid protein signal intensity and stability were evaluated. We chose three carcinoma tissues and three para-carcinoma tissues with the highest CI as the high-contaminated group and three carcinoma tissues and three para-carcinoma tissues with the lowest CI as the low-contaminated group. Three housekeeping proteins with different orders of magnitude in intensity, VINC, ACTN1, and RPL19, were analyzed. Whether in DDA result or in DIA result, compared to the low-contaminated group, the intensity of VINC, ACTN1, and RPL19 in the high-contaminated group decreased significantly (Figure 5B and C). Meanwhile, increasing CV values of these housekeeping proteins also implied worse stability on quantification in the high-contaminated group. In addition, blood contamination significantly reduced the discovery rate of differential proteins between carcinoma and para-carcinoma tissues in both the DIA strategy and the DDA strategy (Figure 5D). In DIA data, compared with the low-contamination group, the number of differential proteins in the high-contamination group was reduced by 56% (from 656 to 287), while in DDA data, a much more poorer result was observed and the number of differential proteins in the high-contamination group was reduced by approximately 74% (from 230 to 60).
4 DISCUSSION
High-abundance proteins in samples are a serious obstacle in proteomics analysis, and a typical example is the severe impact of high-abundance plasma proteins such as albumin and globulin on the analysis of plasma proteomics. In clinical research, for many reasons, such as tissue oozing during surgery and excised tissue not being washed with PBS or physiological saline as soon as possible or not being washed at all, clinical tissue samples are often contaminated with various levels of blood before being frozen storage. These contaminants are very difficult to remove in later treatments. As to simple plasma or serum samples, although the content of high-abundance proteins is large, the proportion of these proteins is almost the same in different samples. While for clinical tissue samples, due to different levels of blood contamination, the complexity of samples may be greater which might make the related proteomics analysis more difficult. However, the effect of blood contamination on proteomics detection for tissue samples has rarely been studied.
At present, both DDA and DIA are commonly used in label-free quantitative proteomics assays. Good flexibility, wide detection range, and simple data analysis make DDA the preferred LC-MS/MS method in detecting relative proteome changes in samples from cells and animal tissues [16], which are usually relatively clean and free of extensive protein contamination [17, 18]. Recently, with the development of mass spectrometer performance, optimization of experimental methods, and the improvement of data algorithms, much progress has been made in DIA-based proteomics approaches which have shown good reproducibility, specificity, and accuracy in proteomics analysis [19-21]. In this study, we compared DDA and DIA strategies in terms of their differential protein discovery performance using clinical lung cancer tissues with different blood contamination. To our knowledge, this contrastive analysis is the first to be reported.
To evaluate the degree of blood contamination, we innovatively introduced the CI and the samples used in this study exhibited a large CI range from 16.6% to 70.1%. With the increase of CI in tissue samples, the results of the two strategies were both certainly affected. In the DIA results, due to a more complete collection of peptide signals and higher data utilization [12, 22], the number of quantitative proteins was more than that in the DDA results. However, because of the decrease of the valid signal, the quantitative stability decreased, which led to a lower discovery rate of differential proteins. While in the DDA strategy, high-abundance proteins seriously affected the quantity of identified proteins and quantitative proteins in each sample and also affected the stability of protein quantification which led to an extreme decrease in the discovery rate of differential proteins. Our data indicated that both contamination level of blood in samples and acquisition strategy of MS significantly affect the final proteomics analysis results and compared to the DDA strategy, the DIA strategy shows the much better analytical capability and blood pollution resistance. In addition, the CI value this study introduced can effectively evaluate the degree of blood contamination and from the relationship between CI and proteomics data, we believe CI would be a useful criterion for sample exclusion in large-scale clinical sample proteomics analysis. Of course, the range of CI values may be different depending on sample types and exclusion criteria based on CI should be made according to the study on specific sample data.
We used different MS instruments for this comparison study and even two LC gradients with a little difference. However, we should also note that many researches have reported the Orbitrap Fusion Lumos instrument has a stronger ability for proteomics analysis than the TripleTOF5600 instrument under the same acquisition strategy (e.g., DDA) [23, 24]. Meanwhile, as for LC condition, in order to ensure the vast majority of peptides to be evenly eluted during a designed period, we optimized elution gradients separately on nano-LC (with Fusion Lumos) and micro-LC (with Triple TOF5600). As known, nano-LC is the most common tool used in proteomics to separate peptides to MS because of its enhanced sensitivity, which is believed to identify more proteins compared with other LC systems [25]. However, lower rates of efficiency and repeatability, higher failure rates, and more difficult maintenance have limited the application of nano-LC systems in large-scale clinical researches. The micro-flow LC system might balance the pros and cons between the nano-LC system and the normal UPLC system [26]. Based on its greater reliability compared to nano-LC, micro-flow LC might have better application prospects in clinical proteomics researches. Our results indicated that for the samples contaminated by blood, the DIA strategy can effectively improve the analytical capability of the TripleTOF5600 MS coupled with micro LC instruments, even resulting in significantly better analytical results than those outputted from Orbitrap Fusion Lumos MS coupled with nano-LC instruments using the DDA strategy. This result can further prove the superiority of the DIA strategy to the DDA strategy in the analysis of specific samples.
For disease research, each clinical sample is precious and sample collection usually takes months or years. Removal of unqualified samples before the experiment is necessary but regrettable. The present findings demonstrate that for clinical tissue samples, compared with the DDA strategy, DIA analysis may be slightly time-consuming mainly because of the construction of a special spectrum library for sample analysis and may require more sample sizes [20]. However, the data derived using DIA is more complete, and more differential proteins can be identified. DIA strategies can effectively overcome the interference from blood contaminants, allowing greater utilization of existing frozen samples, which shows excellent analytical capability and application prospects. In addition, for the proteomics analysis of clinical samples, it is suggested that tissue samples should be rinsed to remove the blood immediately before cryopreservation to minimize the impact of blood on protein identification and quantification. Of course, for different experimental purposes, such as metabolomics or post-translational modification, different treatment methods should be considered.
ACKNOWLEDGMENTS
This work was supported by the Sichuan Science and Technology Program (No. 2021YFH0061), 1.3.5 project for disciplines of excellence, West China Hospital, Sichuan University (ZYGD18014).
AUTHOR CONTRIBUTIONS
The manuscript was written through the contributions of all authors. All authors have approved the final version of the manuscript.
CONFLICT OF INTEREST
The authors have declared no conflicts of interest.
Open Research
DATA AVAILABILITY STATEMENT
The mass spectrometry proteomics data have been deposited to the ProteomeXchange Consortium (http://proteomecentral.proteomexchange.org) via the iProX partner repository [27] with the dataset identifier PXD025905.


