Genetic variation in hydrogen cyanide potential of perennial sorghum evaluated by colorimetry
Abstract
Both annual and perennial sorghum biomass serve as important forage for ruminant animals around the world. Unfortunately, sorghum can produce hydrogen cyanide (HCN), which, if occurring in high enough concentrations, can be toxic or lethal to animals that consume it. The objectives of this study were to develop a fast and inexpensive colorimetric assay to measure the hydrogen cyanide potential (HCN-P) as well as to compare this with existing visual assays while assessing the range of variation for HCN-P among perennial and annual sorghum biomass. The HCN-P of 100 sorghum lines derived from an interspecific hybridization program was determined over 2 years (establishment and regrowth) using both visual and colorimetric assays. Visual assessment underestimated the HCN-P and was less accurate than colorimetry. Repeatability for HCN-P across all sampling dates was functionally zero in the visual assessment and low for the colorimetric assay. This was mostly explained by the significant pedigree × year interaction effects and growth stage. Growth stage substantially influenced HCN-P, which should be considered when feeding animals on fresh forage.
1 INTRODUCTION
Several sorghum species are used as forage in animal production systems worldwide. Specific cultivars and hybrids of Sorghum bicolor are planted annually for grazing and baling. Among the perennial sorghum species, Sorghum halepense (Johnson grass) was originally introduced to the United States as a forage species (McWhorter, 1971) and two other perennial sorghum species (Sorghum propinquum and Sorghum almum) have potential as a perennial forage (De Wet, 1978; Doggett, 1976; Pritchard, 1965).
Perennial sorghums are characterized by a deep rooting system with rhizomes for temporal storage of carbohydrates, which is used as an energy source for plant regeneration (Cox et al., 2018). Rhizomes are reported as the primary factor associated with overwintering in perennial sorghum and able to reduce costs associated with annual crop establishment (Sanderson & Adler, 2008). The perennial rooting system combined with the clumping nature of growth can reduce soil erosion and subsequently increase soil organic carbon (Nabukalu & Cox, 2016), but it is also noteworthy that rhizomes are a contributing factor to the aggressive behavior of perennial sorghum. As such, Johnsongrass (S. halepense) has colonized large land masses and become one of the 10 worst weeds of field crops (Alex et al., 1979). However, progenies of annual × perennial crosses have been reported to have less than 10% rhizome mass, sufficient for overwintering, but not enough to become aggressive weeds (Piper & Kulakow, 1994).
Most sorghum accessions produce the cyanogenic glucoside dhurrin in the aboveground biomass. When stress occurs (caused by abiotic and/or biotic factors), enzymatic reactions cleave the dhurrin molecule to produce hydrogen cyanide (HCN). This HCN production is thought to have evolved as a defense against insect herbivory (Etuk et al., 2012). Although dhurrin does provide some protection, it can be toxic to ruminants in high concentrations (Krothapalli et al., 2013). Further, some unselected perennial sorghum types accumulate more dhurrin than annual grain and forage types (Rhykerd & Johnson, 2007).
Variation has been found for levels of HCN-P in domesticated S. bicolor and wild S. halepense (Hayes et al., 2016; Nicollier et al., 1983) but has not been investigated for progenies of S. bicolor × S. halepense. To select for lower HCN-P in these materials, cost-effective methods are needed for measurement. Various protocols have been used to estimate HCN-P in crop biomass (Table 1). The Feigl–Anger and picrate paper methods are inexpensive, subjective, and qualitative approaches to rapidly screen large numbers of samples through visual assessment of color intensity associated with increasing HCN concentrations (O'Brien et al., 1994). Biochemical and spectrometric methods provide quantitative measures although they are expensive and time consuming, which makes it difficult to screen large populations (Akazawa et al., 1960; Fox et al., 2012; Reddy et al., 2016). Ultimately, accurate quantitative measures are important for data manipulation and statistical analysis, but price and rapid testing are necessary for high-throughput screening (Punch, 2013; Walter & Andersen, 2013). The objectives of this study were to (1) evaluate if colorimetry could be used to make visual HCN assays more quantitative and repeatable and (2) assess the range of variation for HCN-P among breeding lines of perennial sorghum.
| Type of method | Quantitative | ||
|---|---|---|---|
| Cost of equipment ($) | Time/sample | Species | |
Spectrometry Absorbance spectrophotometer microplate reader and near-infrared spectrometer (Fox et al., 2012) |
>2600 | Microplate reader (37°C for 15 h) | Forage sorghum (Sorghum bicolor) |
| NIR scan (1–2 min) | |||
| Picrate paper with spectrometry (Burns et al., 2012) | >2800 | Absorbance (30°C for <12 h) | Cassava (Manihot esculenta) |
| Biochemical methods (Akazawa et al., 1960) | 900 | 16–24 h | Sorghum vulgare (Sorghum bicolor) |
| Semiquantitative | |||
| Feigl and Anger densitometry (Reddy et al., 2016) | 715 | 1.30 h | Grain sorghum (Sorghum bicolor) |
| Qualitative | |||
| Indicator paper test | |||
| Feigl and Anger test | 425 | 20–35°C for 3–12 h | Cassava |
| Picrate paper test (Buck et al., 1973; O'Brien et al., 1994) | 205 | 20–35°C for 10–12 h | (M. esculenta) |
2 MATERIALS AND METHODS
2.1 Germplasm
This study evaluated 100 sorghum pedigrees (genotypes), primarily comprising 79 BC1F1 progenies of BTx623/Gypsum- an interspecies cross of tetraploid S. bicolor (BTx623) and S. halepense (gypsum). These progenies were selected in Salina, Kansas, for both perenniality and grain productivity using methods described by Nabukalu a Cox (2016). In addition, 14 progenies derived from another interspecific cross between BTx623/S. propinquum (Washburn et al., 2013), pure lines of S. halepense (1) and (2) S. bicolor (1-BTx623 diploid, 1-BTx623 tetraploid line), and four hybrid grain sorghums (RTx436, RTx437, NP32_PI535776, Low-HCN-PRP2B) (Rooney et al., 2003) were also included (Table 2).
| Sorghum bicolor | Sorghum halepense | S. bicolor/S. halepense | S. bicolor/S. propinquum | ||||
|---|---|---|---|---|---|---|---|
| RTx437 | GYPSUM-9 | S1662 > R126B | S2172-5-R506 | S1662 > 153H-R54 | S2126 > R147B | S1776 > R349B | S3199-B1-PR135A |
| RTx436 | S14PR-020C | S1820-1-614 | S1327 > 230B | S1814 > R452B | X1206 > R477 | S3195-A3-PR14 | |
| BTX623(4X) | S1662 > R153G | S2371 > R519-R124 | X814 > R003 | S1852 > 015E | S1776-R331 | S3182-B7-PR178A | |
| LowHCN | S1662 > R040A-R161 | X1083-021 | S2163-1-065-R190 | S2372-4-R650A | S1852 > 015B-R171B | S3167-B1-PR10G | |
| NP32-P15355776 | S2372-5-R651 | S1662 > 246A | S1327 > R144 | S1477 > R175A | S1477 > 605A | X814-201A-PR101C | |
| BTX623 | S2002 > 269D | X814 > R209 | S1662 > R512A-R98 | X999 > R305 | S1344 > R036 | S3182-B3-PR39B | |
| S2172-7-R475DW | S1843-8-578C | X1206-054 | X814-201C-R17 | X754-198 | S1465 > 587A-PR125A | ||
| S1776 > 349C | S2607-1-R64A | X38-18-R4193 | X814-201B-R523 | S2371–81-R606A | CS14-PSOR-091-03 | ||
| S1661 > 089 | S1346 > 174A | S1438 > 070A | S1465 > R120D | S1776 > R174* | S3317-B2-PR65A | ||
| S1327 > 159A | S1477 > R216 | X999 > 177B | S1662 > 216 | X999 > R485 | S3322-C6-PR67 | ||
| S1479 > R771A | X1210-354 | S2172-5 > R312 | S2097-4-137 | S1662 > R554B | CS14-PSOR-080-15 | ||
| X1092-154 | X799 > 105 | S1438 > R302 | S14PR > R181 | S2371-98-R623 | CS14-PSOR-022-15 | ||
| S20693 > BK126 | S1341 > R315 | S1479 > R334B | X999R348B | S1662 > R040A | X814-201B-PR9C | ||
| S1479 > R334B-R45 | S2171-23-R545A | S1312 > R97A | S1383 > 046F | S1646 > R46 | S3188-B6-PR46A | ||
| S2092-1-115BK-R86 | S1852 > 015B-R171A | S2125 > 245B | S2163 > R186B-R129G | S1776 > R65 | |||
| X999 > R393 | S2371-23-R545C | S2172 > R187 | S1662 > R246C | ||||
2.2 Experimental design and establishment
The pedigrees were planted at the Texas A&M AgriLife Research Farm in Burleson County, College Station, Texas. These trials were planted on April 2, 2019 (seed year), and maintained through 2020 (regrowth year). Annual sorghum (S. bicolor) was replanted on April 8, 2020. A randomized complete block design with two replications and single row plots of 6 m length and 1.5 m wide was used. Agronomic practices standard for forage sorghum production in Texas were followed (Schnell et al., 2019) throughout the growing season to maturity. The trials were harvested on a plot level using a John Deere 7300 forage harvester mid-September and end of August in 2019 and 2020, respectively.
2.3 Hydrogen cyanide estimation
Because previous reports documented that HCN-P varied based on growth stages and temperatures, HCN-P was estimated at different growth stages and weather conditions with the goal of finding sorghum pedigrees low in HCN-P at all times (Bahrani & Deghani, 2004; Barhnhart & Hartwing, 1993; Zahid et al., 2012). At each sampling, the biomass tested was leaves because they are known to accumulate dhurrin more than any other plant part (Gleadow et al., 2016). Younger leaves were selected, particularly the third leaf from the shoot (O'Donnell et al., 2013). One whole leaf was harvested from 10 different plants per plot (Loyd & Gray, 1970) and packaged into a ziplock bag and stored into a cooler from which fresh samples were tested for HCN-P immediately in the laboratory. Fresh tissue was used because processes such as freeze-drying samples are known to alter HCN-P concentrations (Gleadow et al., 2012).
In the establishment year (2019), biomass sampling for HCN-P occurred in late summer (September 3–6) when the plants were at physiological maturity stage (grains with a black layer at the bottom of the kernel were found in more than half of the plants within a plot). At this time, daily air temperatures ranged from 21 to 38°C, soil temperature ranged from 27 to 30°C, and relative humidity ranged from 28% to 92%. Further, the plots were under drought and heat stress.
In 2020, HCN-P was first sampled in late spring May (27–29) when sorghum plants were at the five- to seven-leaf stage (vegetative), daily air temperatures ranged from 18 to 30°C, soil temperature ranged from 26 to 27°C, and the relative humidity was 48%–99%. Third and fourth sample dates were collected July (1–3) at 50% flowering (stigma were found in more than half of the plants within a plot) and at physiological maturity (August 18–20) when daily air temperatures ranged from (28–29°C and 30–31°C), soil temperature (27–28°C and 31–32°C), and relative humidity (71%–76% and 65%–71%), respectively.
2.4 Visual assessment of HCN-P
The visual color assessment of HCN-P was based on the modified protocol of Buck et al. (1973). An independent HCN curve was built by mixing increasing amounts of amygdalin (synthetic cyanogenic glycoside originally found in bitter almonds) with a fixed amount of β-glucosidase (enzyme) to visually assess color change using indicator paper. The indicator paper was prepared by dipping filter paper strips of uniform dimensions in picric acid reagent (aqueous 5% sodium carbonate with 0.5% picric acid) and blotting to dampness on paper towels. Aqueous solutions were prepared such that 1 ml solution would contain zero to 30 mg amygdalin and 1 ml of each solution was added to a different Erlenmeyer flask. An aqueous solution containing 1 mg/ml β-glucosidase was prepared, and 100 μl was added to the opposite side of each flask containing the amygdalin solutions. An indicator paper was suspended in each flask, a stopper was firmly inserted, and the two solutions were mixed and incubated for 1 h at 37°C ± 2°C. Actual HCN concentration was computed from the amygdalin considering a ratio of 1 HCN: 1 amygdalin. HCN has a mass weight of 27.03, whereas amygdalin is 309.27 g.
The visual scale is based on the intensity of color change (Figure 1). An excess of amygdalin allowed the same amount of β-glucosidase to produce a higher intensity red color, which upon computation gave the actual amount of HCN released following each enzymatic reaction.

For each plot, 300 g was weighed from the 10 whole leaves harvested per plot and cut into 1 cm pieces and placed into a 250-ml Erlenmeyer flask. Chloroform (1.5 ml) was added to the sample flask to create a vapor to lyse cells and an indicator paper suspended by the tightly inserted stopper. A positive control was also prepared by adding 100 μl β-glucosidase to 1000 μl of aqueous 1 mg/ml amygdalin. Samples were incubated in batches and scored. The color scale (Figure 1) was interpreted using a standard scale (Table 2).
2.5 Quantitative estimates of HCN-P using colorimetry
2.6 Data analysis
A HCN colorimetric curve was built based on the change in color (ΔE) compared with the actual HCN released from the different amygdalin concentrations. Correlations were run between HCN from the amygdalin and the values from the colorimetry. The values from the colorimetry were dependent on the standard as described earlier on in Section 2.4. The HCN concentration was derived from the amygdalin considering a ratio of 1 HCN: 1 amygdalin. HCN has a mass weight of 27.03, whereas amygdalin is 309.27 g. For example 0.005 g amygdalin = (.005/309.27)*27.03, giving 0.00044 g HCN. L, a, and b values were regressed against actual HCN to test the relationship in JMP® Pro Version 15 (SAS Institute Inc., Cary, NC, 2016). A frequency distribution for color across all plots was made to assess how many fell under each category on the color scale. Subsequently, comparisons were made with the colorimetric distribution.
3 RESULTS AND DISCUSSION
3.1 Hydrogen cyanide colorimetric curve
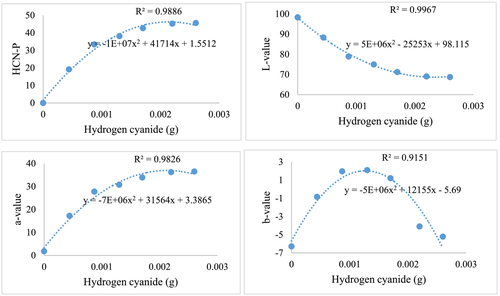
The HCN colorimetric curve considered change in color (ΔE) by the action of β-glucosidase enzyme versus the actual HCN from varying amygdalin concentrations (Karsavuran et al., 2014). An increase in HCN increased the a-value (red-green vector); the b-value (blue-yellow vector) increased up to HCN concentrations of 0.015 g at which point b-values decreased with higher HCN concentration. Conversely, the L-value decreased as HCN concentrations increased. The trends in colorimetry were consistent as reflected by high R2 values for all variables (Figure 2).
3.2 Comparisons between the visual color assessment assay and colorimetric measure
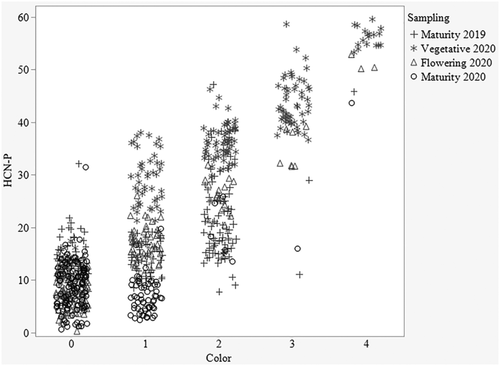
The visual assessment and colorimetric measure assays were highly correlated (R2 = 0.83) across all sampling dates and thus produced similar results; for example, HCN-P was lower in more mature sorghum. However, the visual color score consistently produced lower HCN-P estimates than the colorimetric assay with a greater range in variation (Figure 3). The colorimetric measure was also found to have lower error variation than visual assessment (Table 3), improving the explained variation in the qualitative assay by 3%.
| Color scale | Indicator paper color change | ||
|---|---|---|---|
| Indicator paper | Interpretation | Inference | |
| 0 | No color change | No detectable HCN | Safe for grazing |
| 1 | Very light golden-brown | Very low HCN | Safe for grazing |
| 2 | Light brown/copper | Low HCN | Safe for grazing |
| 3 | Dark brown color | Moderate HCN | Should be grazed sparingly, not safe if allowed in large quantities |
| 4 | Very dark brown/burgundy | Very high HCN | Not safe for grazing |
Bradbury et al. (1999) documented different methods of HCN estimation ranging from picrate paper tests to spectrometry and acid hydrolysis. In comparison with the methods used in this study, the picrate paper tests used in Bradbury et al. (1999) had longer exposure times ranging from 3 (shortest) to 24 h, which is prohibitively time consuming when dealing with large numbers of genotypes. A similar approach was also used by Burns et al. (2012) with the same challenge. Spectrometry was used at a later stage to quantify the color change of the picrate paper by preparing aqueous solutions to record absorbance, and this improved results though is also more labor intensive. This approach requires more than a day to get results, which can become resource intensive in the long run (Bradbury et al., 1999; Burns et al., 2012; Fox et al., 2012). Further, the authors (Bradbury et al., 1999) found that the potassium phosphate used in the acid hydrolysis approach reduced the rate of liberation of HCN from the cyanogenic glucoside of the cassava flour and reduced accuracy of the assay.
Methods used in this study (colorimetry and visual assessment) were faster than the previous studies, because results obtained within an hour of laboratory work, freeing up space, glassware, and time to increase the number of samples. Colorimetry only added approximately 2 min per sample. It has been found that lower accuracy methods can still result in better decisions if offset by higher throughput and low cost that allows greater sample collection (Lane & Murray, 2021).
In addition, the colorimetric assay provided both improved accuracy and quantitative metrics important for statistical analyses and for selection in a breeding nursery. Most importantly, visual assessment is a subjective rating subject to variation from one evaluator to another; consequently, results are often less reproducible (Johnston & Kao, 1989).
3.3 Heritability/repeatability of HCN
In analysis, none of the main effects or interactions were significant for visual assessment but significant effects were detected for year, pedigree and pedigree × year interaction in the colorimetric analysis (Table 3). Given the absence of genetic variation in the visual assay, the repeatability was zero; in the colorimetric assay, repeatability for HCN-P, although present, remained low. It is hard to estimate genetic variation in a qualitative assay (visual assessment) because it is categorical in nature, and it was not surprising that the repeatability was zero. However, the low repeatability of the colorimetric assay is largely explained by the large differences between the years, pedigrees, and growth stages and interactions between these differences. As mentioned previously, environmental stress, which differs from year to year, as well as the phenological stage the plant is in will alter the HCN-P. Repeatability estimates could be improved by only comparing sampling points within a similar growth stage. However, manipulating sampling or analysis solely to improve repeatability would be ill advised. From an agronomic perspective, especially under grazing systems where the crop might be consumed at any time, it is important that the pedigrees have low HCN across all growth stages. In the case of this study, however, HCN-P estimation in 2019 was only done at maturity. If sampling had been done at five- to seven-leaf stage and flowering as in 2020, this could have increased reproducibility (Table 4).
| Visual color scale | Colorimetric (HCN-P) | |||
|---|---|---|---|---|
| Source of variation | % variation | Significance | % variation | Significance |
| Year | 28.4 | 0.4853 | 28.8 | <0.001 |
| Pedigree | 0.0 | 0.0865 | 1.5 | 0.0009 |
| Pedigree × year | 4.1 | 0.3173 | 25.3 | 0.0005 |
| Batch | 11.4 | 0.0639 | 0 | 0.7498 |
| Replication | 1.5 | 0.7754 | 0.9 | 0.597 |
| Range | 11.4 | 0.0989 | 2.2 | 0.4797 |
| Row | 2.8 | 0.0857 | 0 | 0.4637 |
| Pedigree × batch | 10.1 | 0.3027 | 14.2 | 0.4809 |
| Error | 30.2 | 27.1 | ||
| Repeatability | 0.0 | .16 | ||
3.4 Comparison between years
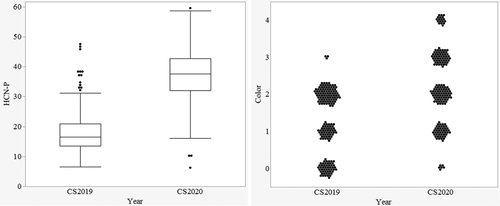
The raw data for HCN-P ranged from 7 to 47 for 2019 (September 3–6) and from 6 to 60 for 2020 (May 27–29) for the colorimetric measure (Figure 4). Average HCN-P from 2019 (16) was significantly lower than in 2020 (31). The year and pedigree × year effect accounted for 29% and 25%, respectively, of the total experimental variation (Table 3). Overall, HCN-P increased in 2020. This difference was clearly shown by the frequencies of plots scoring in the various color categories of the visual assessment, which showed most of the plots had no to very low HCN-P in 2019 and a significantly higher HCN-P across all color categories in 2020 (Figure 4). Pedigrees performed significantly differently from one another for the colorimetric HCN-P, meaning there is variation and selection can be done for low HCN perennial sorghums.
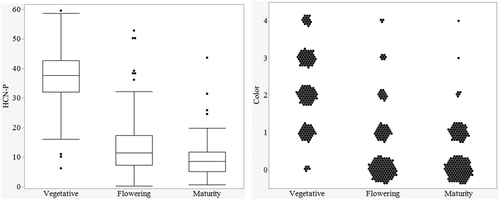
This difference between years might be explained in part by the difference in air temperatures during sampling between late summer of the first season and late spring sampling of the second season, in addition to growth stage differences. Zahid et al. (2012) showed higher HCN-P in the earlier plant growth stages and HCN concentrations decreased as biomass increased in later growth phases. Within 2020, the growth stage significantly affected HCN-P, accounting for 72% of the total experimental variation. The highest HCN-P was recorded in the vegetative phase, with concomitant decreases in both flowering and maturity stages (Figure 5). HCN-P of the individual pedigrees was consistent across the growth stages per se (P = 0.5). The comparison made across the growth stages confirmed the findings of Zahid et al. (2012), as the HCN-P reduced with continued growth from vegetative to physiological maturity.
3.5 Comparisons between perennial and annual sorghums
Among sorghum pedigrees, several trends became obvious. First, most of the grain sorghum pedigrees were low in HCN-P (Table S1). The lower HCN-P in grain sorghums may be due to selective breeding; breeding for adaptation could have indirectly selected against dhurrin content. These results are similar to Hayes et al. (2016) who concluded that wild sorghums have a higher HCN-P when stressed. Given this perspective, intentional phenotyping, selection, and breeding for low HCN perennial sorghum will be necessary to produce genotypes acceptable to animal producers.
4 CONCLUSION
Colorimetry is an objective and more precise method to assess the HCN-P of sorghum forages compared with visual color assessment. Overall, HCN-P had a low repeatability across seasons, implying that additional refinement of the technique is merited, but this problem might be offset by the high throughput and low cost of the chemical methods used (Lane & Murray, 2021). Both annual and perennial sorghum produce dhurrin, but perennial sorghum had significantly higher HCN-P than annual sorghum. If the trait is heritable, selection for pedigrees with reduced HCN-P is important.
Other factors also influence HCN-P. First, environmental conditions throughout the year affect HCN-P in sorghum, but pedigree × year interaction indicated that pedigrees reacted differently to these conditions. Growth stage maybe even more important and is important to consider when feeding animals on fresh forage. Perennial sorghum should either be processed into silage or hay or given sparingly in the earlier growth cycle.
ACKNOWLEDGMENTS
The authors thank The Land Institute of Salina KS and Mr. Bob Hatch, S. Murray's USDA-NIFA Hatch Project, and the Eugene Butler Chair for the research funds. In addition, we thank the Texas A&M University farm team for their assistance in agronomic management, and many student workers that helped with the processing of the sorghum samples.
CONFLICT OF INTEREST
The authors declare no conflicts of interest regarding publication of this manuscript.


