Brain development in children with developmental delay using amide proton transfer-weighted imaging and magnetization transfer imaging
ABSTRACT
Importance
The process of brain development in children with developmental delay is not well known. Amide proton transfer-weighted (APTw) imaging is a novel molecular magnetic resonance imaging (MRI) technique that can noninvasively detect cytosolic endogenous mobile proteins and peptides involved in the myelination process, and may be useful for providing insights into brain development.
Objective
To assess the contribution of amide proton transfer-weighted (APTw) imaging and magnetization transfer (MT) imaging to the evaluation of children with developmental delay (DD).
Methods
Fifty-one patients with DD were recruited to this study. The patients were divided into two groups according to the state of myelination assessed on conventional magnetic resonance imaging (MRI). Thirty patients (10 girls, 20 boys; age range: 1–8 months; median age: 4 months) in group A showed delayed myelination on MRI, while 21 patients (3 girls, 18 boys; age range: 12–36months; median age: 25months) in group B showed normal myelination on MRI. Fifty-one age- and sex-matched children with normal developmental quotient (DQ) and normal MRI appearance were recruited as normal controls. Three-slice APTw/MT axial imaging was performed at the level of the centrum semiovale, the basal ganglia and the pons. Quantitative data of the MT ratio (MTR) and APTw were analyzed for multiple brain regions. Independent-sample t-tests were used to compare differences in APTw and MTR signals between the two DD groups and normal controls. Analysis of Covariance was conducted to correct the statistical results. The level of statistical significance was set to P < 0.05.
Results
For group A, the MTR values were lower in all regions (P = 0.004–0.033) compared with the normal controls, while the APTw values were higher in the pons, middle cerebellar peduncle, corpus callosum, frontal white matter, occipital white matter and centrum semiovale (P = 0.004–0.040 ). For Group B, the MTR values were slightly reduced, and the APTw values were slightly increased compared with the normal controls, but the differences were not statistically significant (P > 0.05).
Interpretation
For DD patients showing signs of delayed myelination on MRI, MTR and APTw imaging can help to diagnose myelination delay by quantifying semi-solid macromolecules and cytosolic endogenous mobile proteins and peptides at a molecular level, providing a new method for comprehensive evaluation of DD. For DD patients with normal myelination on MRI, the clinical values of MTR and APTw imaging remain to be explored.
1 INTRODUCTION
Developmental delay (DD) is relatively common in pediatric patients, with an estimated prevalence ranging from 5% to 10%,1-3 1% to 3% among children aged less than 5 years.4 DD is defined as a significant delay in two or more of the following: motor functions (gross/fine), speech/language, cognition, personal/social skills, and activities of daily living. Magnetic resonance imaging (MRI) is generally essential for the assessment of children with DD, and is prioritized over computed tomography, for detecting abnormalities in 48.6%–65.5% of children with global delay.5-8 One study reported that brain developmental abnormalities on neuroimaging can be identified in 30%–60% of children with mental retardation and DD.9 This implies that nearly half of children with DD demonstrate a normal MRI examination or normal variants,10, 11 which inspired us to explore novel imaging methods for the further assessment of DD.
Over the past few years, MRI progressed from structural to functional and molecular imaging. Several advanced imaging techniques have been reported to provide more information for the assessment of DD in pediatrics. The MRI technique of diffusion tensor imaging has been employed to assess children with DD, and its application has led to a suggestion that the white matter fiber tract in children with DD (whose scans are otherwise commonly normal on conventional MRI) had different segments to that in normal children.12-14
Molecular MRI is an exciting new approach for recent biomedical studies. Amide proton transfer-weighted (APTw) imaging is a novel molecular MRI technique capable of noninvasively detecting cytosolic endogenous mobile proteins and peptides involved in myelination, while conventional magnetization transfer (MT) imaging is susceptible to a semi-solid macromolecular phase in tissues. A previous study at our institution used APTw/MT imaging to quantify brain maturation in pediatric brain development. It characterized age-related variations in the magnetization transfer ratio (MTR) and APTw, and offered additional information in the form of imaging biomarkers for the assessment of pediatric brain development.15
The present study aimed to evaluate whether APTw/MT imaging can add valuable information for the assessment of children with DD by finding abnormalities at the molecular lever by comparing DD patients with age- and sex-matched normal controls. We hypothesized that in comparison with normal subjects, DD patients would show increased levels of mobile protein content and decreased semi-solid macromolecular content in the white matter, thereby leading to an elevated APTw signal and decreased MTR signal. Such differences at the molecular level may hold potential as an imaging biomaker for delayed development.
2 METHODS
2.1 Ethical approval
This study was approved by the Ethics Committee of Beijing Children’s Hospital (2015–85). The parents of all children actively participating in the study provided written informed consent for their child’s participation in the study.
2.2 Subjects
Each child underwent a full neurological examination performed by a pediatric neurologist. The developmental quotient (DQ) was calculated for all children according to the Gesell Development Scale. Abiding by previous guidelines.16 two radiologists (Z.H. and Y.P., experienced in developmental neurology) further assessed the images in terms of the degree of myelination and the existence of disease on conventional MR images. Before undergoing the MRI scans, all subjects were sedated with oral 10% chloral hydrate (0.5 mL/kg), because of their young age.
All DD patients admitted to our hospital for a neuroradiologic examination because of mental retardation of unknown origin but having not undergone a progressive clinical course and without any evidence of metabolic abnormalities were recruited. Patients with recognizable lesions on MRI, cerebral palsy, chromosome abnormalities, autism, or other neurologic or degenerative diseases were excluded. No hearing disorders were identified. Finally, 51 pediatric patients with DD were recruited to this study. The patients were split into two groups according to their state of myelination on conventional MRI. Thirty patients (10 girls and 20 boys; age range: 1–8 months; median age: 4 months) assigned to group A exhibited delayed myelination on MRI, with 9 children showing severe retardation (DQ 25–39), 14 showing moderately severe retardation (DQ 40–54), and 7 exhibiting only minor retardation (DQ 55–75). A further 21 patients (3 girls and 18 boys; age range: 12–36 months; median age: 25 months) showing normal myelination on MRI were assigned to group B, with 4 having severe retardation, 8 having moderately severe retardation, and 9 only minor retardation.
A further group of 51 age- and sex-matched children with normal DQ (DQ > 85) and normal MRI findings were recruited as normal controls. To comply with the case control design, these normal control subjects were also split into groups A’ and B’ (Table 1). The control children received a brain MRI examination for noncerebral or nonneurologic indications, the most common of which were nausea, vomiting, headaches, dizziness and idiopathic febrile seizures. The general characteristics of the control subjects included an age between 1 and 36 months; a full-term gestational age between 37 and 41 weeks without a complicated perinatal course; normal brain MRI results; normal myelination for the age; normal results on neurological examinations; absence of current and past neurological or psychiatric disorders; and no evidence of genetic, metabolic, or infectious disorders. A follow-up review of the medical records of all subjects was performed 1 year after the MRI examination, and any children with DD or demonstrating neurologic abnormalities were excluded.
| Group | Age (months) | Sex (Male/female) | |
|---|---|---|---|
| Range | Median | ||
| A’ | 1–8 | 4 | 20/10 |
| B’ | 12–36 | 25 | 18/3 |
2.3 MRI protocol and image acquisition
All MRI was acquired on a 3-T scanner (Achieva; Philips Medical Systems, Best, The Netherlands), using a pencil-beam, second-order shimming, a dual-channel body coil for emission, and an eight-channel coil (sensitivity-encoding) for reception. Conventional MRI with T1-weighted, T2-weighted, FLAIR, and DWI sequences to characterize brain morphology was conducted before MT/APTw imaging. MT/APTw single-section imaging was performed under off-resonance continuous-wave radiofrequency irradiation. To increase the signal-to-noise ratio, a multi-acquisition MT/APTw imaging method with multiple radiofrequency pulses was performed, as described in previous study of our institution.15 The scanning schemes and data processing for the conventional sequence and MT/APTw imaging were formulated before the acquisitions were started.
2.4 Image processing and analysis
The acquired raw data were uploaded into an IDL application (ITT Visual Information Solutions, Boulder, CO, USA) for analysis, measurement and reconstruction of pseudocolor images. The amide proton transfer (APT) experiments involved acquisition of three transverse slices positioned at the levels of the pons, basal ganglia, and centrum semiovale, according to axial T2-weighted imaging. Based on the approach used for previous studies in our hospital,15 ten regions of interest (ROIs) were manually plotted in a consensus fashion by two senior staff neuroradiologists (H.Z. and Y.P., with 10 and 15 years of experience in brain imaging respectively), using the co-registered standard MR images (T2-weighted or FLAIR) for anatomical reference (Supplementary Figure S1). These ROIs consisted of the pons, middle cerebellar peduncle, genu of the corpus callosum, splenium of the corpus callosum, frontal white matter, occipital white matter, caudate, putamen, thalamus, and centrum semiovale. The APTw and MTR signals of all subjects were measured for all of the regions of interest.
2.5 Statistical analysis
The data were analyzed using SPSS version 17.0 (Chicago, IL, USA). Differences in the MTR/APTw values between the left and right hemispheres were tested using paired-sample t-tests. Independent-samples t-tests were employed to compare differences in APTw and MTR signals between the DD patients and normal controls. ANCOVA was conducted to control for differences in age and the internal correlation of the different brain regions, and to prevent these from affecting the statistical results. The level of statistical significance was set to P < 0.05.
3 RESULTS
No statistically significant differences in the MTR/APTw values were identified between the left and right hemispheres (P > 0.05); therefore, the data from both hemispheres were combined for the analysis of all subjects.
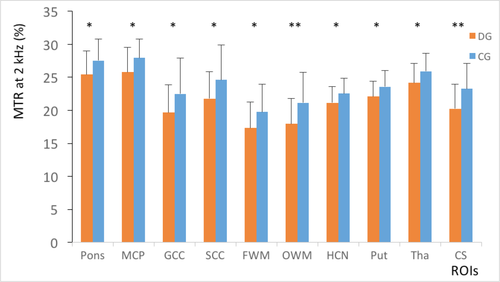
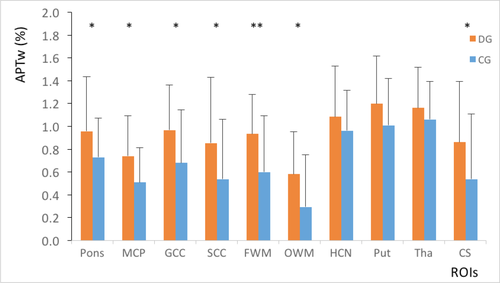
For group A, the DD patient’s MTR values were considerably lower than those of the normal controls in all regions (P = 0.004–0.033; Figure 1). The APTw values in the DD patients were higher than those of normal controls in the pons, middle cerebellar peduncle, genu of the corpus callosum, splenium of the corpus callosum, frontal white matter, occipital white matter and centrum semiovale (P = 0.004–0.040; Figure 2). In the caudate, putamen and thalamus, the APTw values were slightly elevated compared with the normal controls, although the differences were not statistically significant (P = 0.086–0.267). The ANCOVA (Table 2) showed that statistically significant differences in the MTR and APTw values between patients and normal controls remained after the effects of age and internal correlation between ROIs were controlled for (P < 0.001).
| Source | MTR | APTw | ||||
|---|---|---|---|---|---|---|
| Partial Eta Squared | F | P | Partial Eta Squared | F | P | |
| Intercept | 0.837 | 3067.066 | <0.001 | 0.452 | 491.743 | <0.001 |
| Group | 0.125 | 85.031 | <0.001 | 0.077 | 49.373 | <0.001 |
| Age | 0.528 | 665.927 | <0.001 | 0.218 | 166.272 | <0.001 |
| ROI | 0.073 | 46.919 | <0.001 | 0.029 | 17.622 | <0.001 |
- MTR, magnetization transfer ratio; APTw, proton transfer-weighted; ROI, regions of interest
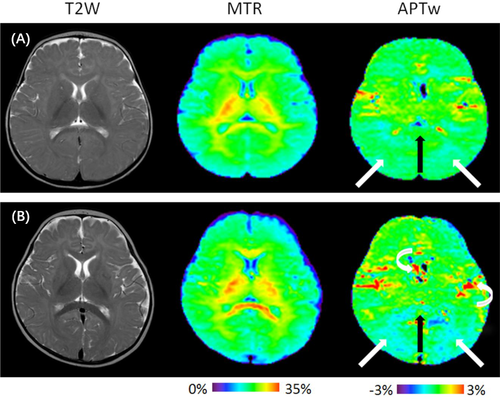
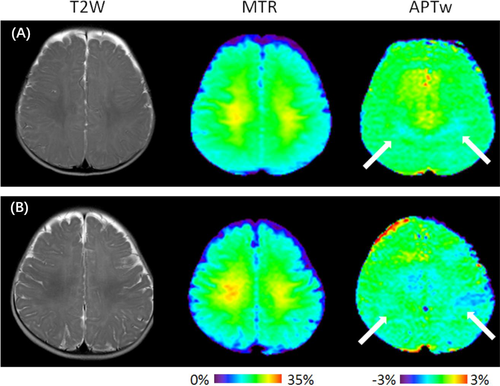
Figures 3 and 4 show representative T2-weighted, MTR, and APTw MR images taken from a 7-month-old child with DD (group A) and a 7-month-old normal child. Figure 3 reveals that lower MTR intensities and higher APTw intensities in the basal ganglia and the white matter structures were identified in children with DD in comparison with normal controls. Figure 4 indicates that the MTR signal intensities in the centrum semiovale of children with DD were lower than those of the normal controls, while the APTw signal intensities in the centrum semiovale were higher than those of normal controls. During myelination, relatively large variations in MTR and APTw signals can be observed in white matter structures.
For group B, the MTR values slightly reduced (Figure 5), while the APTw values slightly increased in comparison with normal controls (Figure 6). However, the differences were not statistically significant (P > 0.05).
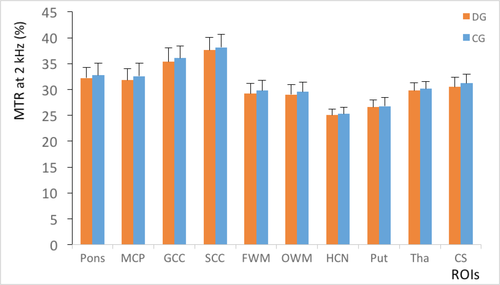
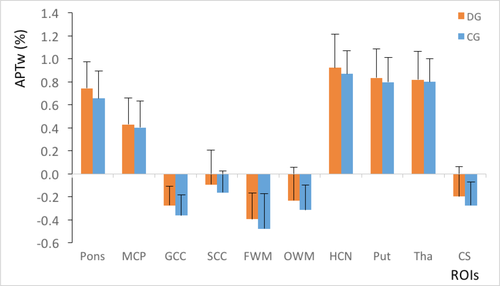
Compared with group B (Figures 5 and 6), the standard deviations of the MTR and APTw values in group A (Figures 1 and 2) were relatively higher in all regions, particularly for the APTw values. The presence of image artefacts (Figures 3 and 4) was noted, including inevitable interference from the skull, cerebrospinal fluid and cerebral ventricles.
4 DISCUSSION
This study demonstrated the application and feasibility of APTw/MT imaging for assessing brain development in children with DD, suggesting the possibility of using the measurements as non-invasive biomarkers. The most noteworthy finding of the present study is the significant differences in the MTR and APTw values between DD pediatric patients with delayed myelination on MRI and age-matched normal controls. Researchers have previously ascribed magnetization transfer to the presence of macromolecules associated with myelination, cholesterol, and galactocerebrosides.17-20 APTw imaging was developed for the detection of intracellular mobile proteins.21 Developmental studies on immature oligodendrocytes reported the detection of myelin basic protein in the oligodendroglial cytoplasm before myelination, with the highest intensity being exhibited during early myelination.15 Recent studies have shown age-dependent variations in the MTR and APTw signals of the pediatric brain,15, 22, 23 with MTR increasing exponentially with age and APTw decreasing exponentially with age, and MTR therefore being negatively correlated with APTw. The decreasing APTw signal intensity observed in the process of brain myelination may be primarily associated with decreasing protein mobility with the change from mobile proteins to semi-solid proteins.15 The exact mechanism should be investigated in the future work.
This study indicated that the lower MTR values and higher APTw values obtained in the white matter with delayed myelination were probably dominated by the decreased conversion of myelin basic protein to myelin sheath in the oligodendroglial cytoplasm. Nossin-Manor et al24 conducted an imaging study of deep gray matter maturation in very preterm neonates, including measurement of MTR values during brain development. They showed that neonates with white matter injury at presentation demonstrated lower MTR in the basal ganglia than neonates with normal radiologic findings, and concluded that this indicated delayed maturation in areas not affected by the primary injury. Previous MT imaging of the brain in subjects with periventricular leukomalacia revealed abnormalities of myelination in the splenium of the corpus callosum and the thalami.25 Slight differences in the APTw in the basal ganglia regions (e.g., the caudate, putamen and thalamus) were identified between DD with delayed myelination on MRI and normal controls, whereas obvious differences in MTR in these regions were reported, probably because the MTR approach is reported to be more susceptible to myelination than APTw.15 Moreover, MTR showed more noticeable statistical differences in the occipital white matter and centrum semiovale than in any other regions, while APTw showed the most noticeable differences in the frontal white matter. These prominent differences were probably due to the brain functional area being partially located in the frontal and occipital lobe. The centrum semiovale is composed of various projection fibers with different functions, including commissural fibers connecting the two hemispheres, and any delayed myelination in this region is likely to cause a noticeable impact on the normal development of children. However, the correlations between the MTR and APTw values of various brain functional areas and different types of delayed development remain to be explored in the future.
The MTR and APTw values of pediatric patients with DD and normal-appearing myelination on conventional MRI were also found to be slightly different from those of the normal controls, with slightly decreased MTR values and increased APTw values in all regions of the children with DD. According to previous reports,26-28 myelination is predominantly complete by the end of the second year. In group B, the median age of the patients was 25 months, probably leading to extremely small differences.
There are several limitations to this study. First, the patients with DD and normal myelination on MRI were all older than 12 months, and younger patients should be covered in future studies. Moreover, it should be further investigated whether there are any correlations between the MTR or APTw values and the mental performance of children. From a technological angle, only three-slice imaging was obtained, which is a limitation of the single-slice acquisition protocol, and the MRI signal variations could not be assessed for all brain regions. Cerebrospinal fluid pulsation artifacts were relatively obvious for the relatively wide extracerebral space and encephalocele, particularly in the first years after birth, and therefore the APTw values in some regions (e.g., corpus callosum and basal ganglia) will obviously be impacted. The small APTw effect leads to extremely low spatial resolution; in the future, a more complicated APTw imaging acquisition29, 30 or analysis31, 32 method should be adopted to more accurately quantify the APTw effect.
We believe this study to be the first application of 3-T MRI APTw imaging in children with DD. Using quantitative APTw and MT imaging, we demonstrated that children with DD and delayed myelination on MRI showed lower MTR and higher APTw values than normal controls, especially in white matter. Moreover, for children with DD and normal myelination on MRI, APTw/MT imaging was found to add little additional information to the neuroradiologic work-up, and the clinical values of MTR and APTw imaging require further exploration. Subsequently, we intend to perform a whole brain study of DD with delayed myelination using 3D-APT technology.
CONFLICT OF INTEREST
The authors declare that they have no conflicts of interest.


