Isothermal crystallization kinetics, morphology, and crystalline structure of polypropylene/poly(4-methyl-1-pentene) blends
Funding information: Ministry of Education, Culture, Sports, Science and Technology
Abstract
The isothermal crystallization kinetics of polypropylene (PP) in poly(4-methyl-1-pentene) blends were investigated by comparing the blend results with those of the PP homopolymer. Fast scanning calorimetry-optical microscope studies were carried out to determine the crystallization rate and microscale morphology during crystallization from the highly supercooled liquid. The crystallization rate of the blend system was faster than that of the PP homopolymer at temperatures between 50°C and 90°C. Synchrotron small angle X-ray scattering and transmission electron microscopy results showed that there were no differences in the thickness of lamellar PP or nanoscale PP morphology between the homopolymer and polymer blends. Wide angle X-ray scattering data revealed that the content ratio of the PP α form and the conformational disordered PP phase did not change between both samples. However, the crystalline lattice size of PP decreased in the blend systems. The increment of crystallization kinetics of the blend system is explained by a Gibbs free energy diagram.
1 INTRODUCTION
The crystallization kinetics of polypropylene (PP) depends on the amount of poly(4-methyl-1-pentene) (PMP), the crystallization temperature, and the cooling rate, as well as the grade of the samples.1, 2 Clarifying the complexity of the crystallization behavior of PP in the PP/PMP blend system is the motivation of this series of studies. In the previous study, the authors reported non-isothermal crystallization behavior for PP, PMP, and their blends (weight fraction of PP is 70 wt%) using fast scanning calorimetry (FSC).1 Features of the fast temperature scanning of FSC allow for quantitative investigations of the crystallization kinetics over a wide scanning rate range or in the highly supercooled state without the effect of unwanted nucleation or crystallization during cooling.3-5 As can be seen in many other semi-crystalline polymers, the crystallization temperature and the crystallinity decrease with increasing the cooling rate for PP, PMP, and PP/PMP blends.1 Interestingly, the presence of PMP in the blends does not affect the crystallization temperature of the α form (ie, the thermodynamically stable monoclinic crystal6-13) of PP that forms between 40°C and 120°C under the non-isothermal condition. On the other hand, the presence of PMP tends to suppress the formation of the mesomorphic conformational disordered phase (hereafter condis crystal6-13) of PP, which forms from the molten state around room temperature at a cooling rate of 50 to 300 K s−1. It is still not clear why the formation of the condis crystal of PP is suppressed during the limited quenching rate by adding PMP. Regarding the overall crystallinity of PP, there were no differences in the heat of fusion between PP and PP/PMP blends that were prepared from the melt with the same cooling rate (ie, the existence of PMP does not affect the total crystallinity of PP that was prepared by continuous cooling from the melt). Also, comparing the crystallization rate during cooling, the PMP homopolymer is at least 100 times faster than PP homopolymer or PP in the PP/PMP blends. To understand the non-isothermal crystallization kinetics of the blend system, the isothermal crystallization behavior should also be clarified.
In the present study, the isothermal crystallization kinetics of PP in the PP/PMP blends is investigated by comparing the behavior of the blends with that of the PP homopolymer. The in-situ microscale morphological images were captured using optical microscopy during isothermal FSC measurements. Moreover, lamellar/amorphous thickness and the ratio of the α form/condis crystals were quantified by synchrotron small and wide-angle X-ray scattering (SWAXS) measurements for PP, and PP/PMP blend samples that prepared by using an FSC chip sensor. In addition, transmission electron microscope (TEM) observations were also carried out for the samples after SWAXS measurements to confirm the nanoscale morphology. An interpretation for suppressing the formation of PP condis crystal in the blend system (as reported in ref. 1) was also discussed.
2 EXPERIMENTAL
The samples used in the present study were the same as used in the previous work.1 (ie, isotactic PMP (commercial grade of TPX MX004, melt flow rate [MFR] of 25 g 10 min−1 at 260°C, Mitsui Chemicals, Japan), isotactic PP (commercial grade of TF850H, MFR of 3.0 g 10 min−1 at 230°C, Prime Polymer, Japan), and PP/PMP blends (PP/PMP = 70/30 wt%, prepared by melt-blending at 260°C in a twin-screw extruder under a nitrogen atmosphere)).
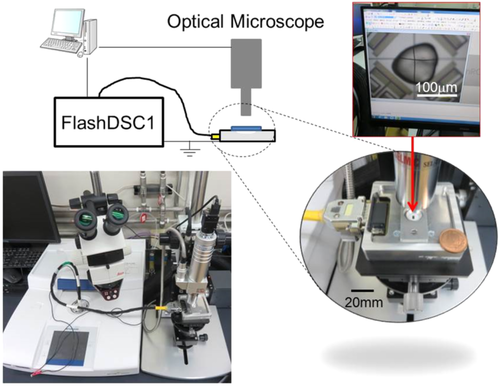
The Fast scanning calorimetry-optical microscope (FSC-OM) system used in the present study is shown in Figure 1. FSC measurements were carried out using a Flash DSC 1 calorimeter (Mettler Toledo, Switzerland) equipped with the MultiSTAR UFS 1 chip sensor. The sampling rate of the isothermal FSC measurements was 3.3 kHz. The accuracy of the temperature measurement was experimentally confirmed with the onset melting temperature of indium; after the measurements, a small piece of indium was placed on the sample surface and heated at a rate of 3000 K s−1. It was also confirmed that the FSC curves obtained from different samples treated by the same protocol show the same result (ie, the results were highly reproducible). A remote sensor assembly with an optical window (homemade in University of Rostock, Christoph Schick) was connected to Flash DSC 1 to measure in-situ OM observations during the isothermal FSC measurements. The FSC-OM measurements were carried out under an air atmosphere. The OM system used was an SE-MP-L with objective lens SEL-270 (SELMIC, Japan). The OM image was captured by a USB camera, STC-MC202 (Omron Sentech, Japan), using WinROOF2015 software (Mitani, Japan). The magnification ratio was 1350. The frame rate of the present OM system was 25 frames per second (25 fps).
The sample mass of PP was estimated from the change in heat capacity at the glass transition temperature of an amorphous sample. The amorphous sample was prepared by quenching it from the melt at a cooling rate of 10 000 K s−1. Then the heat capacity increment at the glass transition temperature (in the unit of J K–1) was obtained by an FSC heating curve. A literature value of 0.456 J g−1 K−1 for the change in heat capacity at the glass transition of perfect amorphous PP was used to estimate the sample mass of PP (ie, divide the heat capacity increment obtained from FSC by the literature value).14 Note, the same method for estimating the sample mass was used in the previous study.1 The sample mass of PP used in the present FSC-OM measurements was 228 ng for PP and 139 ng for PP/PMP blends.
SWAXS measurements were carried out at room temperature on line BL03XU in the synchrotron radiation X-ray facility SPring-8 (Hyogo, Japan) at the Advanced Soft Material BL Consortium. The synchrotron small angle X-ray scattering (SAXS) measurements were performed for the samples that remained on the FSC sensor. The diffraction patterns of WAXS were acquired using a charge-integration type detector named SOPHIAS (RIKEN, Japan), which has a detector plane of 26.40 mm × 63 mm and pixel resolution of 30 μm × 30 μm.15, 16 Pilatus 1 M (DECTRIS) detector systems were used for SAXS. The acquisition time and wavelength λ were 3 s and 0.1 nm, respectively. The q ranges covered in the SAXS and WAXS measurements were 0.2 to 3 nm−1 and 6 to 18 nm−1, respectively, where q is the length of a scattering vector defined by q = 4π sin(θ) λ−1 (here 2θ is the scattering angle). The SAXS data were corrected for sample absorption and background scattering from the air, and for passes through the windows.
TEM was carried out using a JEM-1400 Plus (JEOL, Japan) for observing the crystalline morphology. The thin sections of 80 nm thickness were prepared using microtome at room temperature. The sample was contrasted with RuO4 staining. An acceleration voltage of 100 kV was applied for the stained thin section.
Figure 2 shows the time-temperature profile for the measurements of FSC, OM, SWAXS, and TEM. The sample was quenched from the melt to the isothermal crystallization temperature (Tiso) at a rate of 3000 K s−1 and annealed for 20 s to measure the heat of crystallization. Here, in-situ OM observation was also carried out during the isothermal FSC measurement. Note, the samples for SWAXS and TEM were not the same as those for FSC-OM. SWAXS and TEM experiments were prepared using a different FSC chip sensor (ie, six sensors were used to prepare the samples with Tiso of 40°C, 50°C, 60°C, 70°C, 80°C, and 110°C). After the annealing for 20 s at Tiso, the sample was cooled at room temperature, and SWAXS measurements were performed directly on the samples that remained on the FSC sensor. To prevent recrystallization and/or reorganization during the interval of 1 day between the sample preparation and SWAXS measurements, the FSC chip sensors were kept cool at around −10°C just before the SWAXS measurements. After the SWAXS measurements, the sample was taken out of the FSC chip sensor to make thin sections for TEM observation.

3 RESULTS AND DISCUSSIONS
3.1 Fast scanning calorimetry-optical microscope (FSC-OM)
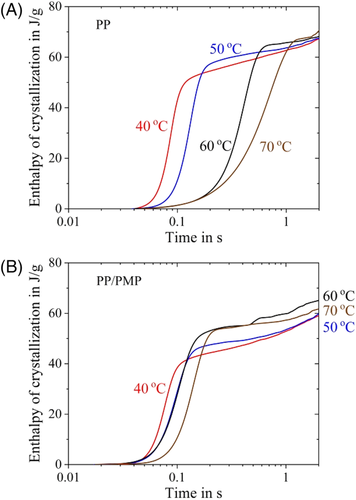
Figure 3 shows the isothermal FSC curves of PP and PP/PMP blends. The exotherm due to the crystallization of PP can be observed for both samples. According to the previous study, PMP crystallizes above the melting temperature of PP even if the cooling rate from the molten state is 10 000 K s−1 (ie, the crystallization rate of PMP is much faster than the maximum quenching rate of the present FSC system). Therefore, in the case of the measurement of isothermal crystallization of PP/PMP blends, the crystalline PMP already exists as solid-state at the starting point of isothermal annealing. Comparing the result of both samples, the exothermic peak time of PP/PMP blends at Tiso of 60°C and 70°C is shorter than that of PP homopolymer. These results mean that the crystallization rates of PP/PMP blends are faster than the PP homopolymer. In contrast, at 40°C and 50°C, the peak time of both samples shows almost the same value.

 (1)
(1)
| Sample | Tiso/°C | t1/2/s | t2nd/s | n | A2nd |
|---|---|---|---|---|---|
| PP | 40 | 0.06 | 0.07 | 4 | 13 |
| 50 | 0.09 | 0.10 | 4 | 10 | |
| 60 | 0.28 | 0.37 | 3.3 | 9 | |
| 70 | 0.44 | 0.62 | 2.1 | 15 | |
| PP/PMP blends | 40 | 0.05 | 0.06 | 4 | 15 |
| 50 | 0.07 | 0.08 | 4 | 13 | |
| 60 | 0.07 | 0.12 | 4 | 13 | |
| 70 | 0.10 | 0.12 | 4 | 9 |
- Abbreviations: PMP, poly(4-methyl-1-pentene); PP, polypropylene.
Figure 5 shows the OM images of PP/PMP blends at 110°C and 70°C. Here, the movies of in-situ OM measurements were attached in the Supporting Information. The observation of spherulites growth during the isothermal FSC measurement was accomplished at 110°C. The linear growth rate of spherulites was 13 μm s−1 for PP/PMP blends at 110°C. This value is in the same digit as reported for the PP homopolymer.20 At 110°C, a change in the OM image cannot be seen after 1.92 s for PP and 2.8 s for PP/PMP blends (hereafter the time represents tend,OM). On the other hand, at 70°C, the spherulites cannot be observed during the isothermal annealing for both samples. Alternatively, it seems that the contrast of the OM image gradually turns dark from 0.04 s. Then, after 0.16 s, there are no differences in the OM images for PP/PMP blends (ie, at 70°C, tend,OMs are 0.16 s for PP and 1.28 s for PP/PMP blends).
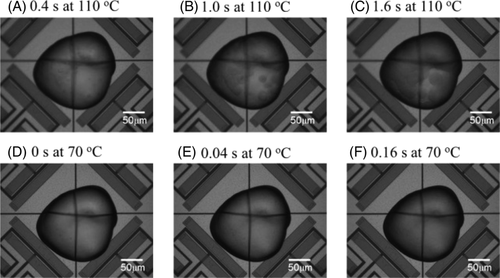
Figure 6 shows the crystallization time over the isothermal crystallization temperature for PP homopolymer and PP/PMP blends. The crystallization time of tend,OM, and tend,FSC is plotted in Figure 6, where tend,FSC is the crystallization time estimated from the isothermal FSC curves as follows: after the exothermic peak time in Figure 3, the FSC curve can be extrapolated as logarithmic dependence of time. Then, the crystallization time (tend,FSC) is defined as the intersection time of the extrapolated heat flow line with zero heat flow. Here, it is estimated that tend,FSC is almost two times larger than t2nd that is obtained from fitting via Equation (1). Figure 6 clearly shows that both tend,OM and tend,FSC would be the same values. This behavior supports the ex-situ measurement of DSC and OM observation in the past study.21 The relationship between the specific times are as follows: t1/2 < tend,OM ≈ tend,FSC ≈ 2t2nd.
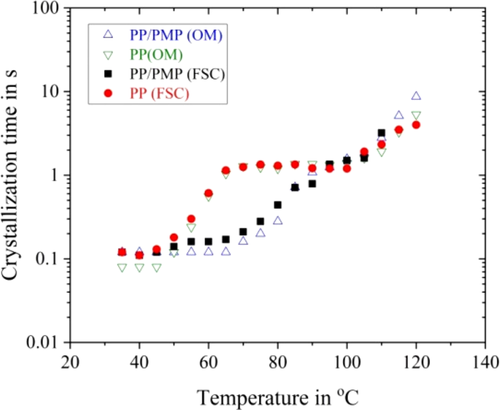
Figure 6 reveals that a bimodal curve with two minima is observed for PP. This finding is in agreement with previous observations for isotactic PP homopolymer in ref. 8-10, 13. In addition, in the present study, it is confirmed that the growth of spherulites cannot be seen in the OM image below 70°C (hereafter low-temperature region) for PP as well as for PP/PMP blends (see also Figure 5D-F).
These behaviors are expected because homogenous nucleation is dominant in the low-temperature region, and growable homogeneous nuclei are present. The simultaneous growth of all these homogeneous nuclei immediately results in a space-filling semi-crystalline morphology.9, 22 The low-temperature region can, therefore, be assigned to crystallization via homogeneous nucleation for PP homopolymer. Moreover, the high-temperature region (ie, above 70°C) of PP homopolymer can be explained as crystallization via heterogeneous nucleation. Here, the number of homogeneous nuclei is orders of magnitude lower than in the high-temperature region, and crystallization after heterogeneous nucleation dominates.
Regarding PP/PMP blends, the crystallization times are shorter than those of the PP homopolymer between 50°C and 90°C for PP/PMP blends. The added PMP seems to act as nuclei and speeds up the overall crystallization rate of PP between 50°C and 90°C. In addition, two minima at the crystallization time cannot be seen for PP/PMP blends. Finally, it seems that the crystallization time for PP becomes shorter than for PP/PMP blends above 110°C. These behaviors are not the same as for polyethylene terephthalate and polybutylene terephthalate filled with a nucleation agent.13, 23-26 According to their studies, both the polyester and its blends with a low molecular nucleation agent also show a bimodal curve with two minima in half time crystallization-crystallization temperature plots. However, in contrast to the crystallization in the low-temperature regime, the high-temperature process is significantly accelerated by the nucleation agent.
It seems that, for the PP/PMP blends, the crystallization rate increases for the crossover region of high and low-temperature region. The crystallization process of PP/PMP blends is not simply explained by homogeneous and heterogeneous nucleation.
3.2 Transmission electron microscope (TEM) and small and wide angle X-ray scattering (SWAXS)
To understand the fast crystallization behavior of the PP/PMP system, the morphology, and crystalline structures were also confirmed. Figure 7 shows the TEM image of PP and PP/PMP blends. Hereafter the samples were prepared by annealing for 20 s at each temperature using FSC. Rod-like contrasts were observed for all images. The thickness and length of the PP rods decreased with decreasing the crystallization temperature. The thickness of the rod-like structure (attributed to the lamellar thickness in the present study) was estimated as follows: ca. 5 nm (PP, 110°C, 20 s), ca. 4 nm (PP, 70°C, 20 s), ca. 6 nm (PP/PMP, 110°C, 20 s), and ca. 4 nm (PP/PMP, 70°C, 20 s). The domain of PMP (ie, the diameter of more than a few hundred nanometers) can also be seen in Figure 7C,D. The surface between PP and PMP is distinguishable and PP lamellas are oriented randomly from the surface. It seems that the surface-induced crystallization of PP does not proceed in the blend system. Regarding PMP, it is hard to find the rod-like lamellar structure. Instead, nodule-like contrasts are observed in the PMP. In addition, the crystalline lamellas of PP do not exist in the PMP domain. Here, it is confirmed that the domain size and shape of PMP is not influenced by the crystallization temperature. Note, as reported in the previous study,1 the domains of PP and PMP are separated in the molten state and also crystallized separately. Furthermore, PMP crystallized during cooling from the melt even at a cooling rate of 10 000 K s−1. Therefore, the domain size and shape of PMP seems to be formed during cooling from melt to Tiso.
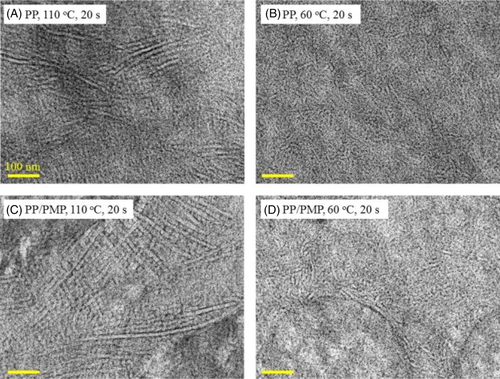
Figure 8 shows the SAXS patterns of PP and PP/PMP blends prepared by using the FSC chip sensor and crystallized at 60°C and 80°C for 20 s. The SAXS patterns of both PP and PP/PMP are in good agreement. Inverse q at scattering peak represents the long period structure. According to the method used in the previous study, both lamellar thickness and amorphous thickness were estimated from the SAXS results.27-29 Figure 9 shows the relationship between the thickness and Tiso; lamellar thickness and amorphous thickness increase gradually as Tiso increases. The amorphous thickness is attributed to be smaller in size than the lamellar layer in the present samples. The lamellar thickness estimated from SAXS is in good agreement with that obtained from TEM (as mentioned in Figure 7). In addition, there are no differences in thickness between the PP homopolymer and PP/PMP blends even at the Tiso between 50°C and 90°C. This result suggests that the crystallization rates are independent of the thickness for both lamellar and amorphous PP systems.
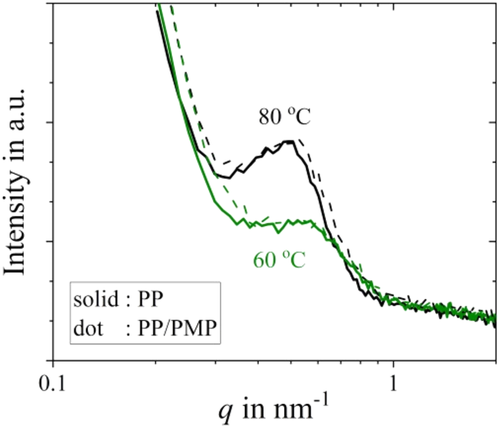
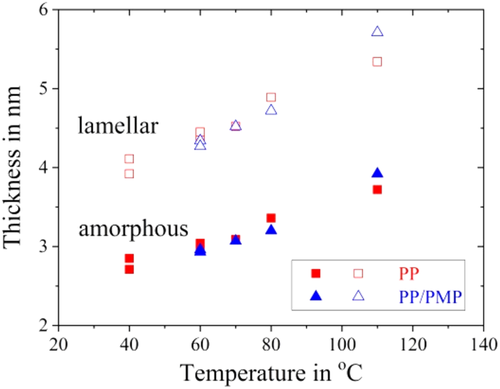
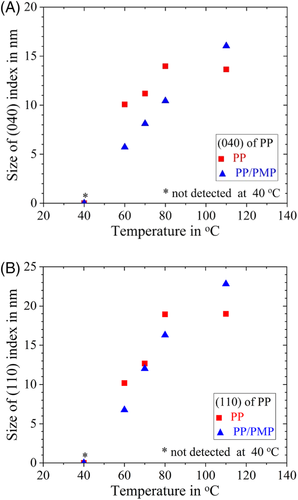
Figure 10 represents the WAXS patterns of PP and PP/PMP blends for both 40°C and 70°C. The peak positions were in good agreement with refs. 30-32 for PP and ref. 33 for the PMP part. Figure 11 shows the relationship between the crystallite size of the (040) and (110) plane of the PP α form and crystallization temperature. The crystallite size of the PP/PMP blends tends to be smaller than homo PP below 80°C and becomes larger at 110°C. The enthalpies of crystallization are in the same order for both PP and PP/PMP blends (see Figure 4). The decrease in crystalline size means that the total amount of crystal increases (ie, the number of nuclei increases). This should be the phenomenal reason for fast crystallization behavior of PP in the blend.
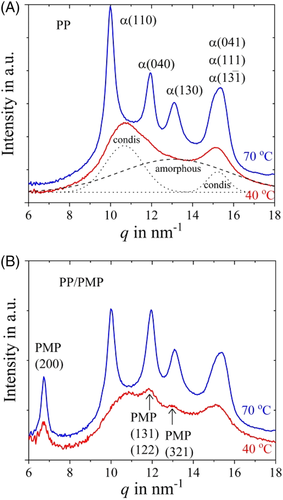
Regarding PP, two peaks at q of ca. 11 nm−1 and 15 nm−1 can be seen for 40°C (Figure 10A). These peaks are attributed to condis crystals.31, 32 In the present study, the WAXS pattern of 40°C in Figure 10A is assumed to result from condis crystals and amorphous polymer. The results of the best peak fitting for the WAXS pattern of condis crystal and amorphous polymer are also shown in Figure 10A.
Figure 12 shows the relationship between the ratio of α form/condis crystal and crystallization temperature. There are no differences in the ratio of α form/condis crystal between PP/PMP blends and PP homopolymer. The ratio of condis crystal increases with decreasing the isothermal crystallization temperature (in other words, the ratio of the α form decreases with temperature). It is reported that condis crystal forms between 10°C and 40°C if the cooling rate from the molten state is 50 to 300 K s−1.1 As expected in the isothermal crystallization process, the formation of condis crystal is confirmed at 40°C for both samples. At 60°C, the crystallinity of the α form and condis crystal shows almost the same value. On the higher temperature, α form becomes the main component. It is known that the condis crystal undergoes an irreversible transition into the α form above 80°C.8 Here, in calculating the ratio of condis crystal and α from WAXS patterns, the peak height ratio between ca. 11 and ca. 15 nm−1 was fixed to separate the contribution of condis crystal from WAXS patterns. The contributions of amorphous and α forms were also separated in the same manner. As for PP/PMP blends (Figure 10 [b]), the peaks at ca. 7, 12, and 13 nm−1 were attributed to the PMP part. Notably, the peaks at ca. 12 and 13 nm−1 of PMP overlapped the WAXS patterns of PP. Therefore, the ratio of peak height between ca. 7 nm−1, 12, and 13 nm−1 was fixed to remove the contribution of PMP from the WAXS pattern computationally.

The results of TEM and SWAXS for PP/PMP blends and PP homopolymer can be shortly summarized as follows: the nano-size morphology, lamellar/amorphous thickness, and the ratio of α form/condis crystal of PP are almost same for both samples. A clear difference can only be seen for the crystallite size, which tends to decrease for the blend systems. These results mean that the amount of PP crystal (both PP α form and PP condis crystal) increases for the PP/PMP blend systems. This behavior might derive from the increment of the crystallization rate in the PP/PMP blends. It is noteworthy that the results of TEM show that the crystallization growth of PP does not start directly from the surface of PMP as a heterogeneous nucleating agent. The PMP might not act as a nucleating agent for PP; however, it acts as a solid spacer changing the surrounding environment of the supercooled liquid state of PP. In other words, strain and/or stress on the surface between supercooled liquid PP and solid-state PMP, which is derived from the difference in the thermal expansion and density, enlarges the Gibbs free energy of the supercooled state PP compared with the homopolymer. The rheological result reported in the previous study also supports this idea.1 For PP/PMP blend systems, the increment in storage modulus can be detected at low frequency in the molten state at 250°C due to the surface friction between the domains of PP and PMP components even in the molten state. Figure 13 shows a schematic description of the free energy diagram. The increase in the crystallization rate of the PP part of PP/PMP blends at 50°C to 90°C can be qualitatively interpreted as follows: the crystallization of PP proceeds from the supercooled liquid state. The difference in Gibbs free energy between the supercooled liquid state and the crystalline state, Δg, is one of the thermodynamic driving forces of crystallization. As a result of the environmental change in the supercooled liquid of the blend system, the Δg becomes larger than that of the PP homopolymer between 50°C and 90°C, quickening the crystallization rate.
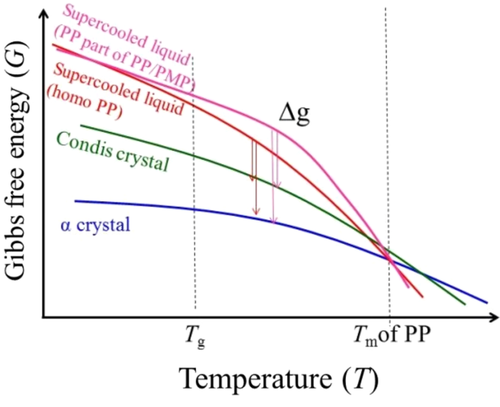
In addition, by taking into account the isothermal crystallization behavior, we can explain the question of ref. 1, which is why the formation of condis crystals of PP is suppressed during quenching (ie, 50-100 K s−1) by adding PMP, as follows: the α form of PP crystallized at higher temperatures (between 50°C and 90°C) than condis crystals during cooling. The difference in the crystallization rate between 50°C and 90°C causes the difference in the crystallinity of the α form. In the case of the PP/PMP blend system, the crystallinity of the α form becomes higher. Then, due to a special limit, the subsequent formation of condis crystal below room temperature is fully or partially suppressed.
4 CONCLUSIONS
The relationship between isothermal crystallization kinetics, morphology, and crystalline structure of PP/PMP blends was investigated by using the techniques of FSC, OM, SWAXS, and TEM. By applying FSC for the sample preparation, not only the thermal properties but also the morphology and crystalline structures were successfully discussed for PP/PMP blends and PP homopolymer crystallized from the highly supercooled liquid.
The crystallization rate of the PP part in the blend system becomes faster than the PP homopolymer at temperatures ranging from 50°C to 90°C. The growth of spherulites cannot be seen in the OM image below 70°C for either sample. In addition, there were no differences in the thickness of the PP lamellar structure and the nanoscale morphology between homopolymer and polymer blends. Also, there was no difference in the ratio of the α form/condis crystal between PP/PMP blends and PP homopolymer. The ratio of condis crystal increases with decreasing the isothermal crystallization temperature. At 60°C, the crystallinity of the α form and condis crystal shows almost the same value. A clear difference can only be seen for the crystallite size, which tends to decrease for the blend system. These results mean that the amount of PP crystal (both PP α form and PP condis crystal) increases for the PP/PMP blend system. This behavior might derive from the increment of the crystallization rate in PP/PMP blends. The increment in crystallization rate can be interpreted by using a Gibbs free energy diagram as follows: the strain and/or stress on the surface between supercooled liquid PP and solid-state PMP, which is derived from the difference in the thermal expansion and density, enlarges the Gibbs free energy of the supercooled state of PP compared with that of homopolymer. As a result, the environmental change in the supercooled liquid increases the difference in Gibbs free energy between the supercooled liquid state and the crystalline state (this corresponds to the crystallization driving force) compared with the PP homopolymer, quickening the crystallization rate of the blends. The reason for suppressing the formation of condis crystals of PP under quenching (ie, 50-100 K s−1) by adding PMP is also interpreted as follows: The difference in crystallization rate between 50°C and 90°C causes a difference in the crystallinity of the α form. As a result, the subsequent formation of condis crystals below room temperature is fully or partially suppressed due to a special limit. Further investigation is needed to clarify the crystallization behaviors of PP/PMP in different blend ratios.
ACKNOWLEDGMENTS
The author thanks Dr Hideaki Takahashi at Toray Research Center Inc. for his encouragement. The synchrotron radiation experiments were performed at the FSBL, BL03XU in SPring-8, Japan (Proposal No. 2018A7214, and 2019B7262). This work was supported by the Photon and Quantum Basic Research Coordinated Development Program of the Ministry of Education, Culture, Sports, Science and Technology, Japan.


