In situ POM and FTIR investigation on quiescent phase transition of polybutene-1 from form II to form I
Funding information: National Natural Science Foundation of China, Grant/Award Number: 21774133
Abstract
Despite extensive investigations in the past decade, the factors affecting the phase transition of polybutene-1 (PB-1) form tetragonal form II to hexagonal form I were not clarified completely. In this study, quiescent phase transitions of PB-1 within different morphological of crystals at different temperatures were investigated employing polarized optical microscopy and Fourier transform infrared spectroscopy. Results indicate that the phase transition depends not only on intercrystalline links but also on the lamellar thickness. The phase transition always occurs spontaneously first in thick form II lamellae. The intercrystalline links have opposite effects in the early and later stages. In the early stage, it can promote form I nucleation in some form II clusters, where these clusters were subjected to inward tensions of intercrystalline links. While in the later stage, it retards form I growth since subjecting to outward tensions of intercrystalline links. This study helps to identify more effective method to accelerate forms II-I phase transition.
1 INTRODUCTION
Owing to special long chain conformation, polymer often forms different crystalline structure under different crystalline condition, and kinetically favored phases will transform to thermodynamically stable phase, for example, orthorhombic-to-hexagonal phase transition of polyethylene,1, 2 mesomorphic-to-monoclinic phase transition of isotactic polypropylene,3, 4 form II-to-form I phase transition of polybutene-1 (PB-1),5-11 disorder-to-order phase transition of poly(l-lactide),12, 13 β-to-α phase transition of poly(butylene adipate),14, 15 and so on. Among these phase transitions, form II-to-form I phase transition is an important kind of phase transition, receiving considerable attention in recent years.16-41 An important reason is that the production of PB-1 was increased greatly in the past decades; however, the constraint of the phase transition on the melt processing has not been well addressed. Unlike other polymers, PB-1 will not form a thermodynamically stable phase directly. It crystallizes first into form II, and then transforms to thermodynamically stable form I slowly and spontaneously, which might require a few days.10, 37 Only after the phase transition, outstanding thermal and mechanical properties of PB-1, that is, higher mechanical strength, better creep resistance, stronger freezing, and heat resistance, can be obtained.42, 43 This affects seriously the manufacture and applications of PB-1 products. Therefore, accelerating phase transition has always been an important aim of many studies.16, 19, 21, 24, 25, 32
Crystal structures of forms I and II were refined recently.5 As shown in Figure 1, form I takes hexagonal packing structure. The unit cell parameters are a = b = 1.753 nm, c = 0.6477 nm, and γ = 120°. A unit cell includes six stems. Form II employs the tetragonal packing structure. The unit cell parameters are a = b = 1.46 nm and c = 2.12 nm. A unit cell includes four stems. Helical stems in form I adopt 31 conformation. The distance parallel to the chain axis per monomer unit is 0.217 nm. Right- and left-handed chains are packed alternately. The average distance between adjacent stems was 0.58 nm. Because of densely packing, crystalline stems and side-chain conformations are completely fixed up to melting points.44 Helical stems in form II adopt 113 conformations. The distance parallel to the chain axis per monomer unit is 0.187 nm. Right- and left-handed chains are also packed alternately. Because of the 113 conformation, side chains seemingly distribute densely around the stem from (see the top view), preventing other stems approaching closer. The average distance between adjacent stems of form I is larger than that of form II, which is 0.73 nm. Because of large spacing, side chains have disordered conformation as well as in the amorphous sample and fast dynamics, as revealed by high-resolution solid-state 13C NMR spectroscopy.45, 46 Therefore, during phase transition, the helical stem needs to be extended, while the distance between adjacent stems needs to be reduced.
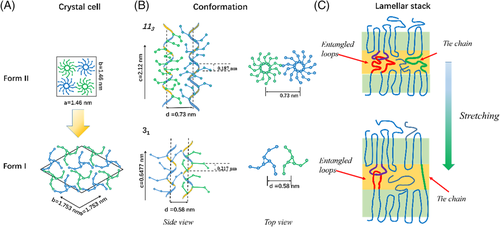
A long time ago, it had been found that stretching could accelerated form II-to-form I phase transition.7-9, 31, 47, 48 By means of optical microscopy and small-angle light scattering, Weynant et al investigated form II to form I phase transition during tension.9 It was found that the phase transition always occurred first in the lamellar stacks which normal direction parallel to the tensile force, which was attributed to the extension of amorphous chains assisting conformational transition, as shown in Figure 1C. The role was assumed mainly by entangled loops and tie chains, which were collectively called as intercrystalline links. Gohil et al assumed that the intercrystalline links played a critical role also in the quiescent phase transition, because they found that even after 1 year form II single crystal did not transform to form I, where no intercrystalline links existed.7
Recently, it was found that stepwise annealing could also promote phase transition effectively.25 After annealing at a lower temperature, form II could transform to form I at a high temperature more rapidly. Annealing at the lower temperature was believed to promote form I nucleation, while annealing at the high temperature facilitated crystal growth.11, 49 The nucleation at the lower temperature was also attributed to intercrystalline links.24 After cooling to a lower temperature, a thermal stress was induced due to different thermal expansion coefficients of amorphous and crystalline PB-1 chains, which promoted conformational change as the tensile force.
Nevertheless, the role of intercrystalline links was questioned recently.17, 21, 22 Qiao et al found that intercrystalline links might retard phase transition in the later stage.21 Low molecular weight and high crystallization temperature always contributed to a greater degree of transition. Even, they found that without annealing at a lower temperature, form II could also transform to form I rapidly in a low molecular weight of PB-1 synthesized by themselves, which chain was too short to form intercrystalline links.22 Moreover, Ma et al found that the stress dominating the phase transition was not the stress parallel to the normal direction of the lamellar stack but the stress perpendicular to the normal direction.17 Seemingly, these findings are completely contrary to the classical view. It needs to reinvestigate the role of intercrystalline links, especially its relationships with crystallization temperature, annealing temperature, growth temperature during quiescent phase transition.
A majority of past works were based on wide-angle X-ray diffraction (WAXD)5, 17, 31, 50 and differential scanning calorimetry (DSC),25, 49 because they can discriminate form I from form II easily. Nevertheless, the information obtained from these tools is normally trivial. To obtain a clear physical image, it needs a great effort to piece out these information. Observing phase transition directly in real space is desirable, which could tell us directly where the phase transition occurs first and how the phase transition propagates. Nevertheless, it is not easy, because only with polarized optical microscopy (POM) it hardly differentiates form I from form II. To differentiate them, it needs to combine other tools, for example, Fourier transformation infrared (FTIR) spectroscopy, which is so-called FTIR microspectroscopic imaging (FTIRI). Employing FTIRI, we observed successfully forms II-I phase transition during quiescence and deformation processes in real space.32, 51 Actually, a normal POM can also undertake such task if equipping a heating device. As is well known, form II has a lower melting point than form I. If observing at a temperature between the melting points of form I and II crystals, only form I crystal will be observed in POM. In this study, we employed a POM equipped with a hot stage to study the influence of annealing temperature on the form I nucleation. As a supplement, FTIR was employed also to monitor phase transition process. Compared to other instruments, FTIR is more suitable to in situ detect quiescent phase transition of PB-1, as it can remain stable work in the long time. In the past works, the measurements for phase transition with WAXD and DSC were often ex situ,21, 25, 37, 40 which was hard to exclude the influence of environment temperature change. This helps to identify nucleation and growth of form I under thermal stress. With FTIR, the influence of phase transition temperature on the growth rate was studied also. It was expected that with this investigation, the role of intercrystalline links could be elucidated.
2 EXPERIMENTAL SECTION
2.1 Materials
The isotactic PB-1 sample employed in this study was purchased from Lyondell Basell Industries, which trade name is PB0110M. The melt flow rate is 0.4 g/10 minutes (190°C/2.16 kg), the weight-average molecular weight Mw is 711 kg/mol, while the dispersity is 3.5.
2.2 Polarized optical microscopy
Crystalline morphologies during isothermal crystallization and heating after forms II-I phase transformation were observed with an Olympus POM equipped with a charge coupled device and a heating device. During in situ POM measurements, a PB-1 film with a thickness of about 50 μm was sandwiched between two SiO2 windows and then fixed to the heating device. During isothermal crystallization, a POM was taken automatically every 5 minutes with self-contained software.
2.3 Fourier transform infrared spectroscopy
Structural changes during isothermal crystallization and phase transition were monitored with a PerkinElmer Spectrum Two FTIR spectrometer equipped with a heating device. During FTIR measurements, the sample was sandwiched between two ZnSe windows, which were then fixed on the heating devices. The IR spectrum in the range of 400 to 4000 cm−1 was collected at the resolution of 4 cm−1. Every 5 minutes, an IR spectrum was collected automatically. The band at 816 cm−1 was employed to monitor the change of form I during phase transition.
3 RESULTS AND DISCUSSION
3.1 Various morphologies formed at high temperature
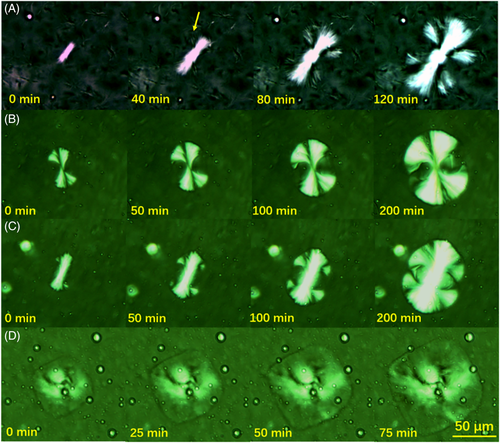
To observe form I nucleation clearly, large form II crystals with sizes of around 100 μm were formed first at a higher crystallization temperature after heating at 180°C for 10 minutes to remove thermal history. A temperature of 103°C was chosen because it was suitable for POM measurements. Various morphologies of spherulites were observed during isothermal crystallization, for example, hexagonal-shape, round-shape, and octagonal-shape spherulites observed in Figure 2A-C. Square-shape hedrites can be also observed, as seen in Figure 2D. The morphological changes during crystallization are unique and interesting. For round-shape spherulite and square-shape hedrites, their shape remains unchanged but their sizes increase constantly. However, for hexagonal-shape spherulite, a columnar crystal is formed first (see Figure 2A). After reaching a length, it starts to branch. Meanwhile, four small fibrillar crystals form on the lateral surface. Obviously, these small crystals form under the help of the columnar crystal. The columnar crystal can be regarded as mother lamellae, while four new crystals as daughter lamellae. Furthermore, if daughter lamellae on the same side of the mother lamellae had enough distance, a small fibrillar crystal forms in between, forming so-called octagonal-shape crystal (see Figure 2C). Among these crystals, hexagonal-shape and round-shape spherulite were dominant.
Actually, these crystals have been reported by Fu52, 53 and Acierno.54 The formation of the hedrites depends not only on the molecular weight but also on the crystallization temperature. The lower the molecular weight and the higher the crystallization temperature, the higher the probability for the formation of the hedrites. Conversely, the probability of the formation of spherulites will be high. An important difference between hedrites and spherulite is that the hedrites have no intercrystalline links but the spherulite has. An important evidence is that the radius of gyration R
g is smaller than or equal to the addition of the lamellar thickness d
c and the half of amorphous thickness  in the hedrites, while
  in the spherulite.24, 52, 53 Imaging easily, if
R
g > 2d
c + d
a, a polymer chain can exist in two adjacent lamellar crystals simultaneously.24 A part of the polymer chain will exist in the amorphous layer between these two lamellar crystals, forming tie chains. Entangled loops with other chains will also exist. With the increases of d
c and d
a, tie chains and entangled loops will decrease. When
  , a chain cannot cross two lamellar crystals again, leading to the disappearance of tie chains. It almost cannot form entangled loops. When
  , the entangled loops will also disappear.24 Qiao et al determined d
c and d
a of PB-1 samples with different molecular weights at various crystallization temperatures using small-angle X-ray scattering (SAXS) and estimated
R
g.24 It was found that for small molecular weight of PB-1,
  can be achieved at a lower temperature; however, for the high molecular weight of PB-1 sample PB0110M, this condition can be satisfied only above 100°C. PB0110M is exactly the sample employed in this study. This could be the reason that a few hedrites can be observed at 103°C.
Another difference of the hedrites from the spherulite is the orientation. With AFM, Fu et al found also that polymer chains in the hedrites were perpendicular to the surface of glass slide, while the polymer chains in spherulites were parallel to the glass surface.52 This point was confirmed recently by Tashiro et al using two-dimensional polarized IR imaging, SAXS and wide-angle X-ray scattering.27, 55
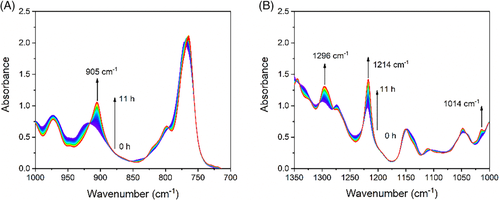
The morphological changes during heating were also recorded. All form II crystals disappeared at 120°C. In hexagonal-shape and octagonal-shape spherulites, the mother lamellae seemingly have a slightly higher thermal stability than the daughter lamellae. The daughter lamellae disappeared at 118°C, while the mother lamellae disappeared at 120°C (see Figure S1). The melting point of 120°C is close to the value reported for form II crystal.24 This implies that only form II was formed, since if form I was formed also some crystals would be found at a higher temperature. To further confirm the formation of the form II crystal, in situ FTIR measurement was carried out during isothermal crystallization at 103°C. Figure 3 shows IR spectra collected every 5 minutes during isothermal crystallization. It took 11 hours for complete crystallization. Three new bands appeared gradually, locating at 905, 1014, and 1296 cm−1, respectively. As is well known,7, 10, 27, 56, 57 the bands at 905 and 923 cm−1 are the characteristic bands of form II and form I, respectively. Only the 905 cm−1 band appeared during isothermal crystallization, meaning that only form II formed. In the following, nucleation of form I within form II crystals will be investigated with form II square-shape hedrites and hexagonal-shape spherulite as representatives.
The formation of form II first could be attributed to fast dynamics of ethyl groups of PB-1. Compared to polyethylene and iPP, PB-1 has a long ethyl group. The ethyl groups have higher mobility in melt, as revealed by solid-state 13C NMR spectroscopy.44-46 It is not hard to image that high mobility of ethyl groups would prevent molecular stems from approaching too close. If two molecular stems stayed close, the ethyl group movement will be restricted significantly, leading to a large decrease of conformational entropy. As is well known, polymer crystallization depends on two factors, melt enthalpy, and conformational entropy. Polymer crystal has a lower enthalpy than melt. During polymer crystallization, the enthalpy decreases, leading to the decrease of Gibbs free energy. Therefore, it always favors polymer crystallization. Conformational entropy decreases also during crystallization due to formation of helices and ordered arrangement of the helices in the crystal. Nevertheless, it leads to the increase of Gibbs free energy, which is unfavorable for polymer crystallization. The ethyl groups have also fast dynamics in form II,45, 46 which will not lead to large decrease of conformational entropy. While ethyl groups in form I are completely fixed up to the melting point, which inevitably results in large loss in conformational entropy. Therefore, PB-1 would like to crystallize into form II first, such that conformational entropy does not need to decrease so much.
3.2 The role of annealing temperatures
In recent years, it was found that low-temperature annealing benefited form I nucleation.25 Wang et al called these low-temperature formed nuclei as latent nuclei, because conventional techniques, such as DSC, WAXD, POM, and FTIR, hardly detected them.49 They only can be inferred indirectly from subsequent nucleation effect. In order to observe these so-called latent nuclei, we increased the preparation temperature of form II crystals. In their experiment, the crystallization temperature was 85°C.49 At the lower temperature, it hardly formed large form II crystallites because of higher nucleation density. Besides, the annealing time was extended from 3 minutes to 1 hour. Although after such a long annealing time they may be not nuclei again, it can infer where the nuclei would like to form. This is what we are interested really. During experiments, we prepared first a large form II spherulite at the isothermal crystallization temperature of 103°C. After identifying a suitable spherulite or hedrites in POM, the temperature was decreased to an annealing temperature and kept for 1 hour. Then, the temperature was increased until the spherulite melted completely.
Figure 4 shows POMs taking during increasing temperature after annealing at various temperatures for 1 hour. For comparison, the spherulites before cooling were also given. Let us see first the case with an annealing temperature of 25°C. The first micrograph in Figure 4A is the spherulite obtained after isothermal crystallization at 103°C. It is a hexagonal-shape spherulite, consisting of a mother crystal and four daughter crystals. The second micrograph was taken after cooling to 25°C. Small crystals surrounding the large spherulite were formed during cooling. After annealing at 25°C for 1 hour, the temperature was increased again. The third micrograph was taken at 112°C. Small crystals surrounding the spherulite disappeared since their melting point was around 110°C. The lower melting point probably is due to smaller lamellar thickness. As is well known, a lower temperature is benefited to the formation of thin folded-chain lamellae. Further increasing temperature, the large spherulite started to melt. Daughter crystals disappeared gradually; nevertheless, mother crystal existed still at 130°C. At such a higher temperature, form II crystal cannot exist. The crystal was most likely form I crystal. From these micrographs, it can be inferred easily that the form I is preferable to nucleate in the mother lamellar crystals, or said, thick radial lamellar crystals.
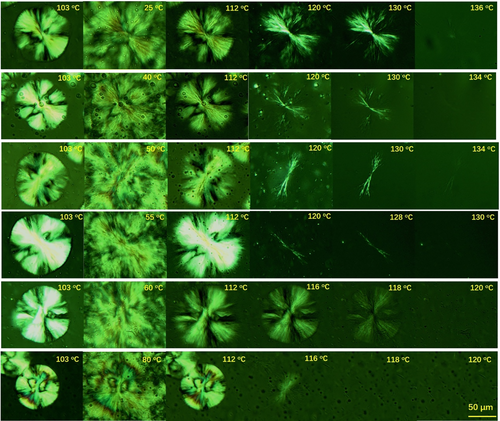
If observing more carefully, we have another finding. Compared to form II spherulite in the first graph, the form I spherulite at 120°C and 130°C seems to be composed of numerous fibrillar crystals, similar as the finding in the study of Jiang.38 These fibrillar crystals can be seen more clearly at higher annealing temperatures (40°C, 50°C, and 55°C). The formation of fibrillar crystals should be resulted from thermal stress induced by difference in thermal expansion coefficients. The lower the annealing temperature, the bigger the thermal stress and the more the form I fibrillar crystals. In previous FTIRI studies,27, 32 it was found that form I crystals were easier to form at the edge of big spherulite, which was attributed to larger internal stress induced by big spherulite and small crystals around it. Actually, this could be due to unique crystallization behavior of PB-1. As seen in Figure 2, with the growth of the mother crystal, the lateral size increases constantly due to branching.58 During sequent annealing, more form I nuclei will be formed at the edge of the spherulite. Therefore, they are more easily found by FTIRI. There did not exist a lag in phase transition between the center and the edge of spherulite. In all of our experiments, form I crystals were observed simultaneously in the center and at the edge of the spherulite.
With the increase of the annealing temperature, the number of fibrillar crystals decreases constantly. At the annealing temperature of 25°C, numerous fibrillar crystals can be observed. However, after increasing the annealing temperature to 55°C, only a few fibrillar crystals can be observed. At 60°C or higher, all crystals melt at 120°C. This means that form I hardly nucleates at such high annealing temperatures. This finding is consistent with previous report by Wang, where form I nuclei were found only below 60°C.49 This indicates that form I nucleation is temperature dependence.
In Figure 4, all spherulites investigated are hexagonal-shape spherulites, because they are seen commonly at 103°C. We also observed nucleation in other types of crystals. Bright fibrillar crystals can be seen also in other types of spherulites but hardly seen in the hedrites. To show this point, we chose purposely a square-shape hedrites and a round-shape spherulite, which stayed close in a PB-1 sample. Although they were annealed simultaneously at 25°C for 1 hour, fibrillar crystals only can be seen clearly in the round-shape spherulite (see Figure 5). In the hedrites, fibrillar crystals were very weak. Compared to spherulite, the most important difference of the hedrites from spherulite is that no intercrystalline links exist.24, 52-54 This implies that intercrystalline links play an important role in promoting form I nucleation.

With above POM investigations, some conclusions can be obtained: (1) form I would like to nucleate first in thick radial lamellar crystals, leading to the formation of fibrillar crystals and (2) form I nucleation rate depends strongly on the annealing temperature. Only below 60°C, fibrillar crystals can be formed in a short time. (3) Intercrystalline links play an important role in promoting form I nucleation.
Despite having above findings, we have many things unclear. First, when do the fibrillar crystals form, on cooling, during annealing or on heating? Second, is the formation of fibrillar crystals immediate or time-consuming? Third, Can form I nucleate also in thin form II lamellar crystals also? In the following sections, we will answer these questions one by one.
To answer the first question, POM obviously cannot undertake such task, since it is hard to identify form I before melting of form II. To observe form I nucleation, in situ FTIR measurement was employed. Wang et al employed FTIR also to investigate form I nucleation.49 No characteristic peak of form I appeared during cooling. What was observed only was a constant increase of the band at 905 cm−1, meaning that cooling only led to the formation of more kinetically favored form II crystals. Similar finding was found in our study (not shown here). Therefore, we directly show IR spectra collected during the annealing process.
Figure 6 shows IR spectra collected every 5 minutes during annealing at 25°C. During annealing, the bands at the 816, 850, 923, 1026, 1060, 1100, 1208, and 1329 cm−1 increase constantly. In contrast, the bands at 905, 1014, 1112, 1150, 1214, and 1296 cm−1 decrease continuously. As mentioned above, the band at 923 cm−1 is the characteristic band of form I crystal, while the band at 905 cm−1 is the characteristic band of form II crystal. The increase of the band at 923 cm−1 in the price of the band at 905 cm−1 means that form II transforms ceaselessly to form I during annealing process.
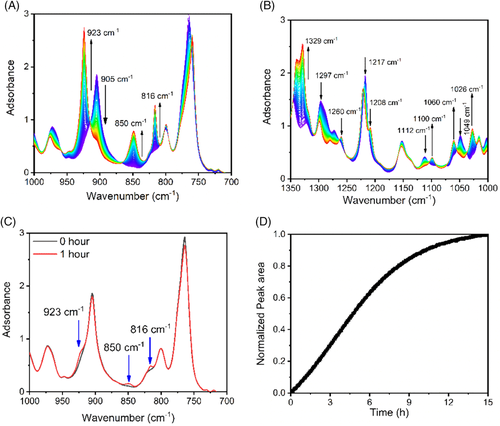
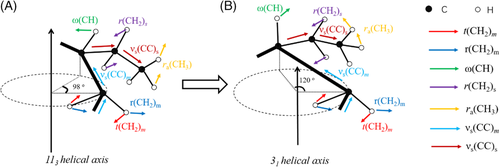
IR bands of PB-1 have been assigned successfully.56, 57, 59 For example, both bands at 905 and 923 cm−1 were assigned to the coupling of the CH2 rocking mode in the main chain r(CH2) m with the CH3 rocking mode in the ethyl group ra′(CH3). The band at 816 cm−1 was assigned to coupling vibration of the CH2 rocking mode in the main chain r(CH2) m and the CC stretching mode in the ethyl group νs(CC) s; the band at 850 cm−1 was from the coupling of the CH3 rocking mode in the ethyl group ra′(CH3) and the CC stretching mode in the main chain νs(CC) m, while the band at 1208 cm−1 was due to the coupling of the CH2 twisting t(CH2) m and the CH wagging modes in the main chain ω(CH). To differentiate CH2 and CC groups in the main chain and the ethyl group, the subscripts m and s were added, which represent the groups in the main chain and the ethyl group, respectively. Vibrations of the CH3 and CH groups were not noted with the subscripts because they only exist in the ethyl group and main chain, respectively.
From above assignments, it can be found that all of characteristic bands are from couplings of the vibrations in the main chain and the ethyl group. Their intensities depend on spatial relationship of the main chain and the ethyl group or said helical conformation. When the helical conformation changes from 113 to 31, characteristic bands will change also, for example, transition from the 905 cm−1 band to 923 cm−1 band, as shown in Figure 7.
IR spectra collected at t = 0 and 1 hour are given in Figure 6C. Characteristic bands of form I at 816, 850, and 923 cm−1 are absent at t = 0 hour; however, they can be seen clearly at t = 1 hour. This indicates that form I indeed can nucleate at the annealing temperature of 25°C. In the study of Wang group, the annealing time was only 3 minutes.49 In such a short time, it hardly formed enough form I nuclei to be detected by FTIR or WAXD.
The change of form I crystal during annealing at 25°C was monitored with the band at 816 cm−1. The band at 923 cm−1 was not employed because it overlapped seriously with the band at 905 cm−1. The band at 816 cm−1 is also sensitive to form I nucleation, which can be also regarded as the characteristic band of from I.56 From the beginning, the peak area at 816 cm−1 increased (see Figure 5D). No induction time was observed, indicating that the phase transition is spontaneous.
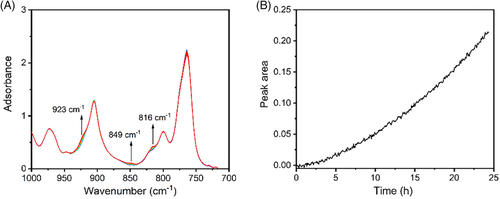
The phase transition at the annealing temperature of 60°C was also monitored with FTIR. Unlike at 25°C, phase transition at 60°C was very slow. After 24 hours, only a trace of form I was formed (see Figure 8A). The slow phase transition only led to a tiny form I crystal after 1 hour, which probably was the reason that form I was not observed in POM measurements. We monitored also the change of form I with the peak at 816 cm−1. Similar as that at 25°C, the peak area at 816 cm−1 increased from the beginning (see Figure 8B). No induction time was observed. This indicates again that the phase transition is spontaneous. And form I nucleation depends strongly on the annealing temperature.
Above FTIR results actually implies also that the formation of form I fibrillar crystals is time-consuming. To see the evolution process of form I fibrillar crystals, we returned to POM. Figure 9 shows crystalline morphologies taking during increasing temperature after annealing at 25°C for 15 minutes or 12 hours. When a large spherulite formed at 103°C was annealed for 15 minutes, only a few fibrillar crystals were observed at 128°C. However, when the annealing time was extended to 12 hours, thousands of fibrillar crystals were found at the temperature. This means that the formation of fibrillar crystals was not immediate.

3.3 The role of crystallization temperatures
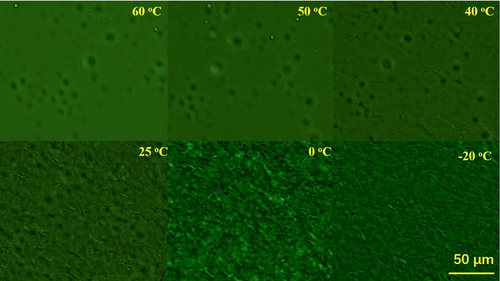
In Figures 4 and 5, form I nucleates only in the large spherulite. No form I fibrillar crystals can be seen around the spherulite. Around the spherulite, only thin form II lamellar crystals formed since these crystals formed during cooling. Will these thin lamellar crystal accommodate form I nuclei? This could be a more important question, since most of PB-1 pipes form at a lower temperature in real processing. To clarify such question, form I nucleation in a lower temperature crystallized form II sample was investigated also with POM. The temperature of 90°C was selected as the crystallization temperature. At such a temperature, the nucleation density was too high to identify single form II spherulite, and crystallization completed within 20 minutes. Figure 10 shows micrographs at 128°C after annealing at various temperatures for 1 hour. Different from large spherulite formed at 103°C, only below the annealing temperature of 40°C, fibrillar crystals formed. And only below 0°C, a great number of clear fibrillar crystals were observed. This means that the lower the crystallization temperature, the harder the form I nucleation. Or said, the thinner the lamellar crystal, the harder the form I nucleation, which is also seen in Figure 9.
The change of form I during the phase transition of the 90°C crystallized sample at 25°C was also monitored with FTIR. Figure 11 shows the change of peak area at 816 cm−1 during phase transition. For comparison, the change of peak area at 816 cm−1 in the 103°C crystallized sample was also plotted. The transition in the lower temperature crystallized sample is much slower than that in the higher temperature crystallized sample, as reported by Azzurri et al.40 The half time of transition for the 103°C crystallized sample is 4.75 hours, while 6.32 hours for the 90°C crystallized sample. The higher transition rate in the higher temperature crystallized sample can be attributed to the higher nucleation density, deducing from Figures 4 and 10.

3.4 The role of growth temperatures
As mentioned above, except the crystallization temperature and the annealing temperature, there exists also a temperature affecting the phase transition, that is, the growth temperature. Actually, Men et al had investigated the transformation rate dependence on the growth temperature.25 In their study, standard form II samples were annealed first at various temperatures for same time and then subjected to increasing temperature. From melting peaks in DSC, the transformation rates at various annealing temperatures were inferred. Such indirect method is rigorous but time-consuming. To determine a transformation rate at one temperature, it needed at least 4 hours. Here we employed a fast and direct method. After isothermal crystallized sample was annealed 25°C for a time, the temperature was increased by 5°C every 5 minutes. Before every increasing temperature, an IR spectrum was collected. The increased peak area at 816 cm−1 within 5 minutes was regarded as the increased form I at the temperature. Specifically, we collected an IR spectrum at 25°C. After 5 minutes, another spectrum was collected at the temperature. Immediately after the collection, the temperature was increased immediately to 30°C. At t = 10 minutes, an IR spectrum was collected again and then the temperature was increased to 35°C. The times of every increasing temperature and collection of FTIR are short, normally just a few seconds, which can be omitted. The difference between the first and the second spectra at 816 cm−1 is increased form I at 25°C, while the difference between the second and the third spectra is increased form I at 30°C. In such way, it can obtain transformation rates between 25 and 80°C in an hour.
Figure 12A shows IR spectra collected during increasing temperature after annealing at 25°C for 3 hours for a form II sample formed at 103°C. The difference between adjacent spectra increases first and then decreases. The difference between 35°C and 40°C is the maximum, meaning the maximum transformation rate at 40°C, as found by Men and coworkers.25 To see the transformation rate dependence on the temperature more clearly, the difference in peak area between adjacent spectra was plotted in Figure 12B. Indeed, the transformation rate increases first and then decreases. At 40°C, it obtains the greatest transformation rate. Above 75°C, it becomes zero. The temperature of 75°C should be the highest growth temperature for form I. The inhibition of the phase transition at higher temperature could be attributed to fast dynamics of ethyl groups. With NMR, Miyoshi et al found that at 100°C, side chains in form II vibrated in extremely high frequency.46 Imaging easily, fast vibration will prevent one stem from approaching another stem to form I nucleus or crystal.
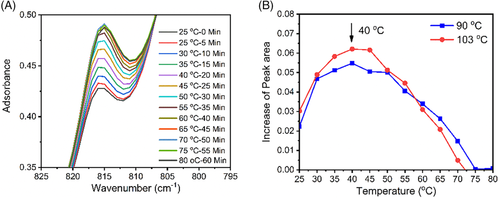
Transformation rates in the 90°C crystallized sample were also determined. Similar as the finding in the 103°C crystallized sample, the transformation rate increases first and then decreases. At 40°C, it reaches the greatest transformation rate, and at 75°C, the transformation rate becomes zero (also see Figure 12B).
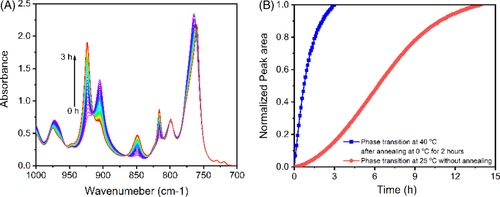
One probably questions the rigorousness of the method. Even at a constant temperature, crystallization rate changes. Polymer crystallizes first slowly, then rapidly and finally slowly again.60 The first slow crystallization is due to nucleation, while the second slow crystallization is due to secondary crystallization. In this study, the transformation rate was determined after annealing for 3 hours. As seen in Figure 6D, the transformation rate has entered the linear region after 3 hours in both samples. It would not enter the later stage because the measurement time was only 1 hour. Therefore, it does not need to worry about the rigorousness of the method.
After identifying the best temperatures for nucleation and growth of form I, it could obtain faster phase transition. As seen in Figure 10, higher nucleation density can be seen at 0°C, while from Figure 12B, the maximum growth rate locates at 40°C. If annealing first at 0°C and then at 40°C, it could obtain faster phase transition. Figure 13A shows IR spectra collected during phase transition at 40°C after annealing at 0°C for 3 hours. Form II can phase transit to form I rapidly. Within 3 hours, the phase transition has finished. It is much faster than that at 25°C without annealing. The half time of the phase transition is reduced from 6.25 to 0.68 hour (see Figure 13B). It is only one-ninth of previous one if not counting the annealing time.
4 DISCUSSIONS
From above results, it can be found that the form II-to-form I phase transition depends strongly on crystallization temperature, annealing/nucleation temperature and growth temperature. It depends also on intercrystalline links. What is the role of intercrystalline links and its relationship with the crystallization temperature, the annealing/nucleation temperature and the growth temperature?
 (1)
(1) (2)
(2)The first term is the change of melt enthalpy from form II to form I. The melt enthalpy of form I crystals is more than twice of that of form II crystals,25 Therefore, the change of melt enthalpy always favors form II to form I phase transition below the melting point of form II. The second term is the change of conformational entropy, which increases with the annealing temperature T. Conformational transition from form II to form I leads to further decrease of conformation entropy, which does not favor the phase transition.44-46 At a temperature, the change of melt enthalpy counteracts exactly the change of conformation entropy. We can regard this temperature as the highest temperature for form I nucleation. Decreasing annealing temperature results in the increase of ΔgII → I (see Equation (2)), while the increase of ΔgII → I increases ΔGII → I as well as the increase of lamellar thickness. Therefore, the thicker the lamellar thickness, the higher the nucleation rate; the lower the annealing temperature, the higher the nucleation rate, provided that the diffusion ability of the stem was not affected significantly. Unlike normal nucleation from polymer melt, the form I nucleation does not deal with the change of surface area. It does not overcome the nucleation barrier due to the increase of surface area; therefore, the phase transition from form II to form I is spontaneous.
 (3)
(3)Here, F is the stress, ∆l is the displacement under the force, while S is the surface area perpendicular to the displacement.
Two kinds of stresses may play the role. The first stress is the stress parallel to the helical stem, while the displacement is the increased helical length because of transition from 113 to 31 helix. The second stress is the stress perpendicular to the helical stem, while the displacement is lateral shrinkage due to form II-form I phase transition.
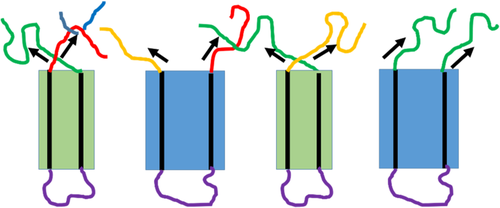
During quiescent phase transition, these two kinds of forces may exist simultaneously, because the thermal stress induced by different expansion coefficients of amorphous and crystalline polymer is highly an inclined force, having a stress component perpendicular to the helical stem and a stress perpendicular to the helical stem, as shown in Figure 14.
Previously, it was assumed that the force should be the stress parallel to the stem, which can assist conformational transition from 113 to 31 helices.7, 9, 61 However, recent investigation seems to support the latter one. It was found that the stress dominating the phase transition is the stress perpendicular to the helical stem.17
Which stress should be responsible mainly for the phase transition? The phase transition dynamics may provide a clue. If the stress parallel to the stem dominated the phase transition, only one phase transition model exists since its role remains unchanged throughout the phase transition, that is, promoting conformational transition from 113 to 31 helices. However, if the latter stress was dominated, there may exist many modes since its role may change. With folded-chain cluster as research objects, let us see their stress conditions. Recently, Miyoshi et al found with 13C-13C double-quantum NMR that a chain existed mainly in the form of folded-chain cluster in PB-1 crystals.62-64 These clusters included two or three stems,64 which can be regarded as a crystal embryos. These crystal embryos may be in different states due to different stress conditions, as seen in Figure 14. In the first case, stems in a crystal embryo are also drawn closer due to inward tensions. The stress does work for the crystal embryo; therefore, nucleation is easier in the crystal embryo. In the second case, stems in a crystal embryo are pulled away due to outward tensions or same direction of stresses. The crystal embryo does work for the surrounding; nucleation is hard in the crystal embryo. Therefore, when a form II lamellar crystal was subjected to thermal stress after cooling, some folded-chain clusters can transform to form I crystal embryos quickly, while other clusters need a long time to nucleate, which leads to two modes.
 (4)
(4)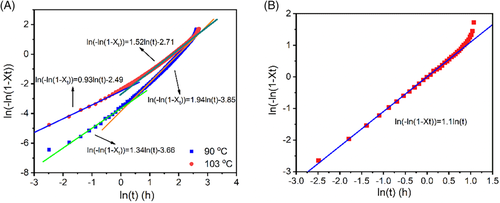
Identifying the dominating factor, Avrami indices can be understood straightforwardly. When a crystallizing sample was quenched a lower temperature for phase transition, some clusters is easier to transform to form I crystal embryos due to inward tensions. Nucleation is dominated in this stage, leading to Avrami indices close to 1. After these clusters exhaust, nucleation becomes hard. Nucleation and one-dimensional growth control the phase transition simultaneously, leading to Avrami indices close to 2. Nevertheless, if the crystallized sample was fully nucleated fully at a lower temperature before phase transition, its Avrami index will become one because only one-dimensional growth dominates the phase transition, as seen in Figure 15B.
Therefore, the stress perpendicular to the helical stem should be responsible mainly for the phase transition. Its role is to overcome the resistance from fast dynamics of ethyl groups, which is a significant feature of PB-1.44-46 The intercrystalline links likes a double-edged sword. In the early stage, it promotes form I nucleation; however, it becomes a retardance factor in the later stage. It is not as claimed either by classical view that the intercrystalline links always promoted form I nucleation or by recent view that the intercrystalline links only stabilize the metastable form II.22
 (5)
(5)The unfavorable stress restricts the diffusion of the helical stem. After releasing the unfavorable stress, the stems are easier to cross the interface to join a new lattice; therefore, a higher phase transition rate can be seen. Nevertheless, this does not mean that the higher the temperature, the faster the growth. At a higher temperature, ∆E may become smaller because of higher conformational entropy (see Equation (2)), reducing the growth rate.
5 CONCLUSIONS
To summarize, with POM and FTIR, it was found that the form II to form I phase transition depends on crystallization temperature, annealing/nucleation temperature, and growth temperature. The factors behind these temperatures are lamellar thickness and intercrystalline links. The thicker the lamellar thickness, the easier the form I nucleation. Unlike the lamellar thickness, the intercrystalline links have two opposite effects. In the initial stage, nucleation is easier as some folded-chain clusters subjected to inward tensions of intercrystalline links. However, after these clusters exhaust, nucleation becomes hard. Nucleation and growth of form I dominate the phase transition simultaneously. The intercrystalline links like a double-edged sword. It promotes form I nucleation in the initial stage, but retards growth in the later stage. Releasing unfavorable stress could accelerate the growth. The main role of intercrystalline links is not to assist conformational transition but to overcome the resistance from fast dynamics of the ethyl groups during phase transition.
ACKNOWLEDGMENT
This work was financially supported by National Natural Science Foundation of China (21774133).
CONFLICT OF INTEREST
The authors declare no potential conflict of interest.


