Assessing factors related to Walleye stocking success in the Midwestern United States
Abstract
Objective
The objective of this study was to evaluate stocking success of Walleye Sander vitreus in lakes and reservoirs across the Midwestern United States to inform stocking practices for state agencies. Demand for Walleye stocking may increase if climate change limits the potential for natural recruitment in lakes. Consequently, the strategic distribution of Walleye stocking may maximize fishing opportunities.
Methods
We synthesized data from 2226 Walleye fry and fingerling stocking events on 653 lakes in the Midwestern United States and used random forest algorithms and mixed-effects linear models to identify abiotic and biotic factors related to Walleye stocking success.
Result
Latitude and year explained relatively little variation in stocking success compared to within-lake variation. Relative abundance of Largemouth Bass Micropterus nigricans was an important indicator of Walleye stocking success for fry and fingerlings, with stocking success generally decreasing with increased bass abundance. There was an interaction between lake surface area and growing degree-days, as large lakes (>2500 ha) seemed to be more conducive to Walleye stocking success regardless of growing degree-days. The models that we developed did not accurately predict exact levels of Walleye stocking success but were 92–94% accurate in predicting whether the stocking success of both fry and fingerlings would be at or above the 50th percentile.
Conclusion
These findings may help to inform the management and stocking allocation of Walleye and suggest that future increases in Largemouth Bass abundance and growing degree-days could limit the effectiveness of stocking in some lakes.
INTRODUCTION
Stocking is an important tool that has been used to support fisheries in North America since the 19th century (Claussen and Philipp 2022). Depleted or extirpated fish stocks have been restored with the aid of stocking (Schram et al. 1999; Trushenski et al. 2010; Newhard et al. 2021); in many cases, stocking is used to supplement existing fisheries that cannot be supported via natural recruitment (Kapuscinski et al. 2007; Piccolo et al. 2012) or to create new fisheries that are maintained solely through stocking (e.g., Halverson 2008; Melstrom and Lupi 2013; Raabe et al. 2020). The propagation and stocking of fish are labor and resource intensive (e.g., Johnson et al. 1995; Hunt et al. 2017), with many state agencies spending substantial portions of their budgets on the stocking process. Hence, there are limits to using stocking as a management tool. Additionally, there may be diminishing returns from stocking if environmental changes result in ecosystems that are less favorable for the species being stocked. Despite these limitations, pragmatic allocation of stocked fish could be used to meet constituent's expectations (Feiner et al. 2022), provide angling opportunities across the landscape, and enhance fishing opportunities at locations that are suitable for species being stocked.
Walleye Sander vitreus support important harvest-oriented recreational fisheries across North America, and many of these fisheries are supported by stocking (Kerr 2011). In portions of the upper Midwestern United States, especially in Wisconsin and Minnesota, some populations of Walleye are supported entirely through natural reproduction (Rypel et al. 2018; Mahlum et al. 2023). Generally, these populations occur in relatively large lakes or river systems (Bozek et al. 2011). Conversely, many Walleye fisheries in the Midwestern United States are maintained by some level of stocking—ranging from fisheries that are completely maintained by stocking (Kerr 2011) to those where stocking is used to supplement natural reproduction (Rypel et al. 2018). In terms of total numbers of fish, Walleye are the second most stocked fish in the United States behind Rainbow Trout Oncorhynchus mykiss (U.S. Department of Agriculture 2018). Historically, Walleye fry were primarily used for stocking due to the low cost of propagation (Parsons and Pereira 2001), but many states have transitioned to either fingerlings that are stocked in the spring to early summer or advanced fingerlings that tend to be stocked in the late summer or early fall (Kerr 2011). Fingerling stocking requires more resources for propagation but can result in higher survival (e.g., Fielder 1992; Brooks et al. 2002).
As a coolwater species, the Walleye is vulnerable to ecosystem-level changes across the Midwest due to climate change (Hansen et al. 2017, 2018). In particular, natural recruitment of Walleye has declined in the upper Midwest over the past several decades, and continued declines are anticipated (Rypel et al. 2018). Recent evidence in northern Wisconsin (Lawson et al. 2022) also suggests that stockings of Walleye fingerlings are more frequently resulting in diminishing returns. Stocking success may be reduced by negative synergistic effects between climate-driven limnological changes in lakes (Maberly et al. 2020; Jane et al. 2021) and shifts to centrarchid-dominated fish communities, which may have negative associations with Walleye recruitment and stocking success (Hansen et al. 2017). For example, Hansen et al. (2018) found a reduced probability of Walleye recruitment in Wisconsin lakes with relatively high densities of Largemouth Bass Micropterus nigricans and Broda et al. (2022) showed that the relative abundance of Black Crappie Pomoxis nigromaculatus had a threshold effect on Walleye recruitment, such that recruitment was always low when Black Crappie relative abundance was high. Studies in Wisconsin and Illinois have directly linked stocking outcomes to Largemouth Bass abundance, showing that bass can prey on stocked Walleye fingerlings (Fayram et al. 2005; Freedman et al. 2012). Given the cultural and economic significance of Walleye, adaptive and resistance-based strategies are being explored to maintain Walleye fisheries across the Midwestern landscape (Dassow et al. 2022; Feiner et al. 2022), and stocking is likely to play a significant role in these efforts. However, factors regulating Walleye stocking success either have not been well defined or have been defined at relatively small spatial scales (e.g., Brooks et al. 2002; Lucchesi 2002; Lawson et al. 2022; Bopp et al. 2023), and these factors could influence the effectiveness of stocking as a future management tool.
Walleye stocking success has been related to a variety of biological and environmental factors in system- and regional-level stocking evaluations. An early evaluation of Walleye stocking success in North America suggested that water chemistry and lake surface area were important in determining the likelihood that Walleye stockings would be successful, with pH being an indicative index of water quality for Walleye (Bennett and McArthur 1990). Lakes in northern Wisconsin that were relatively warm had lower survival of stocked Walleye on average (Lawson et al. 2022). Although Largemouth Bass may consume stocked Walleye (Fayram et al. 2005; Freedman et al. 2012), bass abundance may not be important in determining stocking success, as was the case in Illinois reservoirs (Freedman et al. 2012). Lake productivity (Fielder 1992) and prey availability (Santucci and Wahl 1993) may also influence Walleye stocking success.
The size of Walleye at stocking has also been shown to influence stocking success but not in a uniform manner. In Illinois reservoirs, stocked fingerlings survived at a higher rate and were more cost-efficient than stocked fry (Brooks et al. 2002), suggesting that stocking at later life stages may provide a greater return on investment. However, a case study in six New York lakes found that large, fall-stocked fingerlings were less fit and survived at lower rates than small fingerlings (Olson et al. 2000). A case study of four Minnesota lakes reported that the stocking of Walleye fry was as effective as stocking fingerlings but cost less (Parsons and Pereira 2001). Contributing to this disparity, hatchery-reared fingerlings may struggle with adapting to natural environments. In East and West Okoboji lakes in Iowa, hatchery-reared Walleye that were released as fry consumed better quality prey more often than Walleye that were released as fingerlings (Grausgruber and Weber 2021).
Collectively, previous evaluations have suggested that Walleye stocking success is regulated by a complex set of environmental, limnological, and biological attributes of lakes where Walleye are stocked, but most of these evaluations were conducted on single lakes or on a few lakes in close geographic proximity (e.g., Parsons and Pereira 2001; Brooks et al. 2002). The last regional comprehensive review of Walleye stocking success was provided by Laarman (1978) but largely focused on fry stocking. Furthermore, Laarman (1978) did not provide a formal analysis of factors influencing stocking success, which was generally low (<50% success rate for both introductory and maintenance stockings; <10% for supplemental stockings). Hence, a regionwide assessment of the factors that may explain variability in stocking success does not exist for the Midwest. Given the cultural and economic importance of Walleye fisheries in this region (Tufts et al. 2015; Mrnak et al. 2018) and the fact that more Walleye are stocked in this region than in other parts of North America (Kerr 2011), evaluating the factors related to successful Walleye stockings could improve the Walleye fishery, especially given that (1) the supply of Walleye for stocking may be limited in many states and (2) increases in demand are likely to occur. Within the resist–adapt–direct (RAD) framework, stocking is generally considered a “resist” strategy for fisheries (Feiner et al. 2022). Within the context of Walleye in the Midwest, identifying cases in which resist-based strategies may or may not be effective could benefit the Walleye management process. Therefore, the objective of this study was to determine factors that are related to Walleye stocking success in the Midwestern United States by using state agency data from Walleye stocking assessments and fish community monitoring. Secondarily, we examined whether temporal patterns in Walleye stocking success were occurring within individual states and determined whether within-state latitudinal trends were present (e.g., whether stocking success was simply higher in the northernmost lakes within a state).
METHODS
Walleye data compilation
Walleye stocking information and associated fisheries assessment data were acquired from state natural resource agencies across the Midwestern United States (Davis and Isermann 2024). Data acquisition and availability were first discussed with state representatives that comprise the Walleye Technical Committee, which is part of the North Central Division of the American Fisheries Society. This discussion was followed by sending a formal data inquiry to each state. All available records for stocking events occurring between 1990 and 2019 were requested, which aligned with climatological data availability. For Walleye stocking events, we obtained the stocking date, total length (TL) at stocking, and number of fish stocked. Walleye stockings were classified as fry, small fingerling, or large fingerling, with a TL cutoff of 101.6 mm (4 in) used to differentiate between small and large fingerlings. Cases in which multiple sizes of fish were stocked into a single lake during a single year were excluded from analysis. For cases in which multiple stockings of the same size-class occurred for a lake within a single year, the numbers of fish stocked were pooled as a single observation for that lake–year combination (hereafter, “lake-year”). Walleye stocking density (fish/ha) was calculated as the total number of Walleye stocked divided by the lake surface area.
Walleye recruitment codes provided by state agencies were utilized to designate whether any natural reproduction occurred in lakes within Minnesota, Wisconsin, South Dakota, and Michigan. In other states, where data were available on natural recruitment via oxytetracycline (OTC) marking of stocked fish, lake-years with over 33% of the cohort designated as unmarked were considered “mixed,” while lakes with less than 33% of the cohort unmarked were considered to not have significant contributions from natural recruitment. In lakes without OTC data or state agency codes to describe natural recruitment, we assumed that there was no contribution of natural recruitment to Walleye cohorts. Subsequently, lake-years in this study were classified as having “mixed” recruitment or no natural recruitment.
Stocking success was quantified using catch per effort (CPE) estimated from sampling that occurred after specific stocking events. Methods that were used to survey Walleye populations after stocking varied among states (summarized in Table 1); consequently, units of effort that were associated with age-specific CPEs used to measure stocking success also varied. Except for Wisconsin and Illinois, age-specific CPEs were directly provided by state agencies (i.e., we did not calculate them). For Wisconsin, we calculated age-1 Walleye CPE (fish/mile) in fall electrofishing surveys to assess fingerling Walleye stocking success from the previous year (Lawson et al. 2022). The number of fish identified as age 1 was estimated by creating regional age–TL keys for northern Wisconsin and southern Wisconsin lakes, with 45° N being used as a boundary (approximately the southernmost extent of the Ceded Territory in Wisconsin). Fall electrofishing surveys conducted from 1990 to 2019 were used to obtain data for the age–TL keys, and ages were assigned using the FSA package in R (Ogle et al. 2022), with a procedure described by Isermann and Knight (2005) whereby individuals in a given length bin were assigned ages based on the proportion of observed ages in the length bin. The bin width used for this analysis was 12.7 mm TL (0.5 in TL). For Illinois, the CPE of age-0 Walleye in late-summer and fall electrofishing surveys was calculated by assuming that all Walleye smaller than 235 mm TL were age 0. This TL boundary represented the approximate upper quartile of age-0 Walleye lengths from fish sampled in Illinois lakes (Stein and King 2022). Because of differences in sampling methods used among states, Walleye CPEs used as measures of stocking success were converted into state-specific percentile ranks for fingerling stockings and fry stockings to create a response variable that had an equivalent scale across states. Hence, relatively high percentile-ranked CPEs (e.g., >0.75) were indicative of high stocking success within a specific state, and relatively low percentile ranks (e.g., <0.25) represented relatively low stocking success within that state.
| State | Years | Lakes (n) | Lake-years (n) | Size at stocking | Life stage at evaluation | WAE sampling gear | WAE CPE metric | LMB sampling gear | LMB CPE metric |
|---|---|---|---|---|---|---|---|---|---|
| Illinois | 2012–2019 | 8 | 24 | SF | Age 0 | Electrofishing | Catch/h | Electrofishing | Catch/h |
| Iowa | 2008–2015 | 8 | 25 | FRY, SF, LF | Adult | Electrofishing | Catch/h | Electrofishing | Catch/h |
| Michigan | 2002–2018 | 43 | 44 | FRY, SF | Age 1 | Fyke nets | Catch/net-night | Trap nets | Catch/net-night |
| Minnesota | 2005–2013 | 242 | 336 | FRY, SF, LF | Age 1 | Gill nets | Catch/net-night | Gill nets | Catch/net-night |
| Minnesota | 2005–2013 | 242 | 336 | FRY, SF, LF | Age 0a | Electrofishing | Catch/h | Gill nets | Catch/net-night |
| Nebraska | 1993–2019 | 12 | 208 | FRY, LF | Age 1 | Gill nets | Catch/net-night | Electrofishing | Catch/h |
| North Dakota | 1990–2019 | 89 | 966 | FRY, SF | Age 0 | Gill nets | Catch/net-night | Electrofishing | Catch/h |
| Ohio | 1990–2019 | 22 | 116 | FRY, SF | Age 0 | Electrofishing | Catch/h | Electrofishing | Catch/h |
| South Dakota | 1998–2018 | 27 | 160 | FRY, SF, LF | Age 2 | Gill nets | Catch/net-night | Electrofishing | Catch/h |
| Wisconsin | 1994–2018 | 164 | 383 | FRY, SF, LF | Age 1 | Electrofishing | Catch/mile | Electrofishing | Catch/mile |
- a Fry stockings were evaluated at age 0, while fingerling stockings were evaluated at age 1.
Predictors of stocking success
Potential abiotic and biotic predictors of Walleye stocking success (Table 2) were selected based on data availability and evidence from previous studies demonstrating that these variables were related to Walleye stocking success or recruitment. Lake maximum depth (m) and lake surface area (ha) were obtained from the LAGOS-US DEPTH and LAGOS-US LOCUS data sets (https://lagoslakes.org), respectively. The LAGOS-US research platform provides open-source data sets of information from lakes across the United States (Cheruvelil et al. 2021). The shoreline development index (SDI), which is a measure of shoreline complexity, was calculated using the equation of Wetzel (2001), with lake area and lake shoreline length (m) obtained from the LAGOS-US LOCUS data set. Lake type (i.e., reservoir or natural lake) was obtained from data in the LAGOS-US RESERVOIR data set by Rodriguez et al. (2023), which categorized water bodies in the United States based on satellite imagery. Lakes larger than 5000 ha (n = 15) were excluded from this analysis because of their rarity in our data set.
| Variable | Units or categories | Source | Missingness (%) | Imputation error | Reference |
|---|---|---|---|---|---|
| Stocking size | Fry, small fingerling, or large fingerling | State agency data | 0 | – | Brooks et al. 2002 |
| Stocking density | n/ha | State agency data | 0 | – | Jacobson and Anderson 2007 |
| Largemouth Bass percentile | Percentile rank | State agency data | 73 | 0.022a | Fayram et al. 2005 |
| State | – | – | 0 | 0 | – |
| Walleye reproduction status | Mixed recruitment or no natural recruitment | State agency data | 0 | 0 | Nate et al. 2001 |
| Lake surface area | ha | LAGOS database | 0 | 0 | Van Zuiden and Sharma 2016 |
| Shoreline development index | Unitless | LAGOS database | 0 | 0 | Fielder 1992 |
| Growing degree-days base 5°C (GDD5) | Temperature above 5°C | U.S. Geological Survey | 14 | 2079a | Lawson et al. 2022 |
| Lake trophic status | Trophic state index as lake trophic state (oligotrophic, mesotrophic, eutrophic, or hypereutrophic) | Derived from LAGOS and STORET databases | 59 | 0.049b | Hansen et al. 2015a |
| Lake maximum depth | m | LAGOS database | 4 | 15.2a | Van Zuiden and Sharma 2016 |
| Lake reservoir status | Reservoir or natural lake | LAGOS database | 0 | 0 | Raabe et al. 2020 |
- a Error measured as the root mean square error.
- b Error measured as the proportion of falsely classified observations.
The trophic state index (TSI; Carlson 1977; Chipps and Graeb 2010) was used as a proxy to estimate lake productivity from the LAGOS-US LIMNO data set, which is a compilation of water quality data from state agencies and other governmental sources (Soranno et al. 2017), and the Water Quality Exchange (WQX) database (U.S. Environmental Protection Agency 2023), which is maintained by the U.S. Environmental Protection Agency. The TSI can be estimated from three different water quality variables (following Chipps and Graeb 2010): chlorophyll-a concentration (μg/L), total phosphorus concentration (μg/L), and Secchi depth (m). A hierarchical approach was used to estimate TSI, wherein chlorophyll a was preferentially used over the other two metrics when available for a particular lake; when chlorophyll a was unavailable, total phosphorus and Secchi depth were used preferentially in that order. The order of the variables reflects measures of lake productivity from most direct to least direct. Lakes were categorized using TSI based on categories provided by Chipps and Graeb (2010), where TSI scores less than 30 represented oligotrophic lakes, scores of 30–50 represented mesotrophic lakes, scores of 50–70 represented eutrophic lakes, and scores greater than 70 were categorized as hypereutrophic. In lakes where multiple measurements of the variables used to estimate TSI were available for a specific year, the highest value observed between May and September was used to estimate the maximum TSI. Trophic state was extrapolated within lakes across years, with a preference given to extrapolating values back through time. For cases in which there were no values for a lake in future years, values were extrapolated forward through time.
Climatological variables were obtained from data generated by the U.S. Geological Survey (Read et al. 2021) that represented thermal conditions in lakes across the Midwest based on simulations using a mechanistic model described by Winslow et al. (2017). From this data set, the number of growing degree-days, which is an estimate of annual thermal energy in a water body, was represented by growing degree-days base 5°C (GDD5) because previous studies have reported a stronger association of this metric with Walleye population characteristics than other temperature-related metrics (e.g., Hansen et al. 2015a, 2018). Lakes without climatological data were excluded from this analysis; however, to increase regional coverage, an exception was made for the states of Nebraska and Ohio, which did not have climatological data available at the time of this study. In the southern half of the American Midwest, growing degree-days are highly correlated with latitude based on data from Winslow et al. (2017). Therefore, GDD5 for Nebraska and Ohio were imputed (the imputation process is described below) and were included in analyses, while data from other states were limited to lakes with climatological data.
Information on the abundance of other fish species (e.g., Largemouth Bass, Northern Pike Esox lucius, Smallmouth Bass M. dolomieu, and Black Crappie) was requested from state agencies. However, due to a lack of these data, only the relative abundance of Largemouth Bass was used as a potential fish community-based predictor of Walleye stocking success. Except for Wisconsin, Minnesota, and Michigan, spring and early summer electrofishing CPEs were used as an index of Largemouth Bass relative abundance (see Table 1). For cases in which Largemouth Bass relative abundance was not estimated in the same year as a Walleye stocking evaluation, we used an estimate of bass relative abundance that was obtained within ±5 years of a Walleye stocking evaluation and preference was given to estimates obtained prior to the Walleye stocking evaluation. Because sampling methods varied among states, Largemouth Bass CPEs were also converted to state-specific percentile ranks for use in analyses.
Analysis
Random forest algorithms with multiple preparatory steps were used to evaluate which factors were important in explaining variation in Walleye stocking success at a regional level. Random forest algorithms were chosen for this analysis because of their lack of distributional requirements for fit, robustness to overfitting, and ability to incorporate imputation into the workflow. First, random forest imputation was used to impute predictor variables when they were missing for individual stocking evaluations. Random forest imputation is a statistically robust method that first uses median values to estimate missing observations and subsequently uses a random forest algorithm to iteratively update imputed values until the best values are reached based on minimizing the error of the predictions (Stekhoven and Buhlmann 2012). This procedure was implemented in the R package missForest (Stekhoven and Buhlmann 2012). Accuracy of the imputation was assessed via out-of-bag sampling to estimate the root mean square error (RMSE) for continuous variables and the proportion of falsely classified observations for categorical variables. The extent of missing predictor variables and the error associated with the imputation are provided in Table 2. After imputation, recursive feature selection was used to select the most parsimonious model from all potential combinations of candidate variables. Recursive feature selection ranks the importance of variables based on their contribution to the random forest model using the R package caret (Kuhn 2021) and eliminates less important variables to find the most informative subsets of variables among n variables. The selected models are then compared to find the most informative model overall (Guyon et al. 2002). Two models were subsequently developed: one for fry stockings and one for fingerling stockings. Once variables were identified for the final models, random forest models with k-fold cross validation (k = 10) were used to evaluate factors that influenced Walleye stocking success by utilizing the R package ranger (Wright and Ziegler 2017). The hyperparameters of the models, minimal node size, and number of random candidate variables at each split (mtry) were tuned using the tuneRanger function in the R package tuneRanger (Probst et al. 2019). From the random forest, the RMSE from out-of-bag sampling and a quasi-r2 metric (reported as R2 for this study) were used to evaluate model fit. Partial dependence plots (PDPs) were used to explore the effects of predictor variables on Walleye stocking success, and two-dimensional PDPs in the R package pdp (Greenwell 2017) were used to examine interactions between highly important variables that had interpretable interactions. In addition, individual conditional expectation plots are reported in the supplemental information (Figures S1 and S2, available in the Supplemental Information in the online version of the article). Variable importance was reported as a scaled metric, wherein the most important variable had an importance of 100, to show the relative importance of a predictor in determining Walleye stocking success.
A linear mixed-effects model with calendar year and state as fixed effects was used to evaluate whether temporal trends in Walleye stocking success for both fry and fingerlings were apparent. Individual lakes were included as a random effect, and lakes with fewer than five evaluations of individual stocking events were excluded from the analysis. Another linear mixed-effects model was used to identify whether Walleye stocking success was related to latitude within a state, with latitude and state used as fixed effects and year included as a random effect. Data from the state of Michigan were excluded from this model due to the large number of stocking evaluations with a percentile rank of 0, resulting in a distribution that was similar to a binomial response, whereas other states had distributions that were more normally distributed. Linear mixed-effects models were run using the R package lme4 (Bates et al. 2015), and statistical significance was determined by using the add-on package lmerTest (Kuznetsova et al. 2017). Marginal and conditional R2 values ( and , respectively) were used to describe the amount of variation explained by the fixed effects and random effects, respectively (Nakagawa and Schielzeth 2013). A significance level α of 0.05 was used to determine statistical significance. All analyses were conducted in R version 4.2.3 (R Core Team 2023).
RESULTS
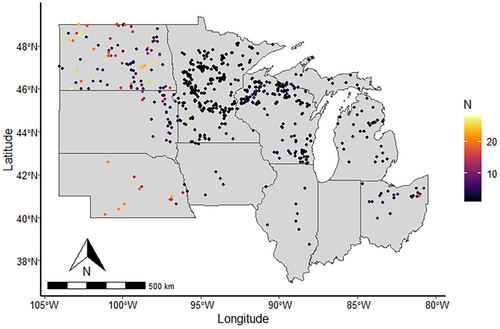
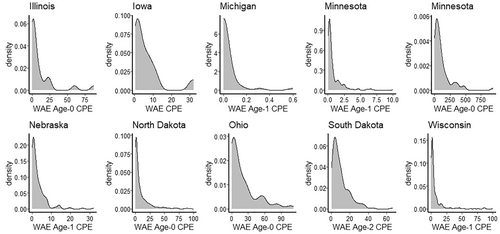
In total, 2262 stocking records were included in this study across 653 lakes in the Midwest (Figure 1). Most (74%) of the records came from three states: Minnesota, North Dakota, and Wisconsin (Table 1). The majority of stockings evaluated in this study were fingerlings (2035 fingerling stockings vs. 227 fry stockings). Approximately 30% of the fry stockings in this data set occurred in Minnesota (n = 69), with South Dakota (n = 55) and Ohio (n = 32) representing the states with the next highest numbers of fry stockings. Most lakes (78%; 485 of 615 used in the state × year model) had fewer than 5 years with a stocking evaluation. Overall, 333 (14.7%) of the 2262 lake-years included in this study were considered to have mixed recruitment contributions based on agency recruitment codes or OTC data. More than half of the study systems (55%; 339 of 653) were natural lakes, and 276 were reservoirs. The average lake surface area in this study was 489 ha (standard deviation [SD] = 701), and surface area ranged from 10 to 4811 ha. Raw Walleye CPE distributions were right skewed with long tails (Figure 2).
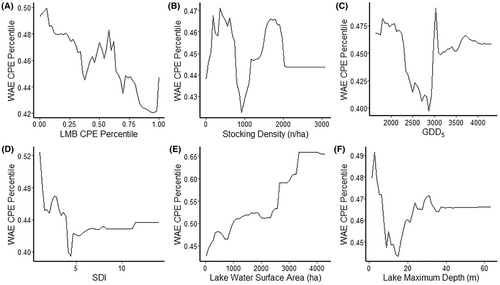
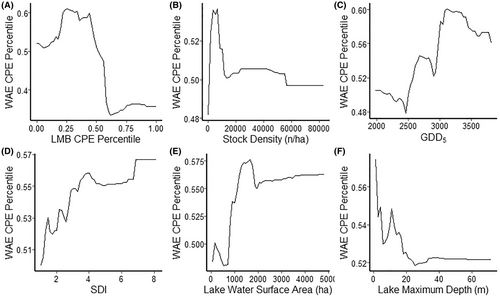
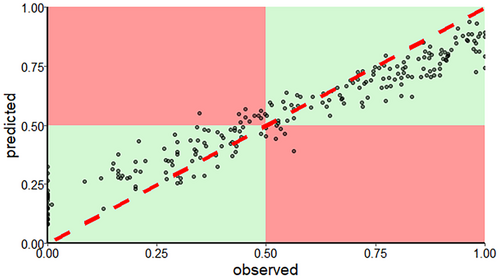
Recursive feature selection identified the SDI, Largemouth Bass percentile-ranked CPE, lake surface area, maximum depth, stocking density, GDD5, lake trophic state, and state as important predictors of fingerling stocking success. Percentile-ranked CPE of Largemouth Bass was identified as the most important predictor for explaining variation in fingerling Walleye stocking success (Figure 3); declining stocking success was observed as bass abundance increased (Figure 4A). The next most important predictor of fingerling stocking success was GDD5, followed by stocking density. Lake characteristics, such as SDI, lake surface area, and maximum depth, were the next most important predictor variables, while state, lake productivity (TSI), and lake type (reservoir or natural lake) were relatively unimportant variables. On average, Walleye stocking success was highest at stocking densities of up to 600 fish·ha−1·year–1 and generally increased with increasing lake area up to the 5000-ha cutoff in this study. Fingerling Walleye stocking success had a noisy but negative association with SDI; on average, success was highest when SDI was less than 5. The relationship between lake depth and Walleye stocking success generally decreased until a depth of approximately 10 m, at which point stocking success increased and then plateaued at approximately 20 m. Interactions between predictor variables in determining stocking success were generally unclear, with a few exceptions. There was an interaction between lake surface area and GDD5, where large lakes (>2500 ha) seemed to be more conducive to Walleye stocking success regardless of GDD5 (Figure 5B). Similarly, Largemouth Bass percentile-ranked CPE interacted with lake surface area: large lakes (>2500 ha) with low bass abundance (<50th percentile rank) had the highest probability of stocking success (Figure 5A). Altogether, the model explained approximately 24% of the variation in Walleye stocking success for fingerlings (R2 = 23.97%) and had an RMSE of 0.068, as estimated by out-of-bag resampling. Although the model explained a relatively low percentage of variation overall, the model was relatively accurate with regard to predicting whether Walleye stocking success for a lake fell above or below the median percentile (i.e., percentile rank = 0.50) of stocking success. Specifically, when the percentile distribution used to quantify Walleye stocking success was converted to a dichotomous variable (below or at the median percentile vs. above the median percentile), the model correctly classified fingerling stocking success 94% of the time (Figure 6). The sensitivity was 94.47% (proportion at or above a value of 0.50 that were identified as above average), and the specificity was 87.73% (proportion below a value of 0.50 that were identified as below average).

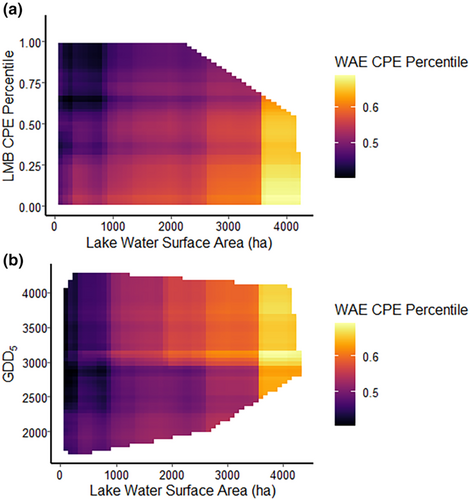
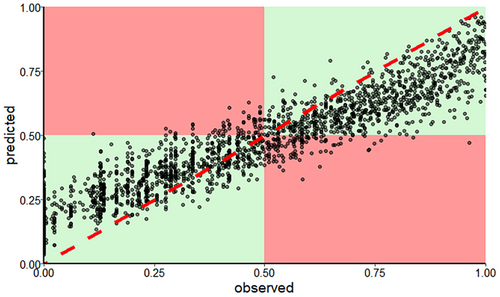
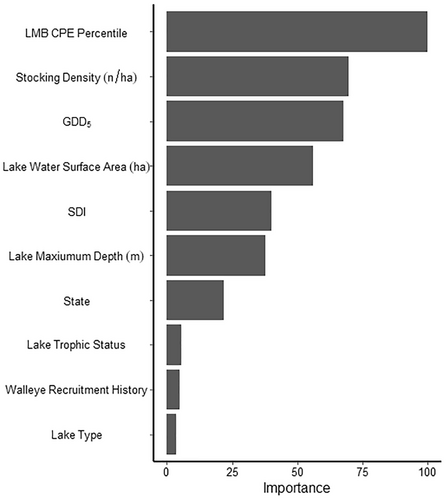
Recursive feature selection identified the SDI, state, stocking density, lake water surface area, lake maximum depth, GDD5, lake trophic status, lake type, Walleye reproduction status, and Largemouth Bass percentile rank as important predictors of fry stocking success. Largemouth Bass percentile-ranked CPE was also the most important predictor for Walleye fry stocking success (Figure 7). Fry stocking success was negatively associated with Largemouth Bass CPE percentile ranks above 0.50 (Figure 8A). Similar to the fingerling model, Walleye fry stocking increased with increasing lake surface area but plateaued at approximately 2000 ha. Fry stocking success tended to increase with increasing SDI, which was not observed for fingerling stocking. Interactions between variables were difficult to interpret, but there appeared to be an interaction between Largemouth Bass percentile-ranked CPE and lake surface area, where Walleye fry stocking success tended to be higher in lakes with a bass CPE percentile below the median regardless of surface area (Figure 9A). Lake surface area had a threshold effect with GDD5: above approximately 700 ha, stocking success was relatively uninfluenced by GDD5 (Figure 9B). Percentile-ranked CPE of Largemouth Bass also had a threshold effect with GDD5, where lakes with bass CPE values above the 50th percentile were not conducive to stocking success for fry (Figure 9C). Overall, the model for Walleye fry explained 16.4% of the variation in stocking success and had an RMSE of 0.079. Similar to the fingerling model, the fry stocking model had high accuracy (92%) for correctly classifying whether stocking success fell at or above a percentile rank of 0.50 (Figure 10). The specificity for the fry model was 89.2%, and the sensitivity was 94.4%.

The relationship between latitude and stocking success for fingerlings and fry varied by state (significant latitude × state interaction; F7, 2190 = 4.094, p = 0.0002); however, the was only 0.027 and the was only 0.046. For both fry and fingerling stockings, the fixed effects of state and latitude and the random effect of year in this model had poor explanatory power. Despite a significant interaction, only Minnesota, South Dakota, and Wisconsin had statistically significant negative slopes (Table S1, available in the Supplemental Information in the online version of the article; Figure 11), meaning that stocking success for fry and fingerlings decreased with an increase in latitude on average. Similarly, the relationship between calendar year and Walleye stocking success for both fry and fingerlings varied by state (significant year × state interaction; F7, 1361 = 3.25, p = 0.002), and little variation was explained by the fixed effects of state and calendar year in this model ( = 0.026). However, the random effect of lake explained over 31% of the variation in the model ( = 0.312). Ohio was the only state with a significant slope (Table S2; Figure 12), with stocking success decreasing on average through time for both fry and fingerlings.


DISCUSSION
Largemouth Bass relative abundance appears to represent an important factor associated with stocking success for Walleye fry and fingerlings. The negative association between Walleye stocking success and Largemouth Bass abundance in PDPs could be a reflection of Largemouth Bass predation on stocked Walleye (Fayram et al. 2005; Freedman et al. 2012) or a more complex interaction in which lakes with a high relative abundance of Largemouth Bass have certain abiotic or biotic characteristics that are less conducive to Walleye survival after stocking. Regardless of the mechanisms, our results indicate that accounting for Largemouth Bass relative abundance may represent an important consideration in the allocation of Walleye for stocking. Furthermore, previous studies (Bethke and Staples 2015; Hansen et al. 2015b) have indicated that Largemouth Bass abundance has increased in Wisconsin and Minnesota, including in lakes that contain Walleye. If bass abundance continues to increase over time, more lakes could become less conducive to successful Walleye stocking. Our results align with those of a previous study reporting that the probability of Walleye recruitment was negatively associated with Largemouth Bass abundance in Wisconsin lakes (Hansen et al. 2018). We note that many lakes used in our evaluation lacked estimates of Largemouth Bass relative abundance, thus requiring imputation of this metric. Hence, future efforts to estimate Largemouth Bass abundance for lakes and years in which Walleye stocking assessments occur may improve managers' ability to identify lakes where stocking is more likely to result in success.
Lake latitude within a state appeared to be relatively unimportant for explaining variation in Walleye stocking success, probably because within-lake variation was more important in explaining the variation in stocking success. This is consistent with previous studies demonstrating that the characteristics of individual lakes contribute to variation in Walleye stocking success (Jennings et al. 2005; Reed and Staples 2017; Lawson et al. 2022). Lakes at similar latitudes or within individual states can vary substantially in terms of attributes, including surface area, fish community, and limnological characteristics (Winslow et al. 2017). These results suggest that the influence of regionwide drivers (e.g., climate change) on stocking success are not uniform across the landscape. Our results indicate that providing stocking-supported Walleye fisheries that are distributed throughout a particular state remains a viable management option, which could be important in ensuring broad spatial access to these fisheries relative to travel distances.
Our results also indicate that relative Walleye stocking success has not universally decreased over time at a regionwide scale at the sites evaluated in this study. Although temporal declines in Walleye stocking success may be occurring in individual lakes or in specific regions within states, such as the Ceded Territory of Wisconsin (e.g., Lawson et al. 2022) or Ohio, as observed in this study, the rest of the states showed no clear temporal trends with regard to stocking success. Moreover, individual lake variation explained far more variation in stocking success than the fixed effects of state or calendar year.
Kerr (2011) found that the stocking rates most commonly used by state agencies for Walleye were 2000–5000 fry/ha and 75–125 summer fingerlings/ha. These fry stocking rates approximately align with the rate at which the highest probability for fry stocking success was observed in this study. Common fingerling stocking rates reported by Kerr (2011) fell within the observed ranges of highest stocking success based on the PDPs for fingerling stocking density. Within the Ceded Territory of northern Wisconsin, a similar response was noted in a study on the impact of Walleye stocking density, with diminishing returns after peak stocking densities between 2 and 56 fingerlings/ha (Lawson et al. 2022). Our results suggest that increasing stocking densities beyond 3300 fry/ha or beyond 370 fingerlings/ha may not achieve greater stocking success for declining Walleye fisheries. Within the RAD framework, stocking may often represent a resistance-based strategy (Feiner et al. 2022) to “resist” declines in Walleye fisheries. Accordingly, diminishing stocking success within a given lake through time would suggest that the lake may be transitioning away from suitable Walleye habitat, and therefore other strategies in the RAD framework should be explored. For example, directing lakes with diminishing Walleye populations to “centrarchid-centric” fisheries has been suggested as a strategy to mitigate the loss of marginal Walleye fisheries in Wisconsin (Feiner et al. 2022). However, in some systems, stocking may serve as an “adapt” strategy within the context of the RAD framework if a lake can no longer support natural recruitment but Walleye stocking success remains high.
Our results suggest that interactions between climate change and lake characteristics may diminish the potential number of lakes where Walleye stocking could be successful in the future. For both fry and fingerlings, our analyses suggest that large lakes have been more resilient to the suite of climate-induced impacts with regard to stocking success. This is consistent with multiple studies, which have found that Walleye tend to have better survival past juvenile life stages in larger systems (Nate et al. 2001; Van Zuiden and Sharma 2016; Lawson et al. 2022). Walleye are not native to many of the small lakes and reservoirs in which they have been stocked across the Midwest, and they are generally considered to be mostly adapted to riverine environments (Kitchell et al. 1977), larger lacustrine systems (e.g., the Great Lakes), or large river–lake complexes (e.g., Lake of the Woods, Minnesota–Ontario; Lake Winnebago system, Wisconsin). Large lakes are thought to be better for Walleye because they tend to be more varied in habitat and are more likely to contain habitat conditions similar to those found in rivers, especially for spawning (Kitchell et al. 1977; Bozek et al. 2011).
One limitation of our study is that for lakes with mixed recruitment sources, we typically could not discern the contributions of wild and stocked fish to the Walleye CPEs that were used as measures of stocking success. Our approach reflects reality; the vast majority of Walleye stocking assessments do not include an effort to discern between stocked and wild fish and instead rely on undifferentiated CPE of age-0 or age-1 fish as a measure of stocking success. In our evaluation, only 10% of stocking evaluations (34 of 333 lake-years) for lakes classified as having mixed recruitment included efforts to identify stocked fish via OTC marking. The remainder (90%) of mixed-recruitment lakes were classified based on recruitment classifications provided by state agencies, and we could not determine the level of natural recruitment in these lakes. At a minimum, the fact that stocking is occurring on a lake suggests that natural recruitment is not sufficient to meet management objectives for that specific lake. We note that in some cases, methods such as OTC marking of stocked fish are used to discriminate between stocked and wild fish, but this occurs for only a small fraction of stockings and is usually associated with short-term studies of stocking success, which occur on a relatively small number of lakes (e.g., Lucchesi 2002; Fayram et al. 2005). Although the metrics that we used to describe stocking success reflect what is done to evaluate stocking, failure to discern among sources of recruitment could influence the results of our modeling. For example, if larger lakes support higher levels of natural Walleye recruitment (Hansen et al. 2015a), then stocking success may be overestimated in these larger systems if wild fish are a major source of recruitment. However, in our data, the median percentile-ranked CPE of Walleye stocking success was nearly identical for lakes with mixed recruitment (median percentile rank = 0.47) and lakes with no natural recruitment (median percentile rank = 0.45), so this is unlikely to have influenced the results presented here.
The variation in sampling methods that are used to assess Walleye stocking success across states precludes direct assessment of Walleye stocking success at a regional scale, requiring some form of data standardization. Our standardization approach did provide metrics of Walleye stocking success that were on a similar scale (percentile rank), but this does not mean that percentile ranks were equivalent across states. For example, a lake classified in the 90th percentile of Walleye stocking success in Wisconsin or Minnesota may not be equivalent to a 90th-percentile lake in Iowa or Ohio. This would also apply to our rank percentile classification that was used to standardize Largemouth Bass abundance. Although the issue with metric equivalency among states could confound the accuracy of our models, our results align with previous research on Walleye stocking success and natural recruitment with regard to the influence of Largemouth Bass abundance (Hansen et al. 2018) and climate change (Wagner et al. 2023). Additionally, our results align with previously identified attributes of lakes where Walleye have been able to sustain natural recruitment or have persistent year-classes as a result of stocking (Nate et al. 2001; Hansen et al. 2015a).
Management implications
Stocking is an important tool that managers can use to maintain or supplement Walleye populations, and the importance of this tool may provide a strategy for increased stocking if natural recruitment of Walleye continues to decline. Lake surface area appears to provide one readily available metric that may aid in strategic allocation of stocked Walleye in the Midwestern United States, but the ability to categorize Largemouth Bass abundance among lakes might also help to guide stocking allocation. Estimates of Largemouth Bass relative abundance were not available for many of the lakes in our analysis. Hence, additional efforts to estimate Largemouth Bass abundance might improve fishery managers' ability to predict where Walleye stocking is most likely to be successful. Our study resulted in an online tool (WAECAST, Isermann and Davis 2024) that allows managers to input lake characteristics to determine the likelihood of stocking success based on data in the models from this study. Additionally, projections of Walleye stocking success that consider climate change are provided as part of the tool to understand the potential future impacts of lake warming.
ACKNOWLEDGMENTS
We thank the following individuals for assistance with data acquisition: Vic Santucci (Illinois Department of Natural Resources), Rebecca Krogman (Iowa Department of Natural Resources), Seth Herbst (Michigan Department of Natural Resources), Jon Hansen and Dale Logsdon (Minnesota Department of Natural Resources), Keith Koupal (Nebraska Game and Parks Commission), Scott Gangl (North Dakota Game and Fish Department), Joseph Conroy (Ohio Department of Natural Resources), Brian Blackwell (South Dakota Department of Game, Fish, and Parks), and Zach Lawson and Paul Frater (Wisconsin Department of Natural Resources). This project was funded by the U.S. Geological Survey Midwest Climate Adaptation Science Center (Grant Number G21AC10241-00). Any use of trade, firm, or product names is for descriptive purposes only and does not imply endorsement by the U.S. Government.
CONFLICT OF INTEREST STATEMENT
The authors have no conflicts of interest to report.
ETHICS STATEMENT
This study was conducted within the ethical guidelines of the institution and country in which it was performed.
Open Research
DATA AVAILABILITY STATEMENT
A partial data release for this project (Davis and Isermann 2024) is available at ScienceBase (https://doi.org/10.5066/P13RXZEJ). The code used to generate the shiny application (WAECAST) can be found at the following link: https://doi.org/10.5066/P14CG6HJ. A link to the application for use can be found here: https://tinyurl.com/2kkhvr3t.


