Visualization and characterization of complement activation in acetylcholine receptor antibody seropositive myasthenia gravis
Abstract
Introduction/Aims
There are no blood biomarkers to monitor treatment effects in myasthenia gravis (MG) or studies visualizing the acetylcholine receptor (AChR) antibody-induced membrane attack complex (MAC) at the human muscle membrane. This study aimed to compare levels of complement activation products and native complement components in MG patients and healthy controls (HCs) and to model the AChR antibody-mediated attacks in human muscle cells.
Methods
We assessed the complement components and activation product levels with enzyme-linked immunosorbent assay and magnetic bead-based sandwich assays in plasma and sera of 23 MG patients and matched HCs. Receiver operator characteristic (ROC) curve analysis evaluated the diagnostic accuracy. Complement levels were correlated with the myasthenia gravis composite (MGC) scores. AChR+ MG modeling in human muscle cells used sera from nine MG patients and three HCs.
Results
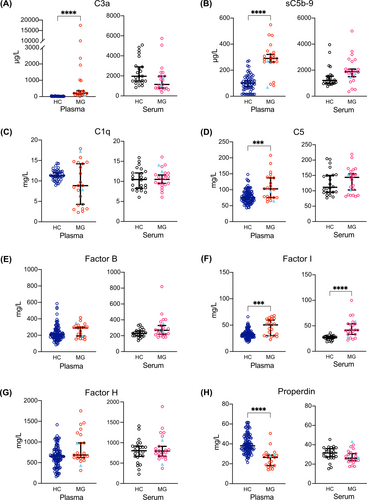
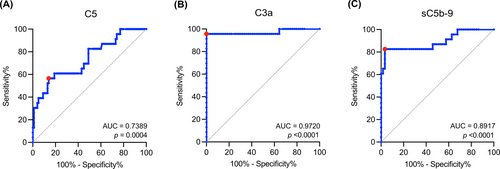
MG patients had significantly higher plasma levels of C3a (p < .0001), C5 (p = .0003), and soluble C5b-9 (sC5b-9; p < .0001) than HCs. The ROC curve analysis showed a clear separation between MG patients and HCs for plasma C3a (AUC = 0.9720; p < .0001) and sC5b-9 (AUC = 0.8917, p < .0001). MG patients had higher levels of plasma complement Factor I (FI; p = .0002) and lower properdin levels (p < .0001). The MGC had moderate correlations with plasma Factor B (FB), FI, and Factor H. AChR+ MG patient sera triggered the deposition of MAC and reduced AChRs.
Discussion
We suggest validating plasma C3a and sC5b-9 as blood biomarkers for complement activation in MG. Further, the in vitro study allowed visualization of MAC deposition after applying AChR+ MG sera on human muscle cells.
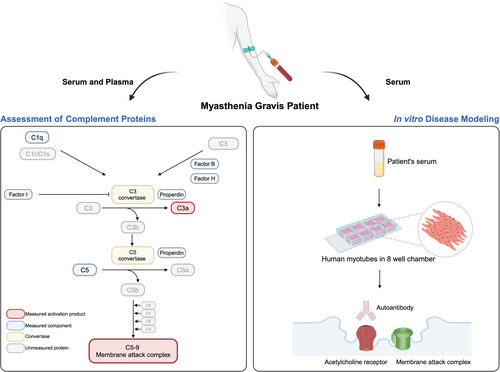
Graphical Abstract
Abbreviations
-
- AChR
-
- acetylcholine receptor
-
- AChR+
-
- acetylcholine receptor antibody seropositive
-
- EAMG
-
- experimental autoimmune myasthenia gravis
-
- ELISA
-
- enzyme-linked immunosorbent assay
-
- EOMG
-
- early-onset myasthenia gravis
-
- FB
-
- Factor B
-
- FH
-
- Factor H
-
- FI
-
- Factor I
-
- gMG
-
- generalized myasthenia gravis
-
- HC
-
- healthy control
-
- IgG
-
- immunoglobulin G
-
- IL-6
-
- interleukin-6
-
- LOMG
-
- late-onset myasthenia gravis
-
- MAC
-
- membrane attack complex
-
- MBSI
-
- magnetic bead-based sandwich immunoassay
-
- MG
-
- myasthenia gravis
-
- MGC
-
- myasthenia gravis composite
-
- NMJ
-
- neuromuscular junction
-
- ROC
-
- receiver operator characteristic
-
- sC5b-9
-
- soluble C5b-9
1 INTRODUCTION
Most patients with myasthenia gravis (MG) (~85%) are seropositive for acetylcholine receptor (AChR) antibodies. Three pathophysiological features have been reported in AChR antibody seropositive (AChR+) MG: direct blockade of AChRs, autoantibody-mediated AChR cross-linking and internalization, and complement-mediated damage of the muscle membrane by the formation of the pore-like membrane attack complex (MAC).1 Complement activation studies in MG show complement-fixating autoantibodies2 and complement factors located at the neuromuscular junction (NMJ).3-6 Moreover, the MAC induces damage to the muscle membrane and failure of neuromuscular transmission.7
Native complement components tightly control the complement cascade to prevent damage to autologous cells. The complement cascade can be activated via the classical, lectin, or alternative pathway. The classical pathway in AChR+ MG is initiated when C1q binds to the complex formed by immunoglobulin G (IgG) and AChR. C3 convertase cleaves C3 into C3a and C3b, which forms C5 convertase that splits C5 into C5a and C5b. The latter complex with C6 and C7 inserts into the membrane, followed by the binding of C8 and multiple C9 molecules, giving rise to the complement activation product MAC (C5b-9).8 Inhibition of MAC formation by targeting C5, but also C1 and C3, has become the focus of novel therapeutics for AChR+ generalized MG (gMG), resulting in the approval of three drugs, with several in development.9-11 There are, however, no available complement-related blood biomarkers to evaluate the complement status in MG. A previous study of complement-targeted therapeutics in refractory gMG showed that patients had inhibition of complement levels regardless of clinical outcome.12 Studies of soluble C5b-9 (sC5b-9) plasma levels indicate higher levels in MG patients than healthy controls (HCs)13, 14 and other noninflammatory neurological disorders.15 In contrast, another study found no difference in sC5b-9 levels between MG patients and HCs.16 The complement activity in AChR+ MG has also been reported, showing no associations between complement activity and disease severity or autoantibody titer.17 Moreover, a cell-based assay has recently been developed to evaluate AChR antibody-mediated MAC formation.18
Evidence from animal studies of experimental autoimmune MG (EAMG) suggests that complement activation is essential in AChR+ MG pathogenesis.19 EAMG studies demonstrate that deficiencies in particular complement proteins cause reduced loss of AChRs, failure of MAC deposition at the NMJ, and lower EAMG incidence or severity.20-22 However, the human studies are mainly based on electron microscopy images showing the structure of complement components localizing to the postsynaptic membrane.3, 6, 23 Cell studies in TE671 rhabdomyosarcoma cells prove that AChR antibodies reduce AChRs24 and studies of Jurkat cells that individually express each monomeric AChR subunit have highlighted the association between monoclonal AChR antibody specificity and pathogenic capacity.25 Nevertheless, no studies have been performed in human muscle cells where the complement activation, that is, deposition of the MAC and loss of AChRs, have been induced and visualized together.
This study aimed to analyze complement activation products C3a and sC5b-9 in plasma and sera in parallel from MG patients and matched HCs. In addition, six native complement components were evaluated to investigate the activated pathway in MG. We further aimed to perform in vitro human disease modeling in muscle cells to visualize the MAC and AChR loss associated with the AChR antibody-mediated attack.
2 METHODS
2.1 Blood samples of MG patients and HCs
Sera and plasma were obtained from MG patients at the Neurology Clinics of Jönköping County Hospital and Uppsala University Hospital, Sweden. All patients were diagnosed with MG (ICD-10 diagnosis of G70.0), with objective skeletal muscle fatigue upon chart review, further supported by a positive AChR antibody titer on radio immune assay and/or abnormal electrophysiology by repetitive nerve stimulation or single-fiber electromyography. Patients were divided into early-onset MG (EOMG; 19–50 years of age) and late-onset MG (LOMG; onset >50 years of age). Disease severity was assessed through the MG composite (MGC) score. HC sera and plasma were obtained from de-identified healthy blood donors at the Bloodbank at Uppsala University Hospital. All samples were handled according to standard protocol (Supporting Information S4: supplementary methods).
2.2 Study approval
This study was approved by the Swedish Ethical Review Authority on human experimentation (ethical permit numbers 2018/446 and 2020–03049), and written informed consent for research was obtained from all MG patients and HCs.
2.3 Enzyme-linked immunosorbent assay
C1q concentrations in individual samples from MG patients and HCs were measured by a commercial enzyme-linked immunosorbent assay (ELISA) kit (HK356, Hycult Biotech). All samples were assayed in duplicate; the detection range was 7.8–500 ng/mL (Supporting Information S4: supplementary methods).
2.4 Magnetic bead-based sandwich immunoassay
Factor B (FB), Factor H (FH), Factor I (FI), C5, and properdin were analyzed with an in-house magnetic bead-based sandwich immunoassay (MBSI).
2.5 Human skeletal muscle myoblasts culture and MG induction in vitro
Primary human skeletal muscle myoblasts were purchased from Lonza (Cat. no. CC-2580; lot 20TL356514) and cultured according to the vendor's instructions (Supporting Information S4: supplementary methods). About 300 ng/mL recombinant neural agrin (R&D Systems) was applied to cell cultures on Day 3 of differentiation to induce AChR clustering. After 48 h of incubation with agrin, patient serum was diluted with DMEM:F-12 into a ratio of 1:1 and returned to incubation for 0.5 or 2 h. We added sera from a total of nine female AChR+ EOMG patients, all with gMG, with different medications, including no immunosuppressive treatment (n = 3), prednisone (n = 3), and azathioprine (n = 3) for in vitro disease modeling and analysis of complement activation and muscle membrane disruption (Table S1). Three matched female HC sera were also added to model the normal condition.
2.6 Immunocytochemistry
The following primary antibodies were used for targeting proteins of interest: anti-desmin (Abcam, ab32362), anti-sarcomeric alpha-actinin (Abcam, ab9465), anti-human IgG (Dako Denmark A/S), and anti-complement component C5b-9 (BioPorto). Fluorescently labeled secondary antibodies were applied (Supporting Information S4: supplementary methods). AChRs were labeled with α-Bungarotoxin-tetramethylrhodamine (Sigma-Aldrich), and cell nuclei were labeled with DAPI. Fluorescence and Z-stack series imaging were performed using a confocal microscope (Zeiss LSM700).
2.7 Image analysis
Image processing and quantification were performed using ImageJ software. Areas of AChRs and sC5b-9 areas were quantified. Muscle cells were stained with desmin. Images were automatically adjusted in brightness and contrast according to the analysis of the images' histograms, and then the threshold was set to Otsu. The signal-positive regions were selected to measure the area. A total of 27 images (nine per patient sample), taken from three different samples, were analyzed in each group. The ratio of AChRs/Desmin was presented to indicate the change of AChRs on the muscle membrane. MAC deposition was defined as the ratio of (AChRs + C5b-9)/AChRs to present MAC-positive AChRs.
2.8 Statistical analysis
Statistical analysis was performed using GraphPad Prism version 9.3.1 for Mac (GraphPad Software, La Jolla, CA, USA). D'Agostino and Pearson's test was applied for the normality test, and data were presented as the median with a 95% confidence interval. A two-sided Mann–Whitney test was applied to compare groups. A nonparametric one-way ANOVA on ranks with Dunn's multiple comparisons test was performed to compare three groups. Receiver operator characteristic (ROC) curves were applied using the Wilson–Brown method to analyze the biomarker potential of plasma complement components for discriminating between MG patients and HCs. Correlation analysis was performed using nonparametric Spearman's rank correlation test. The strength of correlation was determined based on the correlation coefficient (r): strong (.70–1.00), moderate (.40–0.69), and weak (.10–0.39).26 Due to multiple comparisons, we used the Benjamini–Hochberg method to control the false discovery rate.27 Statistical significance was defined with Benjamini–Hochberg corrected p values with the significance level initially set at .05 and p value threshold values calculated according to the formula α(i/m), as stated in the figure legends.
3 RESULTS
3.1 Comparison of plasma and serum complement profiling in MG patients
This study included sera and plasma samples from 23 MG patients (21 of whom were seropositive for AChR antibodies by radioimmunoassay), sera from 24 HC, and plasma from 140 HC. The cohort consisted of 14 EOMG and 9 LOMG patients. Disease duration ranged from 2 to 48 years (17.7 ± 13.4), with significantly longer disease duration in the EOMG group (p = .0057). Twelve patients had standard immunosuppressive treatments (Table 1, Table S2). MG patients had significantly higher levels of plasma complement components C3a and sC5b-9 (Figure 1A,B), C5 (Figure 1D), and FI (Figure 1F). Properdin levels in plasma were significantly lower in MG patients (Figure 1H). The other plasma complement components did not significantly differ between MG and HC (Figure 1). In serum, MG patients had significantly higher FI levels than HCs (Figure 1F). Significant, strong correlations were found between C5 and FB and FI, between FI and FB, and between FI and properdin in MG patient plasma (Table 2). The correlation analysis further revealed moderate correlations among other complement components in MG patients (Table 2). The values of the median ± 95% confidence interval for all analyzed complement components are shown in Table 3.
| Serum healthy controls (n = 24) | Plasma healthy controls (n = 140)a | MG patients (n = 23) | MG patients subgrouping by onset age | ||
|---|---|---|---|---|---|
| EOMG (n = 14) | LOMG (n = 9) | ||||
| Sex (F:M) | 15:9 | 24:16 | 14:9 | 12:2 | 2:7 |
| Age at sample collection (years, mean ± SD) | 50.0 ± 16.3 | 52.0 ± 15.8 | 59.4 ± 17.2 | 48.6 ± 13.9 | 75.6 ± 7.0 |
| Serology | |||||
| AChR+ | - | 21 | 13 | 8 | |
| Double seronegative | - | 2 | 1 | 1 | |
| MGC at sample collection (score, mean ± SD) | - | 6.6 ± 5.4 | 7.3 ± 5.4 | 5.4 ± 5.5 | |
| Disease duration (mean ± SD) | 17.7 ± 13.4 | 22.9 ± 14.0 | 9.5 ± 4.9** | ||
| Immunosuppressive medications | |||||
| None | - | 11 | 6 | 5 | |
| Azathioprine | - | 4 | 2 | 2 | |
| Prednisone | - | 4 | 3 | 1 | |
| Cyclosporine | - | 1 | 1 | 0 | |
| Rituximab | - | 2 | 1 | 1 | |
| Cyclosporine + rituximab | - | 1 | 1 | 0 | |
| Thymectomy | 15 | 11 | 4 | ||
| Thymoma | 4 | 3 | 1 | ||
- Abbreviations: AChR+, acetylcholine receptor antibody seropositive; double seronegative, no detachable antibodies against AChR or muscle-specific tyrosine kinase; EOMG, early-onset MG; F, female; LOMG, late-onset MG; M, male; MGC, myasthenia gravis composite.
- a Information on sex and age at sample collection was not available in 100 out of 140 plasma healthy control samples.
- ** p < .01.
| C3a | C5 | sC5b-9 | Factor B | Factor I | Factor H | Properdin | ||
|---|---|---|---|---|---|---|---|---|
| C1q | r | −.196 | −.356 | −.032 | −.275 | −.268 | −.531 | −.360 |
| p | .370 | .096 | .884 | .204 | .216 | .0091** | .092 | |
| C3a | r | .058 | .469 | −.039 | .042 | −.102 | .125 | |
| p | .793 | .0238 | .861 | .849 | .644 | .571 | ||
| C5 | r | .288 | .735 | .883 | .599 | .619 | ||
| P | .183 | <.0001**** | <.0001**** | .0026** | .0016** | |||
| sC5b-9 | r | .055 | .155 | −.171 | .063 | |||
| p | .802 | .481 | .436 | .776 | ||||
| Factor B | r | .826 | .387 | .560 | ||||
| p | <.0001**** | .068 | .0055** | |||||
| Factor I | r | .494 | .726 | |||||
| p | .0167 | <.0001**** | ||||||
| Factor H | r | .277 | ||||||
| p | .200 |
- Note: Correlation analysis was performed using nonparametric Spearman correlation. Correction of p values was performed by using the Benjamini–Hochberg method.
- ** p < .01.
- **** p < .0001.
| Complement components | HC | MG | ||
|---|---|---|---|---|
| Plasma | Serum | Plasma | Serum | |
| C3a (μg/L) | 20.38 (14.98–23.69) | 1962 (1482–2898) | 205 (137–351) | 1145 (782–1968) |
| sC5b-9 (μg/L) | 101.9 (74.9–118.5) | 1206 (983–1533) | 290 (263–321) | 1877 (1501–2086) |
| C1q (mg/L) | 11.28 (10.93–11.95) | 10.45 (8.25–12.09) | 8.84 (4.28–14.19) | 10.82 (9.48–12.04) |
| C5 (mg/L) | 74.75 (70.1–81.6) | 111.5 (95.6–150.1) | 102.8 (75.5–137) | 143.9 (102.8–155.3) |
| Factor B (mg/L) | 206.5 (190–219) | 229.5 (198–259) | 288.3 (191.1–300) | 269 (219–328.7) |
| Factor I (mg/L) | 32.1 (29.7–33.6) | 27.1 (24.7–29.7) | 50.4 (30–59.5) | 41.4 (33.2–53.7) |
| Factor H (mg/L) | 650.5 (593–689) | 802 (665–915) | 684 (623–977) | 795 (671–911) |
| Properdin (mg/L) | 38.05 (35.5–40.5) | 31.55 (27.5–35.9) | 26.4 (18.2–28.6) | 26 (23.6–30.8) |
- Note: Data are presented as median ± 95% confidence interval.
3.2 Exploratory subgroup analysis based on the disease onset and immunosuppression
In the exploratory subgroup analysis, higher plasma levels of C3a and properdin were seen in both EOMG and LOMG compared to HC (Figure S1). Plasma FI, sC5b-9, and C5 were significantly higher in EOMG than in HC (Figure S1). Serum FI levels were higher in both EOMG and LOMG patients than in HC (Figure S1).
Plasma levels of C3a and properdin were altered in MG patients with and without immunosuppression compared to HC (Figure S2). Plasma levels of FI and C5 were higher in MG patients with immunosuppression. Serum FI levels were higher in MG patients with and without immunosuppression (Figure S2). No other significant differences in serum levels were observed for the complement activation products between the EOMG or LOMG groups (Figure S1) or between MG patients with and without immunosuppression (Figure S2). Tables S3 and S4 showed the values of median ± 95% confidence interval for the subgroups of disease onset and immunosuppression, respectively.
3.3 Potential diagnostic value of plasma C5, C3a, and sC5b-9 as biomarkers for MG
The ROC curve analysis assessed the diagnostic accuracy of C5, C3a, and sC5b-9 (Figure 2). Youden's index was used to determine the sensitivity and specificity at the best trade-off (Youden's index: 0.43 for C5; 0.96 for C3a; and 0.79 for sC5b-9). The strongest association with MG was observed for C3a, with an AUC value of 0.9720 (Figure 2).
3.4 Correlation between clinical MG severity and complement factors
The MGC positively correlated by moderate strength with several complement factors in plasma: FB (Figure 3A), FI (Figure 3B), and FH (Figure 3C). Plasma and serum complement components did not correlate with age or sex (data not shown).

3.5 Visualization of complement deposition and AChR reduction in an AChR+ MG human muscle cell model
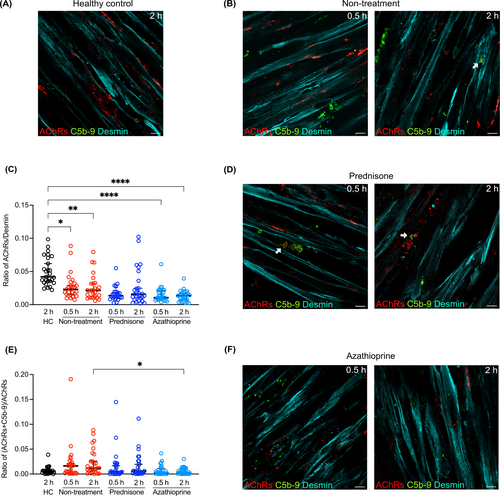
Preincubation of muscle cells with recombinant neural agrin successfully induced AChR clustering (Figure S3B). Following incubation with patient sera for 2 h, the binding of human IgG to AChRs was observed (Figure S3D), whereas incubation with sera from HCs showed no staining for MAC (C5b-9; Figure 4A). A reduction of the AChR number on muscle cells, with a significantly reduced ratio of AChRs per muscle fiber area, was seen in MG patients without immunosuppressive treatment compared with HC sera (Figure 4B,C). Furthermore, the deposition of MAC was detected and colocalized with AChRs (Figure 4B). AChRs were also reduced in MG patients without immunosuppression and in both groups of MG patients treated with prednisone and azathioprine (Figure 4C–F). The cultures incubated with MG patient sera showed a marked reduction in the colocalization of AChRs and MAC in the Azathioprin-treated group compared to the immunosuppression naive MG group (Figure 4E).
3.6 Observation of ring-shaped MAC depositions and MAC-enclosed AChRs
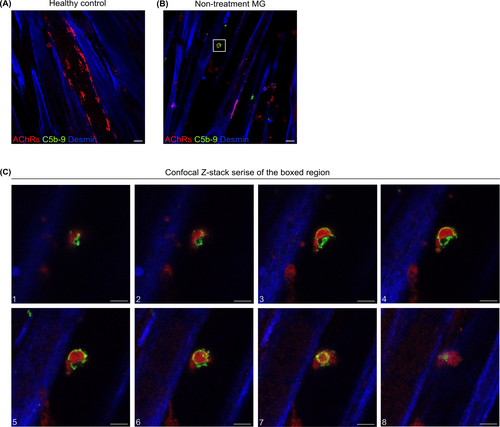
Given our finding of the colocalization of AChRs and MAC, we further performed confocal Z-stack imaging to obtain a more high-resolution 3D visualization analysis (Figure 5). Following a 2-h incubation with serum from one female AChR+ gMG patient without immunosuppressive treatment and an MGC score of 17 (Table S1, Pat#2), we observed a ring-shaped C5b-9 deposition enclosing AChRs (Figure 5C).
4 DISCUSSION
The most prominent findings were the significantly elevated plasma levels of C3a and sC5b-9 in all MG patients, both EOMG and LOMG of different clinical severity and patients with and without immunosuppression, which aligns with previous studies.13, 14 C3a was the most sensitive and specific for MG, followed by sC5b-9. Hence, C3a and sC5b-9 can separate MG from HC and are promising candidate blood biomarkers in AChR+ MG. Another recent study found lower serum C5 and higher sC5b-9 levels in MG patients with immunosuppressive naive gMG compared to noninflammatory neurological disease controls.28 Iacomino et al. found that plasma C1q and sC5b-9 did not differ in a small cohort of MG patients and HCs.16 The reason for increased C5 levels could be the upregulation of inflammatory cytokines such as interleukin-6 (IL-6), which has been found elevated in MG patients29 and known to enhance C5 levels. It could also be speculated whether increased C5 levels would be some feedback mechanism. Properdin, the only positive regulatory protein in the complement system,30 was lower in MG patients' plasma and serum, in line with previous findings.15 Properdin can bind apoptotic T cells and further promote complement activation and phagocytosis,31 so further studies are needed to understand the functional role of properdin in the pathogenesis of MG. However, the alternative pathway, called the amplification loop, is constantly active. Serum FI levels were also significantly higher in MG, indicating inflammation32 and release of IL-6,33, 34 a cytokine previously reported elevated in MG patients.29 Intriguingly, we found moderate and significant positive correlations between disease status (MGC scores) and plasma FI, FB, and FH, which would need to be confirmed in prospective studies to understand the longitudinal evolution.
The varying literature data of the complement system status can be explained by the analytical methods, sample types (serum vs. plasma), and sample handling.35 However, EDTA-plasma is mandatory for complement activation products since EDTA chelates Ca2+ and Mg2+, thus stopping further complement activation outside the body.35 For native complement components, EDTA plasma is preferred, but serum is also acceptable, whereas serum is the preferred sample for functional analysis of the complement cascade. For the abovementioned reasons, the complement activation products should be assessed in plasma, which provides more accurate information on complement activation.
The in vitro study showed that AChR+ MG patient sera triggered the deposition of MAC on the human muscle cell membrane, both for immunosuppressive naive and immunosuppressant-treated patients. Nevertheless, sera from patients receiving azathioprine induced fewer MACs. AChR+ MG sera also reduced AChRs in the muscle cells. Since the EAMG model fails to recapitulate the human immune system36 and the different disease phenotypes, we suggest this human in vitro MG model to examine the pathophysiological effects of AChR+ patient sera on human muscle cells. The induction time of MG for the in vitro experimental design is crucial in that complement activation is a fast-acting enzymatic reaction. We observed the deposition of terminal complement components at 0.5- and 2-h post-incubation of patient sera. Previous studies with incubation of 1 day and 3 h, respectively, reported that depositions of C3 fragments were induced by IgG isolated from MG patients together with human serum and commercial AChR antibodies, respectively.37, 38
Prednisone and azathioprine are standard immunosuppressants in MG.39 Corticosteroids indirectly lower complement activation and blood levels of complement components, with effects varying depending on dose and therapy duration, whereas azathioprine does not seem to lower complement factors.40, 41 In line with previous data, we also did not find any difference in plasma complement activation product levels between MG patients with and without standard immunosuppression.14 The reduction of MAC observed in MG patients treated with azathioprine could be explained by the fact that azathioprine inhibits T-cell proliferation, thereby inhibiting the complement production by T-cells and antigen-presenting cells during cognate interactions.42 We observed the MAC deposition and ring structure of MAC enclosing AChRs after 0.5-h treatment of MG patient sera. According to a previous live cell imaging study of vesiculation in human erythroleukemic cells treated with purified human complement C9, the elimination of the MAC occurs within 5–10 min, a rapid process of outward and inward vesiculation.43 Further studies are needed to understand the precise mechanisms of action of the MAC in AChR+ MG.
This study has limitations. First, our MG cohort consisted of a relatively small group of patients, both with and without immunosuppression of different ages and sex. It is known that complement factors may change with both age and sex44, 45; however, we did not find any differences with sex or age in our cohort. Refractory AChR+ MG patients eligible for complement treatment are often on various immunosuppressive treatments; thus, our cohort is likely representative in that respect to those seen in clinical practice. Another limitation is that the disease duration and MGC scores varied considerably. Including non-MG disease controls would provide a more comprehensive view of discrimination between MG and non-MG disease patients. Finally, some samples were stored for long periods.
In summary, plasma C3a and sC5b-9 are promising biomarkers for further validation in MG in assessing complement activation. The visualization of MAC deposition proves that the complement cascade is activated on muscle cells after applying MG patient sera, suggesting the role of MAC in the observed AChR loss.
AUTHOR CONTRIBUTIONS
Yu-Fang Huang: Conceptualization; data curation; formal analysis; visualization; writing – original draft; methodology; validation; writing – review and editing. Kerstin Sandholm: Formal analysis; data curation; writing – review and editing. Barbro Persson: Conceptualization; methodology; writing – review and editing; validation. Bo Nilsson: Conceptualization; writing – review and editing; supervision. Anna Rostedt Punga: Conceptualization; data curation; formal analysis; writing – review and editing; project administration; supervision; resources; funding acquisition; investigation.
ACKNOWLEDGMENTS
This work was supported by the Erling Persson Foundation (#2022_0030 to ARP) and the Swedish Research Council (#2020_02040 to ARP). The authors acknowledge Dr Maria Lindskog for scientific discussions and Professor Tove Fall for statistical counseling.
CONFLICT OF INTEREST STATEMENT
The authors declare no conflicts of interest.
ETHICS STATEMENT
We confirm that we have read the Journal's position on issues involved in ethical publication and affirm that this report is consistent with those guidelines.
Open Research
DATA AVAILABILITY STATEMENT
Original data are available upon request by a qualified investigator in electronic format by the corresponding author.


