31P MRSI at 7 T enables high-resolution volumetric mapping of the intracellular magnesium ion content in human lower leg muscles
Abstract
Purpose
The non-invasive determination of the free magnesium ion concentration ([Mg2+free]) using 31P MRSI in vivo is of interest in research on various pathologies, e.g. diabetes. The purpose of this study was to demonstrate the potential of 31P MRSI at 7 T to enable volumetric, high-resolution mapping of [Mg2+free].
Methods
3D 31P MRSI datasets from the lower leg of three healthy volunteers were acquired at B0 = 7 T with a nominal spatial resolution of (8 × 8 × 16) mm3 in 56 min. Volumetric [Mg2+free] maps were calculated based on the quantified local chemical shift difference between the α- and β-resonance of adenosine triphosphate (ATP) considering also local pH values. Mean [Mg2+free] values from three different muscle groups were compared. To demonstrate the potential of reducing the measurement time, the analysis was repeated on the acquired MRSI data retrospectively reconstructed with fewer averages.
Results
The generated [Mg2+free] maps revealed local differences, and mean [Mg2+free] values of (1.08 ± 0.03) mM were found in the tibialis anterior, (0.91 ± 0.04) mM in the soleus and (0.98 ± 0.03) mM in the gastrocnemius medialis. The time-reduced 28-min scan resulted in comparable [Mg2+free] maps, and mean values being in agreement with the values from the 56-min scan.
Conclusion
31P MRSI at 7 T enables volumetric, high-resolution mapping of free magnesium ion content in human lower leg muscles. The measurement time of the 31P MRSI acquisition can be reduced to 28 min, opening the potential to apply volumetric [Mg2+free] mapping for the investigation of pathologies with altered magnesium homeostasis.
1 INTRODUCTION
The intracellular concentration of free magnesium ions ([Mg2+free]) is an essential biochemical parameter and plays a major role in numerous physiological processes. [Mg2+free] is known to be altered in various pathologies, e.g. diabetes, or Alzheimer's disease,1, 2 and is also object of research on numerous other diseases, e.g. migraine, Duchenne muscular dystrophy, and cancer.3-5 A non-invasive method to determine [Mg2+free] in vivo is phosphorus (31P) MR spectroscopy (MRS). Because Mg2+ ions form complexes with the 31P-containing compound adenosine-5′-triphoshate (ATP) and thus influence its resonance frequencies, the chemical shifts of ATP can be used as indirect measure for [Mg2+free]. Conventionally, and first reported by Gupta et al. in 1978, the chemical shift difference between the α- and β-resonance of ATP (δαβ) is used to determine [Mg2+free].6 Based on this approach, numerous 31P MRS and MRS imaging (MRSI) studies have been performed to determine [Mg2+free] in various organs,7-11 and some studies also proposed extended or differently developed approaches.4, 12-19
However, the low sensitivity of 31P led to low spatial resolutions of the generated [Mg2+free] maps in previous MRSI studies usually performed at clinical field strengths (1.5 or 3 T). To improve sensitivity, mostly surface coils were used yielding only limited volume coverage. Going to ultra-high fields (B0 ≥ 7 T) offers an alternative to increase the 31P sensitivity, and could open the potential to improve applicability of 31P MRSI for indirect magnesium imaging. The increase in signal-to-noise ratio (SNR) at higher fields combined with usage of a volume resonator could enable 3D 31P MRSI acquisitions with an increased spatial resolution yielding highly resolved volumetric [Mg2+free] maps. For the application to skeletal muscle for example, 3D 31P MRSI acquisition with high spatial resolution would allow the investigation of multiple muscle groups in one single measurement. Moreover, the increased SNR at higher fields could also be used to reduce the measurement time.
The purpose of this study was to demonstrate the potential of 31P MRSI at B0 = 7 T to enable volumetric, high-resolution mapping of the intracellular magnesium ion concentration [Mg2+free] in the human lower leg muscle. To this end, 3D 31P MRSI datasets from the whole lower leg muscle of three healthy volunteers were acquired with a nominal spatial resolution of (8 × 8 × 16) mm3 in a measurement time of 56 min. 3D [Mg2+free] maps were calculated based on the quantified local chemical shift difference δαβ, also taking into account the locally quantified pH value. Local differences of the calculated [Mg2+free] values were further investigated in a regions-of-interest (ROI) analysis comparing values from three different muscle groups, namely tibialis anterior (TA), soleus (Sol), and gastrocnemius medialis (GM). Furthermore, the potential for reducing the measurement time of this approach to a clinically more applicable timeframe was investigated by repeating the analysis on the acquired MRSI data retrospectively reconstructed with fewer averages.
2 METHODS
2.1 31P MRSI measurements
The lower legs of three healthy volunteers (one female/two male; age: 25–30 y) were examined on a 7T whole-body MR scanner (Magnetom 7T, Siemens Healthineers, Erlangen, Germany) using a circularly polarized, double-resonant 31P-1H birdcage coil (RAPID Biomedical, Rimpar, Germany; 26.5 cm inner diameter and 22 cm length). All examinations were approved by the local ethics committee of the Medical Faculty of the University of Heidelberg, and written informed consent was received from all subjects. One of the subject's lower legs was positioned centrally in the coil by elevating it marginally from the resting position by using a cushion. To reduce movements during the measurement, the leg was slightly fixed with cushions while taking care to avoid strong compression of the leg. A comfortable position for the volunteer was ensured, but no special efforts were made during the measurement to further control the subject's state.
31P MRSI data of the lower leg were acquired using an acquisition-weighted 3D CSI sequence with the following parameters: matrix size = (24 × 24 × 16), nominal spatial resolution = (8 × 8 × 16) mm3, TR = 240 ms, α = 20°, Δf = 5000 Hz, 1024 time points; Hamming-weighted k-space acquisition with 16 averages in k-space center. The total acquisition time was 56 min. The entire protocol, i.e. positioning of the subject, B0 shimming, acquisition of morphological 1H images and 31P MRSI, took approximately 75 min.
2.2 Data processing
Reconstruction, post processing and evaluation of the acquired 31P MRSI datasets were performed using MATLAB 2020a (The MathWorks, Natick, MA, USA).
To assess the potential for reducing the measurement time of such acquisitions, the acquired 56-min scans from all volunteers were additionally reconstructed using only six central k-space averages while maintaining the shape of the Hamming-weighting. These datasets simulate scans with a reduced measurement time of 28 min and are in the following referred to as the 28-min scans. Hence, for each volunteer two MRSI datasets were processed and investigated: first, the complete 56-min scan, and second, the retrospectively time-reduced 28-min scan.
In a supplementary analysis, an even further reduction to 21 min (reconstruction with only four central k-space averages) in combination with the application of the “moderate low-rank denoising” approach20 to partly compensate for the SNR loss, was investigated (see Supporting Information S2, which is available online). Note, that no denoising was applied for the 56-min and 28-min scans.
All MRSI datasets were processed by one-fold spatial zero-filling resulting in a matrix size of (48 × 48 × 32), and application of a 10-Hz Gaussian filter in the time domain. Evaluation of the 31P spectra was performed in two steps using the home-built MATLAB implementation of the AMARES algorithm21 as described in section 2.3 of Korzowski et al.20 Amplitudes, frequencies, and linewidths were quantified for the following six metabolites: phosphocreatine (PCr), the three resonances of ATP, inorganic phosphate (Pi) and glycerophosphocholine (GPC). All metabolites were modeled as singlets with Gaussian lineshape.
2.3 Calculation of free magnesium ion concentration [Mg2+free] maps
The local chemical shift differences δPi-PCr and δαβ were obtained from the quantification results of the individual localized spectra, and applied voxel wise to Equations (1) and (2) to yield volumetric pH and [Mg2+free] maps for each dataset and volunteer. For visualization purposes, all maps were masked to show only voxels in muscle tissue. As criterion, a minimal PCr amplitude was chosen.
2.4 ROI analysis
To compare pH and [Mg2+free] values from different muscle groups, 3D ROIs were defined for the TA, Sol, and GM in the Medical Imaging Interaction Toolkit25 using morphological 1H images. Mean values and standard deviations for pH and [Mg2+free] were calculated for each dataset and volunteer individually (subject mean values), as well as across all volunteers (study population mean).
3 RESULTS
3.1 Spectral quality
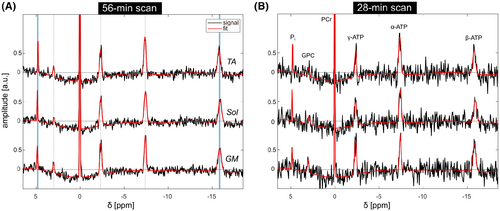
In all volunteers, the 56-min scan yielded localized 31P MR spectra of high quality, enabling the robust quantification of all detectable metabolites across the whole measured volume (representatively shown for three voxels from the dataset of volunteer 2; Figure 1A). The localized spectra from the retrospectively time-reduced 28-min scan (Figure 1B) show an approximately 1.8-fold lower SNR compared to the 56-min scan. However, also in the 28-min scans from all volunteers the spectral quality was sufficient for the quantification of all metabolites.
3.2 3D [Mg2+free] mapping
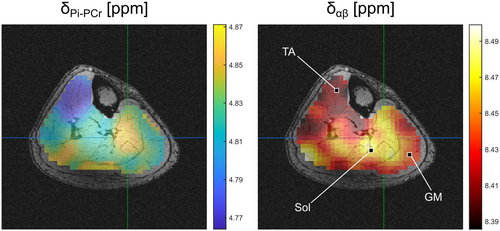
The quantified spectra revealed spatial variations in the B0-shift corrected chemical shifts of β-ATP and Pi. For all volunteers, the largest difference is observed between the muscle groups TA and Sol (indicated as blue-shaded area in Figure 1A). The generated δαβ- and δPi-PCr-maps (Figure 2) show local differences of these chemical shifts of up to 0.1 ppm. The large variation in δPi-PCr across the lower leg is assumed to be mainly attributed to differences in local pH values and demonstrates the necessity to incorporate the local pH value into the calculation of [Mg2+free] (see Equation 1).
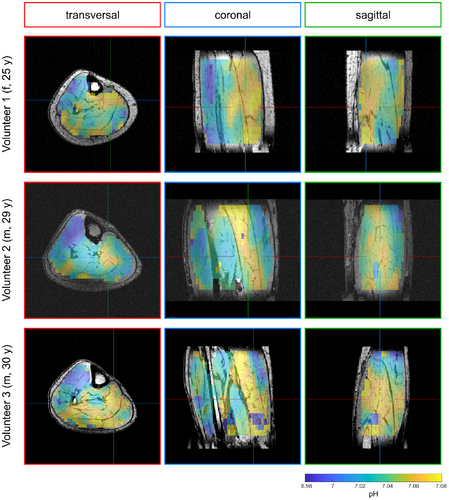
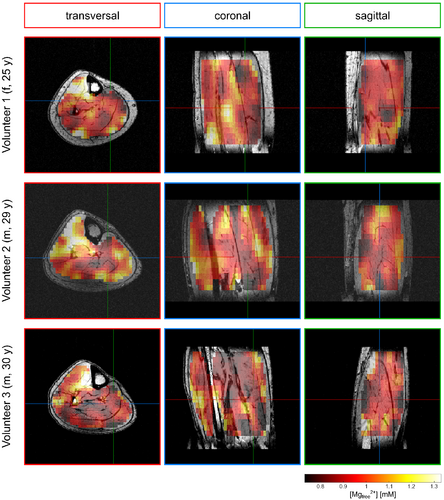
In the calculated 3D maps of pH and [Mg2+free] from the 56-min scan (Figures 3 and 4), differences of up to 0.1 pH units and 0.55 mM [Mg2+free] can be observed between individual muscle groups. Due to the high resolution, locations of larger pH gradients match well the edges of muscle groups visible on the morphological images (i.e., in the coronal view of the pH maps; Figure 3). The same applies to the [Mg2+free] maps (Figure 4), but with a slightly different pattern compared to the pH maps.
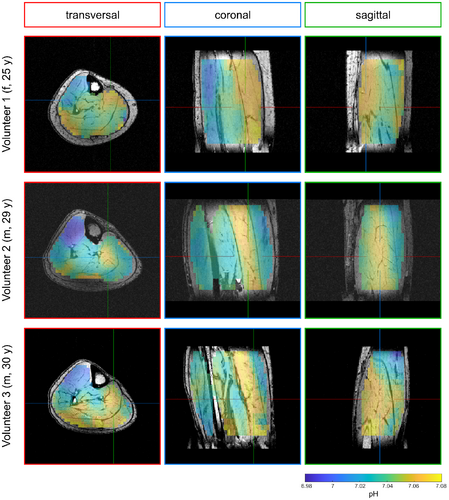
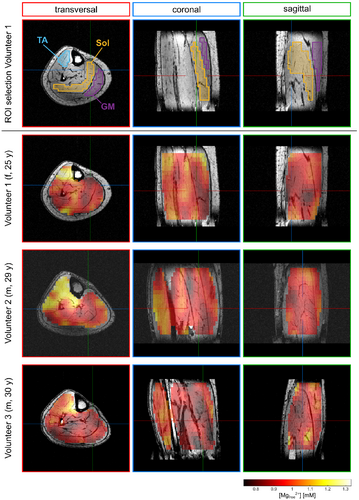
The pH and [Mg2+free] maps resulting from the 28-min scan (Figures 5 and 6) show overall comparable patterns as the maps from the 56-min scan. For pH (cf. Figures 3 and 5), only minor differences between the 28-min and 56-min scan are observable. In the [Mg2+free] maps from the 28-min scan (Figure 6), some areas show more extreme values compared to the maps from the 56-min scan (Figure 4). However, the trend of higher and lower values in the individual muscle groups is the same for both scans.
The patterns in the maps from the supplementary analysis of the 21-min scan with additional denoising (Supporting Information Figures S1 and S2) also match well the patterns of the maps from the complete 56-min scan, and compensate well for outliers. However, the contrast is partly lost (i.e. in the TA, see Supporting Information Figures S1 and S2).
3.3 ROI analysis
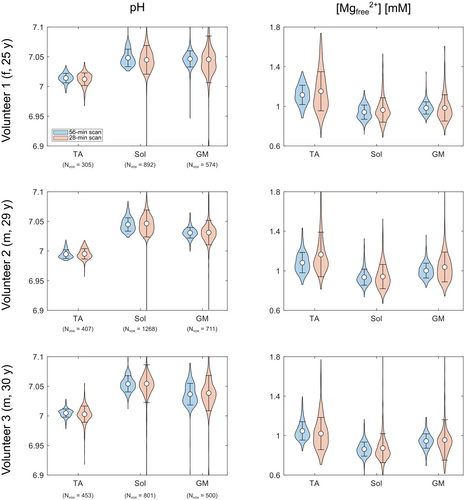
For all volunteers, the ROI analysis of the complete 56-min scan (Figure 7, blue color) shows differences in pH (left column) and [Mg2+free] values (right column) between the investigated muscle groups. In the TA, the pH value is clearly lower than in the Sol and the GM, whereas the [Mg2+free] value is elevated. When comparing the Sol and the GM, a slight trend towards higher pH and lower [Mg2+free] in the Sol can be observed for all three volunteers. These differences are also found in the study population mean values (Table 1). The TA shows the highest [Mg2+free] value, followed by the GM and the Sol with the lowest value.
| TA | Sol | GM | ||
|---|---|---|---|---|
| pH | 56-min scan | 7.00 ± 0.01 | 7.05 ± 0.01 | 7.04 ± 0.01 |
| 28-min scan | 7.00 ± 0.01 | 7.05 ± 0.01 | 7.04 ± 0.01 | |
| [Mg2+free] [mM] | 56-min scan | 1.08 ± 0.03 | 0.91 ± 0.04 | 0.98 ± 0.03 |
| 28-min scan | 1.11 ± 0.08 | 0.93 ± 0.05 | 0.99 ± 0.04 |
The described trends for the 56-min scan are also preserved in the ROI analysis of the retrospectively time-reduced 28-min scan (Figure 7, red color). For each volunteer, the pH and [Mg2+free] subject mean value from the 28-min scan (Figure 7, red color) agrees with the corresponding subject mean value from the 56-min scan (Figure 7, blue color). The calculated SDs (black whiskers) from the 28-min datasets are clearly higher than the ones from the 56-min scan, due to the larger fluctuations of values, already observed in the qualitative investigation of the maps (see section 3.2). The study population mean values for pH and [Mg2+free] from the 28-min scan agree with the study population mean values from the 56-min scan (Table 1).
Together with the qualitative investigation of the generated maps, the ROI analysis demonstrates the potential of reducing the measurement time of the 31P MRSI acquisition by a factor of 2 while preserving the overall trend of results (i.e. different pH and [Mg2+free] values in the different muscle groups).
The ROI analysis of the denoised 21-min scan (Supporting Information Figure S4) showed a good agreement of mean pH and [Mg2+free] values between 21-min and 56-min scan for the Sol and the GM. However, in the TA, a bias of higher pH and lower [Mg2+free] values was found for the denoised 21-min scans.
4 DISCUSSION
In this study, we obtained volumetric, highly resolved maps of pH and [Mg2+free] in the lower legs of three healthy volunteers using 31P MRSI at 7 T. In particular, the increased 31P sensitivity at 7 T enabled achieving a high spatial resolution of [Mg2+free] maps without the need for a surface coil. Due to the small achieved voxels with an effective volume of approximately 3 mL, a reliable assignment of spectra to individual muscle groups could be achieved, revealing local differences of pH and [Mg2+free] values. Moreover, the improved chemical shift dispersion at higher fields enhances the precision of the quantified chemical shifts. The increase in sensitivity of 31P MRSI at ultra-high fields may also foster the applicability of indirect [Mg2+free] mapping for clinical research. To demonstrate the potential of reducing the measurement time of this technique to a more clinically applicable timeframe, retrospectively reconstructed datasets with less averages simulating a measurement time of only 28 min were created for all volunteers. In the resulting maps from the time-reduced datasets the overall trend of pH and [Mg2+free] values is preserved and the ROI analysis yielded the same results as the complete 56-min scans.
4.1 Observed local chemical shift differences
The observed local differences of the calculated [Mg2+free] values result from the local differences of δαβ (Figure 2), which are prone to quantification errors. Considering the raw precision of the measurement itself, i.e. estimated as halve the spectral resolution in the noiseless case, being approximately 0.02 ppm, concentration differences of larger than ± 0.15 mM can be reliably distinguished (calculated for [Mg2+free] = 1.4 mM, which is the worst case, as the error increases for larger [Mg2+free]). Given the noise level in the 56-min scan, Cramér-Rao lower bounds (CRLBs) of ∼0.01 ppm were found, making it reasonable to use the raw measurement precision for a coarse uncertainty estimation. For the 1.8 times higher noise level in the 28-min scans, the CRLBs are still in the region of the measurement precision (CRLBs increase linearly with noise level), such that it is again plausible to apply the upper limit of ± 0.15 mM for the quantification of [Mg2+free] in all measurements.
Concerning the influence of quantification errors of the chemical shifts on the pH value, errors of 0.02 ppm on δPi-PCr result in an error of ± 0.03 pH units. However, this propagates only slightly to the calculation of [Mg2+free] (± 0.015 mM, one magnitude smaller than the error due to an error on δαβ) and can be assumed to be neglectable.
Thus, one can assume that local differences larger than 0.03 pH units, and 0.15 mM [Mg2+free] can be distinguished in our measurements. In the 3D ROI analysis of the individual volunteer measurements (Figure 7) and of the study population mean values (Table 1), differences between the TA and the Sol of ∼0.05 pH units and ∼0.17 mM [Mg2+free] were observed. Given the considerations above and the fact that the 3D ROIs were quite large (300–1200 voxels), one can assume these differences between different muscle groups to be real and not due to quantification uncertainties.
However, intra-muscular differences, i.e. voxelwise differences, as partly seen in the calculated maps (Figures 3-6), cannot be reliably approved in this manner, but the patterns in the pH and [Mg2+free] maps show the same trends in all volunteers, as well as across all subjects. This hints toward the assumption that also slight intra-muscular differences are present, e.g. in the Sol, which is a large muscle, or the TA, where differences in the oxidative capacity in proximo-distal direction were found previously.26 In a supplementary analysis of potential differences of pH and [Mg2+free] values in the TA in proximo-distal direction (see Supporting Information S3) some differences can be seen, but no clear trend, i.e. a gradient in one direction, was observed.
The conclusion that the observed local differences are real, is further supported by similar observed structures in pH and [Mg2+free] maps. A mutual effect on the pH and [Mg2+free] calculation is unlikely, as the shift differences of δαβ and δPi-PCr are opposing. The downfield shift of β-ATP in the TA (compared to Sol and GM) could be explained by either an increased [Mg2+free] value or an increased pH value (increasing pH results in a downfield shift of ATP-resonances22). An increased pH value would however be reflected in a downfield shift of δPi, which is contradicted by the observation (see Figure 1, δPi is shifted upfield in the TA compared to Sol and GM). Consequently, the herein observed local differences in calculated [Mg2+free] values are unlikely to be explained by pH differences, which is further supported by findings in Reyngoudt et al.4 comparing [Mg2+free] values calculated with pH values determined by 31P and 1H MRS. Moreover, the opposing chemical shift differences of δαβ and δPi-PCr would also explain the nearly constant chemical shift difference of γ-ATP in all muscle groups. As the resonance of γ-ATP is known to be stronger influenced by pH than the resonance of α and β,22 the opposing effects on the chemical shift of γ-ATP due to pH and [Mg2+free] could possibly balance each other out, resulting in the same δγ, although the physiological conditions in the individual muscle groups are presumably different.
These considerations strongly support the idea that the observed local differences of δPi and δαβ are resulting from different physiological conditions, for example, different muscle fiber compositions (oxidative vs. glycolytic fibers). Note, however, that different blood perfusion or oxygenation states due to compression of the leg in some parts cannot be excluded and might contribute to the observed differences, although care was taken during positioning and fixation of the subject's leg in order to avoid compression.
4.2 Comparison with other studies
To the best of our knowledge, this is the first study reporting volumetric, high-resolution [Mg2+free] maps from the lower leg of healthy volunteers, enabling the determination of [Mg2+free] values in various muscle groups within the same measurement. Compared to previous studies, this work was performed at a magnetic field strength of 7 T using a volume resonator and a 3D MRSI acquisition, thus allowing for a whole volume coverage and high spatial resolution. Due to the achieved small effective voxel size of about 3 mL, the obtained 31P MR spectra are less affected by partial volume effects, allowing for a reliable assignments of spectra to individual muscle groups, and reducing effects of tissue mixing on the [Mg2+free] quantification.
The herein determined [Mg2+free] values for the muscles TA, Sol, and GM in healthy volunteers show clear differences. The found difference between the Sol and GM is in accordance with the results from Widmaier et al.,10 who reported an 11 % lower value for [Mg2+free] in the Sol compared to the GM. However, the use of a surface coil at only one position in the study of Widmaier prevented the acquisition of [Mg2+free] values in the TA. [Mg2+free] values for the TA and the Sol and GM were reported in Reyngoudt et al.,4 however from multiple non-localized measurements using a surface coil enabling only a coarse localization of the acquired signal. In this study from Reyngoudt et al., no differences in [Mg2+free] values between different measured muscle groups were found, which is in contrast to our results, showing clear differences for the [Mg2+free] values in the TA, Sol, and GM. These finding might emphasize a potential benefit for performing localized acquisitions, also in terms of application to pathologies.
In general, the determination of [Mg2+free] using the ATP chemical shifts is a complex problem, which has been addressed in numerous studies since the first approach by Gupta et al.6 This first approach only involves the equilibrium reaction , characterized by the dissociation constant KD. Several studies extended this initial approach by including additional chemical species, which are involved in reactions with Mg and ATP, for example, [H+] or [K+].12-16, 27, 28 For all of these approaches aiming at the absolute quantification of [Mg2+free], the largest challenge is the need for accurate characterization of all equilibria involved (in terms of equilibrium constants).
Numerous studies on the lower leg muscles applying the approach by Gupta et al. used a value of 50 μM for the dissociation constant KD (some performed corrections for different temperatures and pH values) and reported [Mg2+free] values of (0.46–0.56) mM.7-10 In this work, the formula from Barker et al.17 was used for the calculation of [Mg2+free], which is based on the calculations from Golding and Golding.15 This approach takes into account four MgATP equilibria, also including the influence of the local pH value. In contrast to the cited studies above, Golding and Golding (and therewith Barker et al.) used a KD of 90 μM, which is the main reason for the higher [Mg2+free] values observed in this work compared to the cited previous studies.7-10 Using the lower value of 50 μM7-10 would lower the herein calculated values to 0.63 mM in the TA, 0.48 mM in the Sol and 0.53 mM in the GM (study population mean values from the 56-min scan), which would then agree with the previous reported values. The value of 90 μM from Barker et al. and Golding and Golding15, 17 is supported by findings in Malloy et al.29 and Zhang et al.,30 who reported values of 86 μM and 87 μM for KD.
Other studies using more complex approaches involving additional equilibria4, 13, 27 report [Mg2+free] values in the calf muscle of healthy volunteers of (0.45–0.56) mM, which are clearly lower than the results from our work with a study population mean value across all ROIs of (1.00 ± 0.14) mM. Finding a reason for this discrepancy is difficult due to the different approaches used in the latter cited approaches4, 13, 27 and our work, demonstrating the need for further investigation of the processes influencing the chemical shifts of ATP. In addition to pH and temperature,31, 32 also the influence of the ionic strength was discussed to be considered in the characterization of the involved equilibria necessary for the calculation of [Mg2+free] by means of 31P MRS.33
4.3 Clinical applicability
The measurement time of 56 min for the complete acquisitions in this study is not applicable for clinical studies on larger cohorts, but we showed the potential for reducing the measurement time of the 31P MRSI acquisition to only 28 min while maintaining the spatial resolution, and achieving comparable [Mg2+free] maps. Although the [Mg2+free] maps from the time-reduced 28-min scans show some differences to the maps from the 56-min scan, the overall patterns are comparable (compare Figures 3 and 5; and Figures 4 and 6), and the same results are obtained from the ROI analysis in both cases (Figure 7).
A further reduction of measurement time of the 31P MRSI acquisition to clinically relevant times of only 20 min is in principle possible, but requires a minimal SNR level to ensure fitting robustness. A possibility to increase the SNR is the application of denoising approaches to the acquired 31P MRSI datasets. With the supplementary analysis of the retrospectively time-reduced 21-min scans with additional denoising (see Supporting Information Figure S2) we showed, that it is in principle possible to achieve comparable pH and [Mg2+free] maps in a measurement time of 21 min. However, in the ROI analysis a bias of the calculated mean values (i.e., a trend toward the global mean pH and [Mg2+free]) is observed in some parts of the investigated volume (i.e., in the TA, see Supporting Information Figure S3), as it could be expected due to the application of the denoising approach.20 Still, this approach could be of interest for certain applications or research questions, for example, when investigating extremely large pH and/or [Mg2+free] differences. Nevertheless, when aiming at measurement times of 20 min, but with accurate results (i.e., no bias in the mean values in some parts of the volume), there is still the necessity for a further increase in SNR. A further possibility would be the application of nuclear Overhauser enhancement (NOE) techniques,34-36 but was not investigated in this study. As detection via a volume resonator is not optimal, another possibility to increase the acquired signal could be the use of a receiver array. In any case, one could also work with a slightly lower spatial resolution for the benefit of measurement time. Combining these gains in SNR could enable volumetric mapping of [Mg2+free] in a clinically feasible measurement time of 20 min with still reasonable spatial resolution. In addition to the application to tumors, this might be of interest also for the application to non-focal pathologies affecting the whole muscle, for example, diabetes or Duchenne muscular dystrophy,1-5 as the acquisition of localized spectra improves the [Mg2+free] quantification by reducing effects from tissue mixing or B0 inhomogeneities.
5 CONCLUSIONS
31P MRSI at B0 = 7 T enables the volumetric mapping of the free, intracellular magnesium ion concentration in the human lower leg muscles, with a nominal spatial resolution of (8 × 8 × 16) mm3. The acquired 3D high-resolution maps of the lower leg muscles of three healthy volunteers revealed local differences in calculated [Mg2+free] values, most likely resulting from physiological differences of the investigated muscle groups.
Moreover it could be shown, that the acquisition duration could be reduced to a more clinically relevant timeframe, allowing for 3D high-resolution mapping of [Mg2+free] in 28 min. This method might have the potential to obtain novel insights into disease processes involving deregulated magnesium homeostasis, e.g. in diabetes or muscular deficiencies.


