Loss of KANSL3 leads to defective inner cell mass and early embryonic lethality
Abstract
e–Lysine acetylation is a prominent histone mark found at transcriptionally active loci. Among many lysine acetyl transferases, nonspecific lethal complex (NSL) members are known to mediate the modification of histone H4. In addition to histone modifications, the KAT8 regulatory complex subunit 3 gene (Kansl3), a core member of NSL complex, has been shown to be involved in several other cellular processes such as mitosis and mitochondrial activity. Although functional studies have been performed on NSL complex members, none of the four core proteins, including Kansl3, have been studied during early mouse development. Here we show that homozygous knockout Kansl3 embryos are lethal at peri-implantation stages, failing to hatch out of the zona pellucida. When the zona pellucida is removed in vitro, Kansl3 null embryos form an abnormal outgrowth with significantly disrupted inner cell mass (ICM) morphology. We document lineage-specific defects at the blastocyst stage with significantly reduced ICM cell number but no difference in trophectoderm cell numbers. Both epiblast and primitive endoderm lineages are altered with reduced cell numbers in null mutants. These results show that Kansl3 is indispensable during early mouse embryonic development and with defects in both ICM and trophectoderm lineages.
1 INTRODUCTION
Mammalian embryonic development is initiated only after a sperm successfully fertilizes an egg which triggers signaling molecules to release eggs from meiotic metaphase II arrest (Lorca et al., 1993; Marikawa & Alarcón, 2009). Upon fertilization, the newly formed zygote prepares for cleavage divisions. Soon after the first cell division, mouse embryos initiate zygotic genome activation and degrade maternal gene products (Ferreira & Carmo-Fonseca, 1997; Tadros & Lipshitz, 2009). Early cleavage stage blastomeres have the capacity to give rise to individual organisms, making them totipotent, which is retained through the 8-cell morula stage (J Rossant, 1976). As the embryo progresses through additional cell divisions, compaction occurs wherein blastomeres lose their distinct boundaries and express specialized cell junction proteins to become compacted (Nikas et al., 1996; Sutherland & Calarco-Gillam, 1983). At the ~16 cell stage, mouse embryos begin to form a small blastocoel cavity with subsequent cell division and initiate the first lineage differentiation (Janet Rossant & Tam, 2009). The embryo begins to expand into a blastocyst as the first two cell lineages are defined—the inside tightly compacted inner cell mass (ICM) cells and the outer epithelial layer, the trophectoderm (TE) (Palmieri et al., 1994). The ICM expresses pluripotent stem cell markers such as SOX2 and OCT4 and is capable of giving rise to the fetus and some extraembryonic lineages, whereas trophectoderm expresses distinct transcription factors such as CDX2 and gives rise solely to extraembryonic derivatives (Keramari et al., 2010; Palmieri et al., 1994; Strumpf et al., 2005). At the mid-late blastocyst stage, the ICM undergoes a second lineage differentiation, giving rise to epiblast and primitive endoderm. NANOG expressing epiblast cells will form the entire embryo proper whereas SOX17 expressing primitive endoderm cells are an ICM-derived extraembryonic cell lineage that gives rise to yolk-sac (Kang et al., 2017; Yamanaka et al., 2010). The oocyte and preimplantation embryo are surrounded by a layer of glycoproteins that crosslink to form the zona pellucida (Wassarman & Litscher, 2008). Embryos expand at approximately embryonic day 3.5 (E3.5) eventually hatching out of the zona pellucida to implant in the uterus by invading the maternal endometrium. This initiates the process of decidualization by maternal stromal cells dividing rapidly to surround the invading embryo (Armant, 2005).
The pre-implantation embryo undergoes many epigenetic changes throughout early development (Marcho et al., 2015). It is well established that specific histone modifications are correlated with either active or repressive chromatin and corresponding gene expression. Several different histone modifications have been studied including methylation, acetylation, phosphorylation, and ubiquitination. These modifications are mediated by many different complexes, largely defined by in vitro studies (Strahl & Allis, 2000). Hence, it is essential to study these complexes and their protein subunits in vivo.
One such complex is the well-conserved nonspecific lethal (NSL) complex that mediates histone acetylation of different lysine residues. In human cell line THP-1, KAT8 functions in a complex-dependent manner. As a part of the MSL complex, KAT8 acetylates H4k16ac, whereas as a part of the NSL complex, it catalyzes H4K5ac and H4k8ac (Radzisheuskaya et al., 2021). The NSL complex is composed of four cores and several other ancillary members. One of the core proteins is the KAT8 regulatory NSL complex subunit 3 (KANSL3) protein (Sheikh et al., 2019). The catalytic subunit of this complex is KAT8 (also known as MOF), which is responsible for mediating the acetylation of several lysine residues of histone H4. When MOF is knocked out, mouse embryos develop into blastocysts, and although they hatch out of the zona pellucida, they fail to properly implant or develop further (Thomas et al., 2008). The knockout of another noncore NSL member, Mcrs1, also causes early embryonic lethality at peri-implantation development stages (Cui et al., 2020).
Kansl3 has been shown to be involved in many different cellular processes. In drosophila, the majority of loci bound by NSL members including NSL3 (an ortholog of Kansl3 gene) are constitutively active genes (Lam et al., 2012). This same finding holds true in mouse embryonic stem cells and neuronal progenitor cells where KANSL3 and other members of the NSL complex bind to constitutively expressed genes (Chelmicki et al., 2014). As mentioned earlier, MOF, which is the main catalytic unit of NSL, is required for H4K16ac and knockdown of Mof in Hela cells significantly decreases levels of H4k16ac (Taipale et al., 2005). It is also observed that in mouse blastocysts, depletion of MOF specifically affects H4k16 acetylation levels but not the levels of H4k5, -k8 and -k12 acetylation (Thomas et al., 2008). KANSL3 has also been shown to localize to spindle poles during mitotic division, and knockdown of Kansl3 causes mitotic defects in Hela cells (Meunier et al., 2015). In addition, MOF also binds to mtDNA and regulates the expression of respiratory genes, and this binding is dependent on KANSL3 (Chatterjee et al., 2016).
In this study, we use a knockout mouse model to investigate the role of Kansl3 in vivo. Our data indicate that Kansl3 is indispensable for proper lineage specification and maintenance during peri-implantation development and is essential for implantation in vivo, resulting in early embryonic lethality in the absence of Kansl3.
2 RESULTS
2.1 Kansl3 mutants fail to progress beyond E3.5 in vivo
We used a Kansl3 mutant allele that was generated at the Jackson Laboratory using CRISPR (clustered regularly interspaced short palindromic repeats) technology as schematized in Figure 1a. A deletion of 898 bp was made, removing exons 4–5 (ENSMUSE00000156007, ENSMUSE00000155996) and 621 bp of flanking intronic sequence of the Kansl3 gene beginning at Chromosome 1 position 36,357,760 bp and ending after 36,358,657 bp (GRCm38/mm10). (https://www.jax.org/strain/032942).
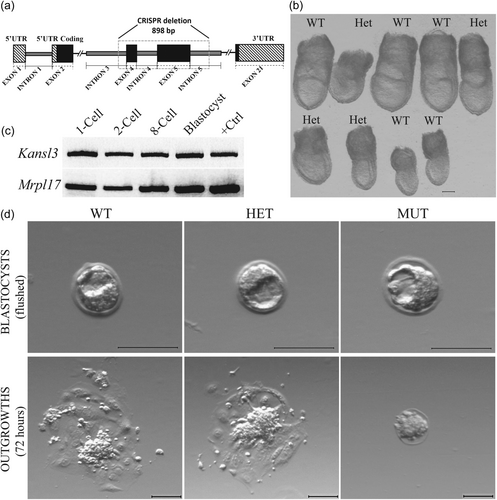
The International Mouse Phenotyping Consortium determined that while heterozygous Knockout Kansl3 animals were viable and fertile, no homozygous null mutants were present at embryonic day 9.5 (E9.5) (Dickinson et al., 2016). This indicates that the Kansl3 gene is essential for embryo survival before organogenesis. To determine the precise stage at which homozygous null mutants are present, timed matings of heterozygous intercrosses were dissected at E7.5. A total of 33 deciduae were dissected, and 29 embryos were recovered. No Kansl3 homozygous mutants (hereafter referred to as “mutants” or “null embryos”) were recovered, suggesting that Kansl3 null embryos fail to implant in vivo. A representative litter from a heterozygous intercross at E7.5 is shown in Figure 1b. Since mutants were not present at E7.5 we examined Kansl3 expression by RT-PCR during pre-implantation development. Kansl3 transcripts are present throughout at all stages examined (Figure 1c).
When litters from heterozygous intercrosses were dissected at E3.5, Kansl3 null mutants were present in expected Mendelian ratios (12/42 embryos). Homozygous null mutants at E3.5 appeared morphologically indistinguishable from their littermates (Figure 1d).
Although Kansl3 null mutants develop into normal-looking blastocysts, we sought to determine if these embryos can hatch from their zona pellucida and initiate implantation in vivo. As a substitute to this process, we performed in vitro outgrowth assays on timed heterozygous intercrosses. As shown in Figure 1d, wildtype and heterozygous littermates were able to hatch and form typical outgrowths composed of an ICM colony and large adherent cells attached to the culture dish derived from trophectoderm (TE) cell layer of the blastocysts. After 72 h (about 3 days) in culture, Kansl3 null mutants failed to hatch out of the zona pellucida and were evidently dying, no longer resembling blastocysts (Figure 1d, rightmost images). This indicates that the Kansl3 null mutants exhibit defective hatching and suggest dysfunctional or abnormal cell differentiation of early lineages.
2.2 Morphological defects in Kansl3 null mutants
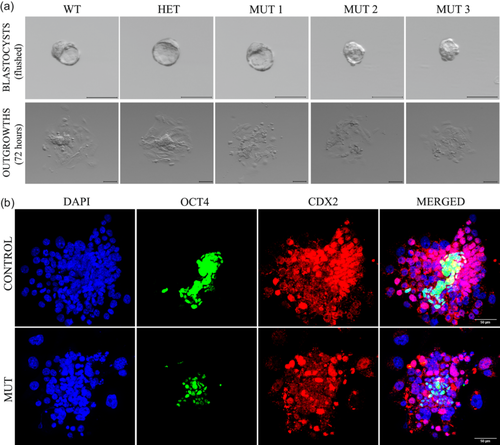
The null mutants fail to hatch and form an outgrowth under regular outgrowth conditions, which eventually causes embryonic lethality. Hence, we investigated if the Kansl3 null mutants have the potential to form normal outgrowths after assisted hatching by removal of the zona pellucida. Embryos from heterozygous intercrosses were collected at E3.5 and subjected to zona removal using acid Tyrode's solution (Garrisi et al., 1992). After ensuring that the zona pellucida layer is completely removed, embryos were incubated in regular outgrowth conditions for 72 h. It was observed that Kansl3 null mutants were able to form an outgrowth-like structure similar in size to that of their littermates, but mutant structures looked morphologically abnormal (Figure 2a). Mutant outgrowths displayed fewer and more dispersed cells with no apparent ICM colony and very few cells with obvious TE/giant cell morphology (Figure 2a). This was consistent with all the mutant outgrowths that were analyzed. To investigate further, immunofluorescence assays were performed on outgrowths using ICM and TE markers, OCT4 and CDX2, respectively (Palmieri et al., 1994; Strumpf et al., 2005). As seen in control outgrowth (Figure 2b, top panel), OCT4-positive cells form a clump surrounded by CDX2-high expressing cells. The giant nucleated cells that are TE-derived form the bottom layer of the control outgrowth. Mutant outgrowths have substantially fewer OCT4-positive cells. Some giant-nucleated cells are present in the mutant outgrowth and express low levels of CDX2. It is also obvious that there are fewer and more dispersed CDX2-high cells that surround the OCT4-positive cells in the mutant outgrowths. The absence of an obvious ICM and the reduced CDX2-high cells in mutant outgrowths suggested defects in ICM and TE lineages, respectively.
Therefore, to further examine lineage specification earlier in development, immunofluorescence assays were performed on E3.5 blastocysts using the ICM and TE markers, SOX2 and CDX2, respectively. A total of 18 control embryos and 13 mutant embryos were analyzed, and representative control and mutant embryos are shown in Figure 3a. When the number of cells from both lineages was quantified, we found that the number of SOX2-positive cells was significantly lower in mutant embryos (Figure 3b,c) whereas the number of CDX2-positve cells was the same (Figure 3d,e), without significant difference in total cell number (Figure 3f). These findings also indicate a decrease in the percent ICM cells and increase in percent TE cells in mutant blastocysts, suggesting that there is an ICM-specific defect at the blastocyst stage in Kansl3 mutants. CDX2 intensity levels were comparable in control and mutant cells, but when SOX2 intensity was measured in ICM cells, the level of SOX2 was significantly lower in mutants (62 cells from 5 embryos) compared to control littermates (135 cells from 8 embryos, Figure 3g), further suggesting ICM specific defects in the absence of Kansl3 function.
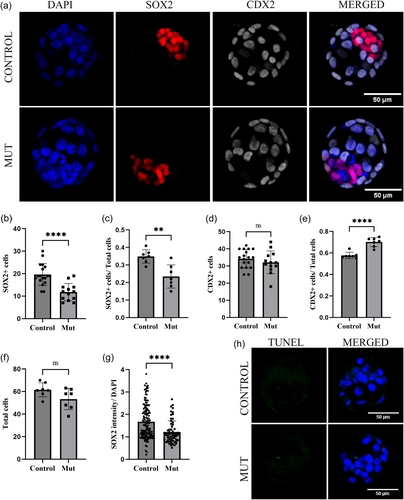
To determine if the reduced mutant ICM cell number was due to cell death, fluorescent whole-mount terminal deoxynucleotidyl transferase dUTP nick end labeling (TUNEL) assays were performed on E3.5 embryos. No significant cell death was detected in either control or mutant blastocysts, indicating that cell death is likely not the cause of decreased ICM cells ICM in Kansl3 mutants (Figure 3h).
2.3 Kansl3 mutants display defects in both EPI and PE lineages
To further understand the ICM lineage-specific defects, blastocysts were collected from heterozygous intercrosses at E3.5 and cultured in KSOM media for 24 h to allow them to expand and developmentally progress to observe ICM lineage differentiation of Epiblast (Epi) and Primitive Endoderm (PrE). Immunofluorescence assays were performed on these embryos using antibodies against NANOG and SOX17 as markers of epiblast and primitive endoderm lineages, respectively. A total of six control embryos and six mutant embryos were examined for both the markers (Figure 4d). When cell numbers were quantified, both lineages show a reduction in Kansl3 null mutants, compared to control littermates (Figure 4e,f). This is consistent with an overall reduction in ICM cells which indicates that both PrE and Epi lineages are affected in null mutants. These results show that although both epiblast and primitive endoderm can be specified in mutant embryos, there is a significant reduction in the number of cells in both the lineages.
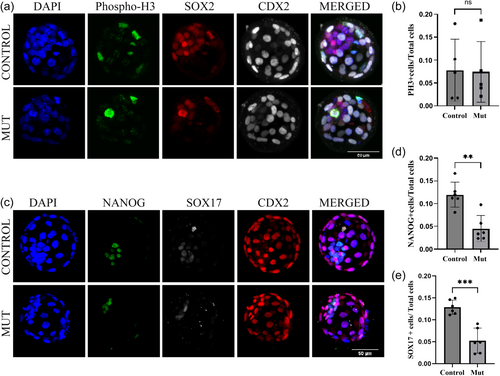
To investigate if this ICM-specific defect is arising from reduced proliferation and/or arrested cell division in Kansl3 mutants, we performed immunofluorescence against phospho-histone H3 (Figure 4c). As Kansl3 knockdown leads to prolonged arrest in a prometaphase-like state in Hela cells (Meunier et al., 2015), we hypothesized that cells in mutant ICM might be experiencing cell cycle arrest. Phosphorylation of histone H3 at serine-10 and serine-28 begins in the late G2 phase to early prophase and is important for cell-cycle progression (Crosio et al., 2002). Gradually these residues undergo dephosphorylation during anaphase to telophase transition. Hence, metaphase chromosomes are always positive for phosphorylated histone H3, while interphase cells show very low intensity. These analyses revealed no significant increase in PH3-positive cells in Kansl3 null mutants (N = 5) compared to control littermates (N = 5) (Figure 4e). This suggests that Kansl3 null mutants are not undergoing cell cycle arrest. However, it remains possible that mutant ICM has a slower cell cycle rate, which could explain the reduced ICM (and Epi/PrE) cell numbers in the absence of cell death.
2.4 H4k5ac is reduced in Kansl3 mutants
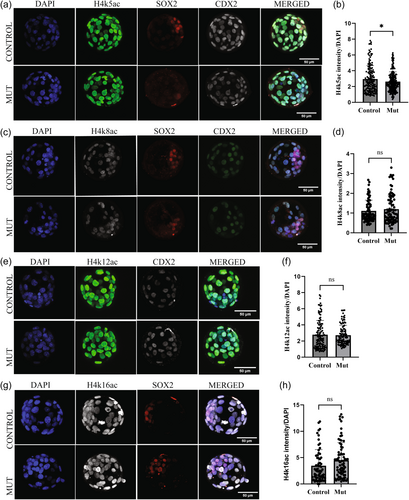
To investigate the role of KANSL3 in catalyzing acetylation of histone H4 at specific residues, we performed immunofluorescence with antibodies directed against H4k5ac, H4k8ac, H4k12ac, and H4k16ac (Figure 5). We quantified signals within the nuclei of individual cells and compared mutants to control littermates. These analyses revealed no significant difference in H4k8ac, H4k12ac, or H4k16ac (Figure 5c–h), but a significant reduction in H4K5ac (Figure 5a,b).
3 DISCUSSIONS
In this study, we show that Kansl3 is necessary for proper embryonic development during pre-implantation stages. Although Kansl3 mutant embryos look morphologically similar to control littermates at E3.5, they have reduced numbers of ICM cells with significantly reduced SOX2 protein levels. It is well established that a network of transcription factors involving Oct4, Sox2, and Klf4 that regulate many downstream targets is required to maintain the pluripotent nature of the ICM (Chen et al., 2008). Our results suggest that disruption of this network in the mutant ICM leads to improper lineage allocation and ICM/TE function at the time of implantation. As shown above, both epiblast and primitive endoderm lineage show a reduction in cell number. The trophectoderm lineage, on the other hand, displays no abnormal phenotype in Kansl3 mutant blastocysts. Kansl3 and other NSL members have been shown to occupy different sets of enhancers that are ES-cell specific and are essential for maintaining stem cell identity in ES cells (Chelmicki et al., 2014). Our results support the essential role of Kansl3 in maintaining ICM cell identity and corroborate the previously published data on Mcrs1, a member of the NSL complex (Cui et al., 2020).
Kansl3 null embryos fail to hatch out of the zona pellucida, resulting in no implantation in vivo and lethality. Even with assisted hatching through the removal of the zona pellucida, mutant embryos form abnormal outgrowths with a significant reduction in ICM cells as well as abnormal morphology of TE-derived cells. This suggests that Kansl3 may have roles during TE differentiation into trophoblast giant cells and other derivatives during implantation or, alternatively, that the mutant ICM is not signaling correctly to TE. Our current study evaluated embryos derived from heterozygous intercrosses. Therefore, we cannot rule out that there may be maternal Kansl3 transcripts and protein that allow for progression through cleavage stages. A conditional knock-out strategy will need to be employed to determine if Kansl3 is required for events before the blastocyst stage as well.
KANLS3 is present during all cell cycle stages in Hela cells and localizes to the spindle poles during mitosis. Kansl3 knockdown causes different spindle organization defects such as misaligned chromosomes, multipolar spindles, and delayed metaphase (Meunier et al., 2015). PH3 staining can be used to visualize cells in metaphase and anaphase (Crosio et al., 2002) but we did not observe an increase in cells arrested in these phases in mutant embryos. In MEFs Kansl3 knockout leads to nuclear abnormalities, most notably nuclear blebbing (Karoutas et al., 2019). In Kansl3 null mutants, we do observe some nuclear blebbing but quantifying these details was beyond the scope of our experiments. Unfortunately, attempts with several commercially available antibodies did not result in visualization/localization of KANSL3 pre-implantation embryos, which would have facilitated normal expression details of KANSL3 as well as morphological analysis of embryonic cells devoid of KANSL3 protein.
Each lineage within a blastocyst has specific transcriptional and epigenetic programs. Previous studies have documented the roles of different transcription factors during lineage segregation, but many of the epigenetic factors that are critical for these regulatory switches have not been well studied. As mentioned above, Kansl3 is a core member of NSL complex and is crucial for the recruitment of NSL complex to specific loci. (Lam et al., 2012) Previous findings have shown that Mof depletion in the human THP-1 cells line resulted in a significant reduction in H4k16ac, whereas depleting other core NSL members including Kansl3 did not show the same reduction (Radzisheuskaya et al., 2021). In mice, Mof knockout embryos exhibit a global reduction in H4k16ac and die during peri-implantation stages of development, with no reduction in H4k5ac, K4k8ac and H4k12ac levels (Thomas et al., 2008). Our findings support these results and show no changes in H4k8ac, H4k12ac, and H4K16ac levels, consistent with previous studies indicating that depletion of core NSL members alone does not perturb the global levels of H4K16ac. However, we do observe a significant reduction in K4k5ac, suggesting that this specific modification is mediated in part by KANSL3.
4 CONCLUSIONS
Epigenetic factors play a vital role in maintaining transcriptional output from genes in a cell-type and lineage-specific manner. Loss of Kansl3 elicits a lineage-specific defect in the ICM of mutant blastocysts. Although morphologically normal at the blastocyst stage, mutants exhibit significantly reduced ICM cell number as well as reduced SOX2 levels in ICM cells. The null mutant embryos continue to grow but lack the ability to further differentiate properly with reduced Epi and PrE cells. Null embryos fail to hatch out of the zona pelucida both in vivo and in vitro, leading to implantation failure and lethality. Kansl3 null embryos are partially rescued by the removal of zona pelucida layer, which allows outgrowths with abnormal ICM morphology and TE differentiation defects. These results enhance our understanding of epigenetic factors during early development and elucidate the critical role of KANSL3 in lineage determination during preimplantation development.
5 MATERIALS AND METHODS
5.1 Generation of Kansl3 mutants
All animal protocols and procedures were carried out in agreement with the approved guidelines set by the Institutional Animal Care and Use Committee of the University of Massachusetts, Amherst (2018-0003, 2548). Kansl3 KO allele was generated (C57BL/6NJ-Kansl3em1(IMPC)J/Mmjax) by the Knockout Mouse Phenotyping Program (KOMP2) at The Jackson Laboratory (JAX). A deletion of 898 bp was created in exon4 (ENSMUSE00000156007) and 5 (ENSMUSE00000155996) along with flanking intronic regions using CRISPR-cas9 gene editing tool. The Guide RNAs used were GAACTGTGGTGGAAGAGACG and CCGCAAGTCACAACAAATCA to create the 898 bp deletion.
5.2 Embryo recovery and genotyping
Natural mating was performed between heterozygous male and female animals, and the presence of a vaginal plug in the morning marked the embryonic day 0.5 (E0.5). Embryos were collected by flushing or dissecting female uteri at E3.5 or E7.5, respectively. Each individual E7.5 embryos were imaged and subjected to lysis buffer containing 10 mM Tris pH 8.0, 100 mM NaCl, 10 mM EDTA pH 8.0, 0.5% SDS, and 1% proteinase K for genotyping using PCR. For genotyping mice and embryos, we used the following primers (5′-3′): wildtype allele (forward: GGCGGAATTGGGACCAAAAG, reverse: ACTGCAGGGCTTTGAGGATC; 218 bp), mutant allele (forward: TGGGGACAATGTTGAGGCAA, reverse: TGCCTCTGCCTGTACAGTTC; 413 bp).
5.3 Embryos culture and outgrowth assay
For the outgrowth assay, blastocysts (E3.5) were collected from heterozygous intercrosses directly into pre-warmed (37°C) outgrowth media. outgrowth media is composed of the following: Dulbecco's modified Eagle medium (Lonza) containing 10% fetal bovine serum (Atlanta Biologicals), 1% GlutaMAX (Thermo Fisher Scientific), and 1% Penn-strep. The embryos were placed individually in an eight-well ibidi dish and incubated at 37°C in 5% CO2 condition. Imaging of the embryos was done on the day of collection of embryos and 72 h later when embryos formed the outgrowths. Each individual outgrowth was gently collected and subjected to a lysis buffer for genotyping using the primer pairs described in the earlier section.
For assisted hatching protocol, embryos were collected in prewarmed M2 media (EmbryoMax® M2 Medium, MilliporeSigma; MR-015-D). The embryos were then subjected to acid Tyrode's solution (MilliporeSigma; T1788) for 90 s, followed by rinsing the embryos again with acid Tyrode's for 30 additional seconds to make sure the zona pellucida layer was completely dissolved. The embryos were placed back in the M2 media for 30 s before individually placing them in outgrowth media for 72 h at 37°C in 5% CO2 condition. The embryos were imaged after treatment with acid Tyrode's solution and imaged again 72 h later when outgrowths were formed. Each individual outgrowth was gently collected and subjected to a lysis buffer for genotyping using the primer pairs described in the earlier section.
To allow the blastocysts to expand further upon collection at E3.5, embryos were cultured immediately after flushing them out of pregnant females in KSOM media (MilliporeSigma; MR-106-D) for 12–24 h at 37°C in 5% CO2 condition. These embryos were then fixed with 4% paraformaldehyde to be used in immunofluorescence assays. Fixing was performed on ice for 50–60 min followed by washing with 1× PBS solution before storing it at 4°C.
5.4 RNA extraction and RT-PCR analysis
RNA extraction on embryos was performed using the Qiagen RNA extraction kit. Wild-type embryos were collected at E0.5, E1.5, E2.5, and E3.5 and subjected to RNA extraction protocol. cDNA was synthesized using Bio-Rad iScript cDNA Synthesis (Bio-Rad; 1708890). The RT-PCR was performed on the newly synthesized cDNA using primers designed for Kansl3 mRNA sequence. Mrpl17 was used as the loading control. The following primer pairs were used (5′-3′): Mrpl17 (414 bp): CCATCTGCTGCGGAACTTG and CTTGCGTCCTGGTTATGGTG and Kansl3 (486 bp): CCAGGACAGATGCAGATGCT and GAGAACCAGGGAGCTTGCTT.
5.5 Whole-mount immunofluorescence
E3.5 embryos were collected from female uteri and fixed as described in the earlier section. The embryos were thoroughly washed using 1× PBS after fixation with 4% PFA. The embryos were then permeabilized using 1% triton X-100 made in 1× PBS for 10 min at room temperature, followed by thorough washing with 1× PBS/PVP solution. The embryos were then incubated in blocking solution (0.1%BSA, 0.01%, Tween20 in 1× PBS) containing 10 μg/mL FAB (Jackson ImmunoResearch; AB_2338476) for 60 min at room temperature. Embryos were then incubated overnight in primary antibodies of choice at 4°C. The embryos were thoroughly washed with blocking solution multiple times before incubating them in secondary antibodies of interest at room temperature for 60 min. The embryos were again thoroughly washed with blocking solution, followed by a brief incubation with DAPI for 3 min. Embryos were subjected to washing with blocking solution before placing them individually in eight-well ibidi dish. Embryos were washed for 5 min in PBS and then imaged with a Nikon Eclipse Ti Series inverted microscope with a C2 confocal attachment. These embryos were then lysed and genotyped. A similar protocol was followed for outgrowth immunofluorescence.
The primary antibodies used are as follows: Rabbit anti-OCT4 (Abcam Cat# ab200834, RRID:AB_2924374, 1:200); mouse anti-CDX2 (BioGenex Cat# MU392A, RRID:AB_2923402, 1:100); rabbit anti-CDX2 (Abcam Cat# ab76541, RRID:AB_1523334, 1/500); goat-anti SOX2 (R and D Systems Cat# AF2018, RRID:AB_355110, 1:200); rabbit anti-NANOG (ReproCELL Incorporated Cat# RCAB0002P-F, RRID:AB_2616320, 1:500); goat anti-SOX17 (R and D Systems Cat# AF1924, RRID:AB_355060, 1:200); rabbit anti- Histone H3 (phospho S10) (Abcam Cat# ab5176, RRID:AB_304763, 1:200); mouse anti-H4K16ac (Thermo Fisher Scientific Cat# MA5-27794, RRID:AB_2735098, 1:150); Rabbit anti-H4K5ac (Thermo Fisher Scientific Cat# MA5-32009-25UG, RRID:AB_2866507, 1:200), Mouse anti-H4K8ac (Thermo Fisher Scientific Cat# MA5-31553, RRID:AB_2787181, 1:200), Rabbit anti-H4K12 (Active Motif Cat# 39927, RRID:AB_2793396, 1:250).
The secondary antibodies used are as follows: Alexa Fluor 488 donkey anti-rabbit IgG (Molecular Probes; A21206, 1:500); Alexa Fluor 546 donkey anti-mouse IgG (Molecular Probes; A10036, 1:500); Alexa Fluor 647 donkey anti-goat IgG (Invitrogen; A-21447, 1:500); Alexa Fluor 647 donkey anti-mouse IgG (Molecular Probes; A31571, 1:500); Alexa Fluor 546 donkey anti-goat IgG (Molecular Probes; A11056, 1:500).
5.6 TUNEL staining
E3.5 embryos were fixed and permeabilized using the above-described protocol. TUNEL staining was performed using the In Situ Cell Death Detection Kit (11684795910; Roche) according to the manufacturer's protocol. The embryos were then subjected to a lysis buffer for genotyping.
5.7 Measurements and statistics
The measurements were performed through manual counting through the entire embryo. The statistical analysis on different measurements was performed using a prism graph pad. The intensity measurement was performed using Nikon NIS-elements general analysis. Unpaired student's t-test was used to test the difference between two groups using Prism GraphPad, and a p-value < 0.05 was considered for statistical significance.
AUTHOR CONTRIBUTIONS
Ashmita Chander: Conceptualization; investigation; methodology; writing—original draft; writing—review & editing. Jesse Mager: Conceptualization; writing—review & editing; funding acquisition; supervision; resources.
ACKNOWLEDGMENTS
This work was supported by the National Institutes of Health HD083311 to Jesse Mager.
Open Research
DATA AVAILABILITY STATEMENT
Data sharing is not applicable to this article as no datasets were generated or analyzed during the current study.


