Combined effect of prestrain history and strength mismatch on crack tip constraints in welded specimen
Abstract
Plastic predeformation (prestrain) in pipe reeling process not only influences the steel yield and flow properties but also reduces fracture toughness. In this work, a combined effect of prestrain history and weld strength mismatch on the crack tip constraint was investigated. Three prestrain histories and three mismatch levels were considered. A four-parameter approach (crack tip opening displacement [CTOD], Q, P, and M) was employed to characterize the crack tip constraint levels. The study addressed an evaluation procedure for the fracture resistance in mismatched welded joints under different prestrain levels using CTOD values. Furthermore, it illustrates the interaction including prestrain histories and strength mismatch effect. The findings indicated that the constraints of prestrain history and overmatch degree are positive for the same crack tip opening displacement level. The crack tip stress field was more significantly influenced by the strength mismatch than the prestrain history in examined cases.
1 INTRODUCTION
During the process of steel pipelines reeling or installing, a major section of pipes is bent into a reel or straightened in a span repeatedly. Therefore, the pipelines movement of peel-lay method would give rise to elastically relax and plastic deformation (prestrain). Some mechanical properties are improved greatly with the occurrence of plastic deformation due to subsequent strain behavior, such as the intensity of yield strength and work hardening capacity.1, 2 However, it also exerts some detrimental effects on the material properties, such as the decrease of fracture toughness and the reduction of fatigue life.3, 4 Thus, understanding of the prestrain effect for welded joints is critical for the assessment of pipelines structure integrity.
Some studies3-5 reported that prestrain history may lead to some degradation of fracture toughness for the overmatched weldments. In contrast, the undermatched weldments may exert the strain localization during fracture processing. To avoid negative effects from the plastic deformation, prestrain history effects in mismatched welded joints on ductile fracture behaviors and crack tip fields are investigated by crack resistance curves,6 crack tip stress fields,7 or constraint-based approaches.8 It needs a bridge to establish the relationship between material properties, geometry, loading modes, and some fracture characteristic parameters, such as J integral, crack tip opening displacement (CTOD), and notch mechanics parameters. As for the homogenous materials, J-Q two-parameter equation9 is widely used to assess the effects of geometry and loading constraint on ductile fracture. In addition, J-Q-M formulation9 as the extending form of J-Q formula is employed to illustrate the material heterogeneity in ductile fracture. Moreover, the three-parameter CTOD-Q-R is chosen to characterize crack tip constraint induced by the residual stress.10
However, limited literatures have studied the combined effects of prestrain history and strength mismatched effect on welded joint specimens. In this study, the objectives of the investigation are twofold. Emphasis is made on the effects of prestrain and mismatched on ductile crack growth resistance in the pipeline steels welded joints under a symmetric prestrain cycle. Additionally, the combined and separated effects of prestrain history and mechanical mismatch on crack tip constraints were analyzed and compared from the coupled simulation models by CTOD-Q-M-P four-parameter formulation.
2 PRESTRAIN EFFECT MODEL, CRACK TIP CONSTRAINTS, AND NUMERICAL PROCEDURE
2.1 Crack tip constraints
 (1)
(1) (2)
(2) is the reference stress field control by the loading, and
 is another field. The first term is determined to describe the J-dominant HRR stress field by the modified boundary layer (MBL) model.
 (3)
(3) (5)
(5)In this paper, the effects of material mismatch and prestrain history on fracture toughness, crack tip stress fields, and constraints are investigated simultaneously by SENT models.
2.2 Finite element framework
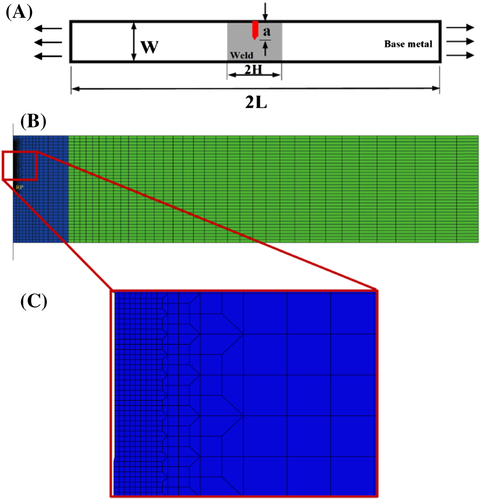
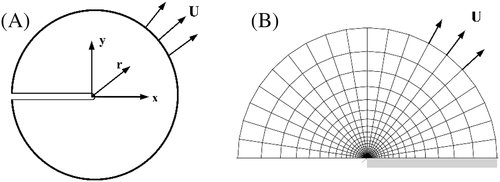
The typical 2-D finite element model of SENT specimens with weld strength mismatch is presented in Figure 1. Half plane of models for analyses have 6500, 2-D bilinear plane strain quadrilateral elements with line constraints imposed on nodes considering the symmetry of geometry. The idealized weld zone (fusion line is vertical to specimen length) is considered into the ductile fracture models. The crack with an initial blunt distance 0.02 mm is assumed as the crack-tip located on the center of the model, described in Figure 2A. The initial crack size of welded zone is set as a/W = 0.17. In addition, surface-to-surface contact between a rigid plane and symmetrical plane is defined in the interaction module of ABAQUS in order to realize the compression process of half model. It is noticed that the heat-affected zone is not taken idealized welded joints into account.
 (6)
(6) (7)
(7)By using these boundary conditions, the combined prestrain and mismatch constraints of SENT specimens is investigated.
2.3 Materials
 (8)
(8) (9)
(9)| Material | Yield Stress, MPa | Mismatch Factor, M | Young's Modulus, GPa | Poisson's Ratio |
|---|---|---|---|---|
| BM | 612 | 1 | 200 | 0.3 |
| OM1 | 716 | 1.17 | 200 | 0.3 |
| OM2 | 814 | 1.33 | 200 | 0.3 |
| OM3 | 918 | 1.5 | 200 | 0.3 |
3 RESULTS AND DISCUSSION
3.1 Nominal stress-strain curves of different conditions
During actual reeling processing in industries, it may occur many prestrain cycles or nonproportional tension-compression loading for the steel pipelines. In this study, a typical symmetrical prestrain cycle history was conducted in FE models. More specifically, the prior tension loading was applied and then the same displacement was compressed. Prestrain history could be analyzed by characterizing the remote displacement varieties (as nominal strain). Four prestrain cycle levels were taken the SENT models into consideration, which were 0%, 0.2%, 0.3%, and 0.4%. In addition, the mismatch effect was studied by various mismatch ratios (M), which were 1, 1.17, 1.33, and 1.5. It should be noticed that the geometry effect on crack tip constraint is not considered in this research. For all the analyses, the prestrain cycle history started with tension loading. Figure 3A shows that the hysteresis loop increases gradually with the increase of prestrain in. Figure 3B shows the results from four cases of different mismatched ratios under 0.4% prestrain value. With the increase of mismatch ratio, the hysteresis loop tended to narrow down with a same prestrain amplitude. The phenomenon could be explained by the improvement of fracture resistance in overmatched welds.
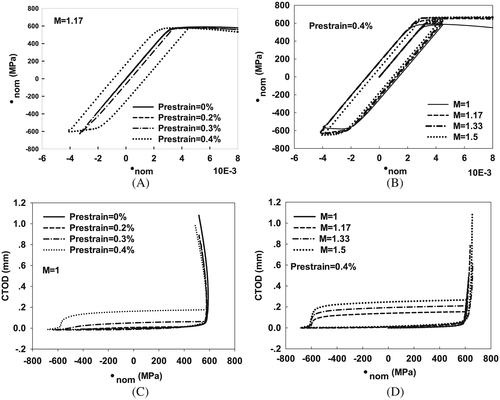
Figures 3C and 3D show CTOD and nominal stress relationships by different prestrain levels and mismatched ratios. At the elastic stage, the CTOD increased gradually with the increase of nominal stress. After the stress exceeded the yield stress, the CTOD rapidly grew at the retension stage. The compression stress over the yielding points could lead to the decrease of CTOD, which was similar with the tension stage. In the last loading stage, the increase of CTOD values demonstrates that the ductile crack growth occurs. The CTOD response on nominal stress curves has less sensitivity than on nominal strain as the material plastic phase in Figure 3D.
3.2 Effects of prestrain and strength mismatch on ductile crack growth
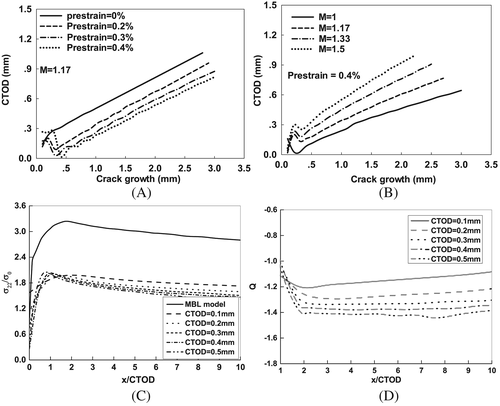
To address the effect prestrain history on crack growth resistance, this section presents the results of 2D analyses conducted on SENT specimens with mismatch ratio M = 1.17, joints width 2H = 12.8 mm, and initial crack size to width ratios a/W = 0.17. Four cases of the symmetrical prestrain levels, which are 0%, 0.2%, 0.3%, and 0.4%, are computed. Figure 4 provides a summary plot, which emphasizes the effects of symmetrical prestrain levels and mismatched on the crack growth behavior for the SENT specimens. Figures 4A and 4B compare the ductile fracture resistance of different prestrain values and mismatch ratios. The increase of prestrain values can result in the decreases of CTOD values in the retension stage. In Figure 4B, the resistance curves depend strongly on the mismatch ratio in the range of 1 ≤ M ≤ 1.5. The increase of mismatch ratio can elevate the slope of resistance curves.
 (10)
(10) is the reference stress component, which can be obtained from the MBL model solution with T = 0.x/CTOD = 4 represents the result output location ahead of the crack tip. Figure 4C shows the typical opening stress distribution with increased amounts of ductile fracture. Figure 4D provides the evolution of Q with increased values of CTOD in SENT specimens.
3.3 Crack tip stress distributions and constraints with prestrain effect
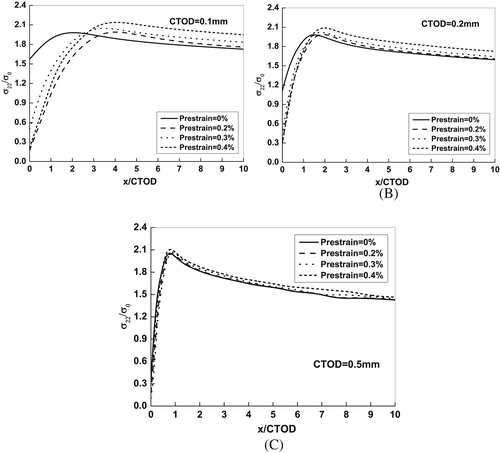
Figures 5A to 5C show the different opening stress fields at different crack extension, which can be characterized by CTOD from 0.1 to 0.5 mm considering the prestrain effect. It can be found that the maximum opening stress increases with the increase of prestrain amplitude at fixed CTOD values. An interesting observation from the evolution with the crack growth (CTOD) is the weak correlation between the maximum opening stress and prestrain cycle. While the elevation of opening stress without prestrain history leads to less significance of prestrain effect.
 (11)
(11) represents the case with prestrain cycle and the
 denotes the typical monotonic loading case. What should be emphasized on is the normalized crack tip distance given by x/CTOD = 4.
3.4 Crack tip stress distributions and constraints with combined effect of prestrain and weld strength mismatch
 (12)
(12) (13)
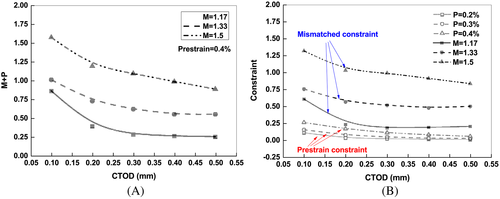
(13)The combined constraint parameter was investigated at the crack-tip distance given by x/CTOD = 4 for a fixed prestrain history with the variation of mismatched ratio as following in Figure 6A. This plot exhibited clearly trends on the variation of combined constraint with the increase of mismatch ratios, which was consistent with the results of exclusive prestrain constraint. The combined constraint significantly elevated the constraint level with the increased crack extension. It revealed that the weld strength mismatch constraint for 1≦M≦1.5 was more sensitive than the prestrain constraint with the symmetrical loading from 0 to 0.4%, which was compared by the separate result of constraints from Figure 6B.
4 CONCLUDING REMARKS
This paper addresses the combined effect of prestrain cycle and weld strength mismatch on ductile crack growth resistance and fracture constraint by characterization of fracture resistance curves and different constraint parameters in specific SENT specimens. A four-parameter description in terms of J-Q-P-M was used to investigate the crack tip constraints of different potential effects on the near-tip stress fields. In particular, it revealed some features of the evolution of crack opening stress field based on this methodology. Firstly, the hysteresis loop of CTOD values enlarged with the increase of prestrain amplitudes and overmatch ratios. Secondly, the ductile crack resistance curves of SENT specimens influenced by the prestrain history and weld strength mismatch showed different tendency. Thirdly, the combined constraint levels of different conditions decreased with the crack extension, especially for crack initial growth stage CTOD<0.2 mm. The crack driving force and global deformation depended more strongly on the strength mismatch than the prestrain amplitudes according to the separate constraints extracted from the combined results.
Since we have not explored 3D models, the trends and results in this study are limited to the analyses by plane strain models. Further work will focus on the validation of the efforts of prestrain cycle and weld strength mismatch by experiments.
ACKNOWLEDGMENTS
The author sincerely appreciates Prof. Zhiliang Zhang from Norwegian University of Science and Technology for his UMAT subroutine of the Completed Gurson Model. Lin Su from SINOPEC Oil & Gas Pipeline Inspection Co., Ltd., is acknowledged for the conception inspiration in the investigation contents.
FUNDING
The work is supported by the Fundamental Research Funds for the Central Universities (2019XKQYMS10), the China Postdoctoral Science Foundation (2018M642355), the Natural Science Foundation of Xuzhou (KC18072), and Six Talent Peaks Project of Jiangsu Province (GDZB-032) and Science and Technology Young Talents Supporting Project of Jiangsu Association for Science and Technology.


